> ## Documentation Index
> Fetch the complete documentation index at: https://laminar.sh/docs/llms.txt
> Use this file to discover all available pages before exploring further.
# Evaluations
Evaluations are how you answer one question before shipping a prompt, model, or agent change: *is this version better than the one in production*. You answer it by running the new version against a fixed set of inputs, scoring every output, and comparing the scores to the previous run.
**Laminar evaluations are the offline testing layer for your agents and LLM pipelines.** You define a list of inputs, a function that produces an output, and one or more functions that score it. Laminar runs them in parallel, traces every call, stores the scores, and **[compares them](/evaluations/comparing-runs) across [runs](/evaluations/concepts) and [groups](/evaluations/comparing-runs#group-runs-to-compare-them)**.
 ## What an evaluation can help you answer
Evaluations are for questions you can answer with a score. Some of them are obvious, some are not:
* **Did the new prompt break anything?** Same dataset, new prompt, see if any scores regressed.
* **Is the cheaper model good enough for this task?** Swap `gpt-5` for `gpt-5-mini`, run the same inputs, compare.
* **Does this tool actually do what I think it does?** Score the tool's output against a target, not the agent's final answer.
* **Did the last hundred production traces expose a case my evals don't cover?** Pull the failing traces into a [dataset](/datasets/introduction) and rerun the evaluation against them.
If you've ever changed a prompt and hoped nothing broke, this is the answer to that hope.
## Explore a run, then track progress across runs
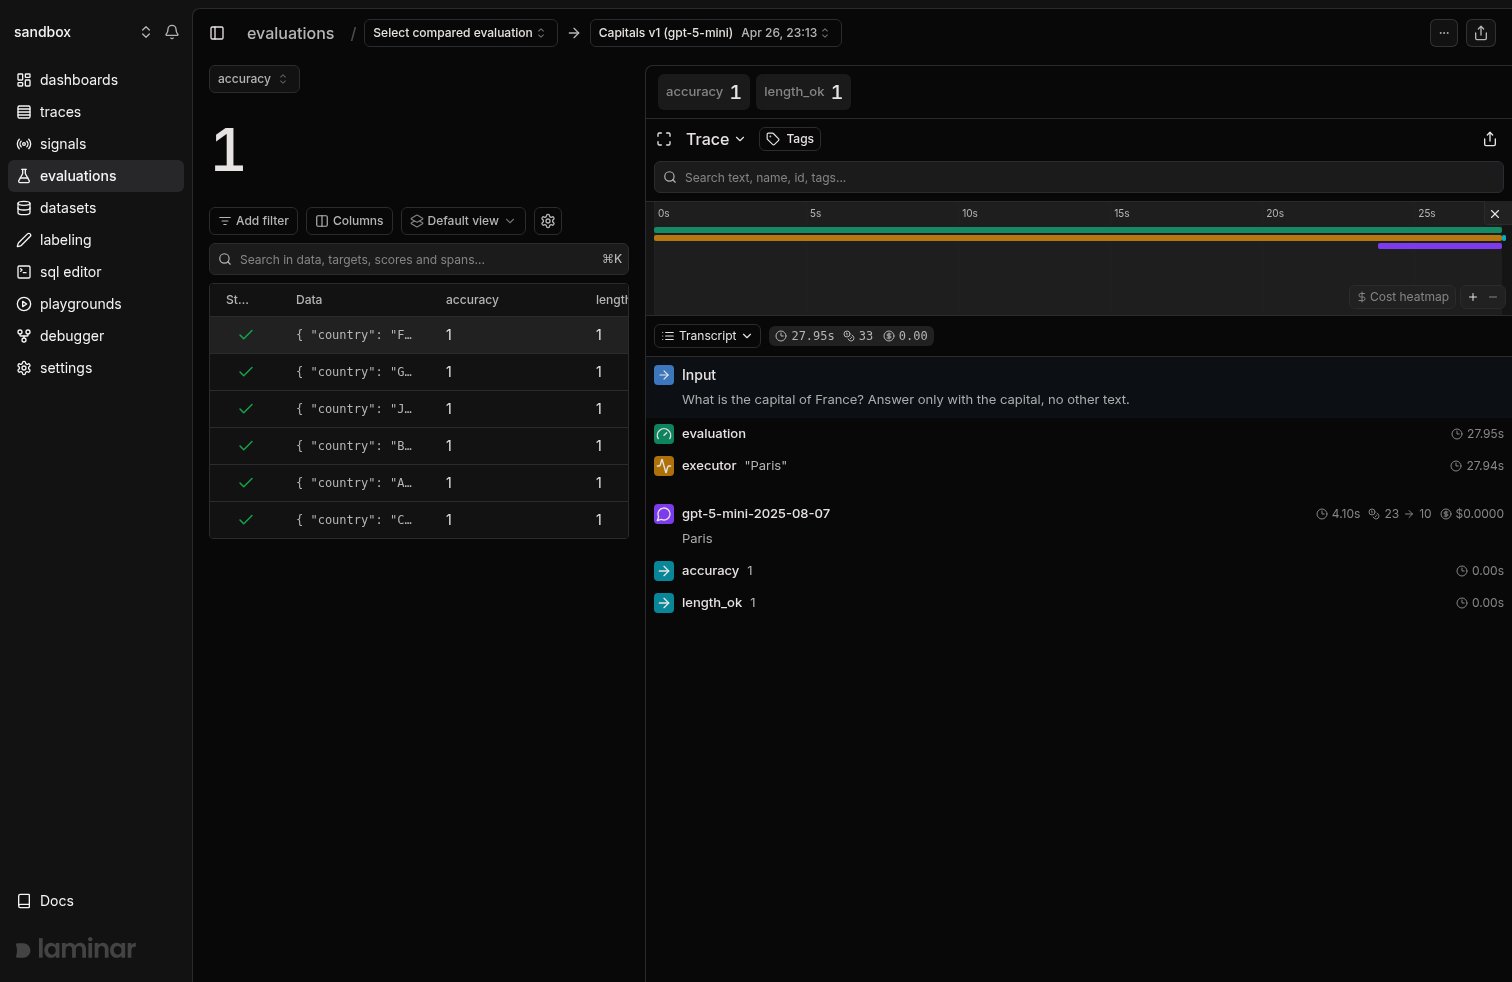
The run view above answers *why a datapoint scored the way it did*: every datapoint and its scores on the left, the selected datapoint's full trace on the right, so you go from a score to the exact model call behind it in one click.
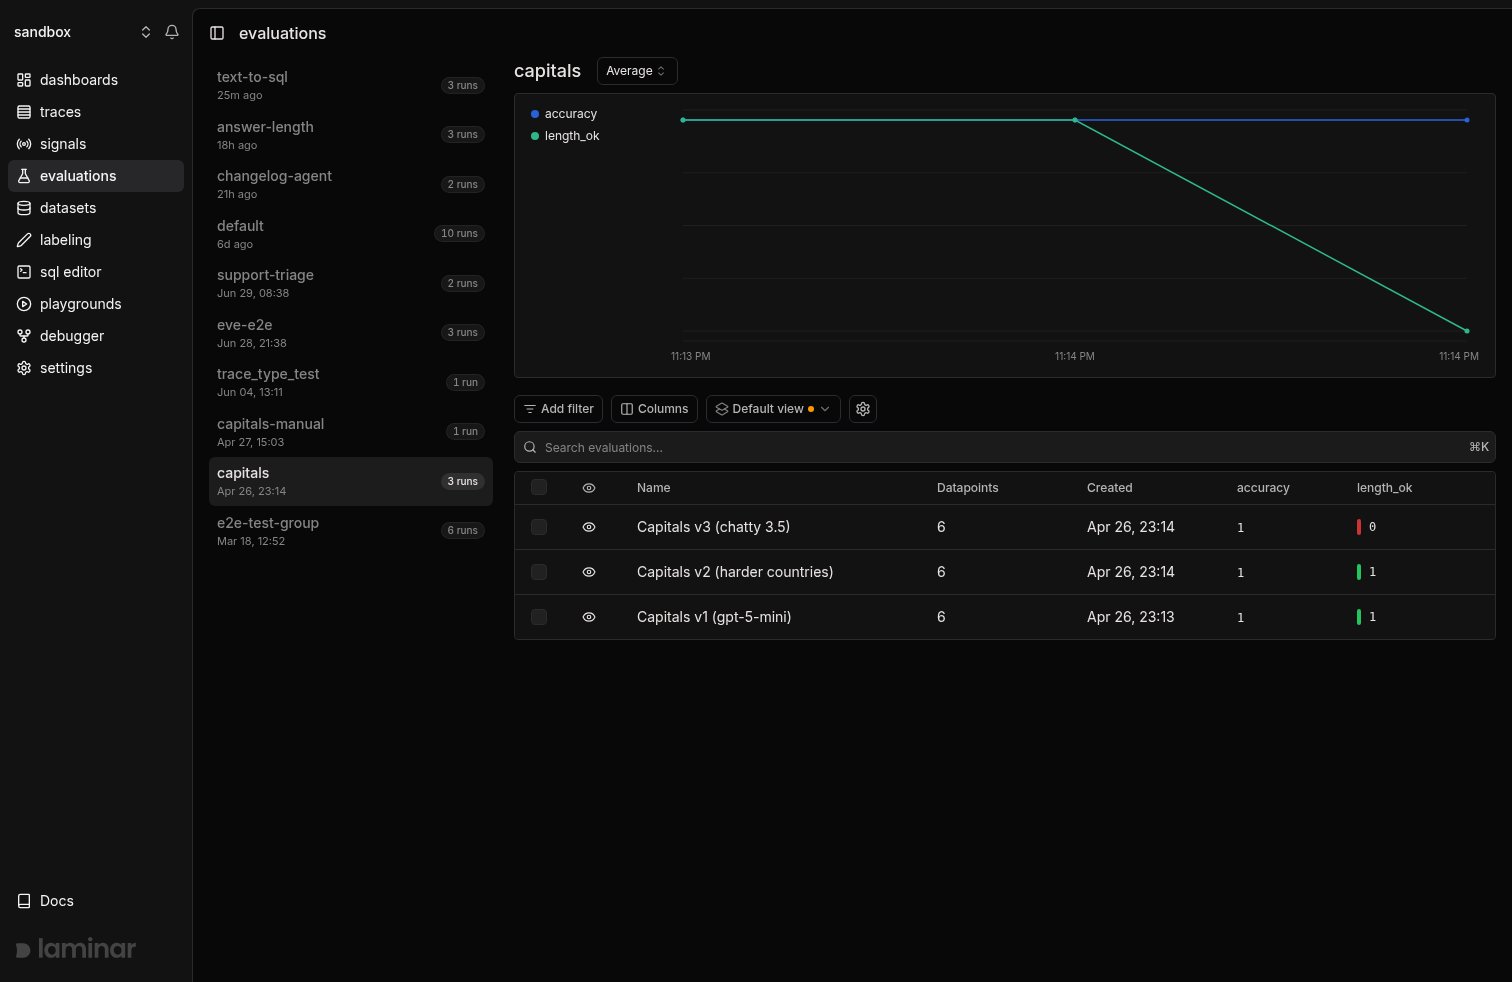
The group view answers *did the score move*: runs sharing a group name are charted together, one line per score dimension, so a regression on any dimension is visible the moment the run lands.
## What an evaluation can help you answer
Evaluations are for questions you can answer with a score. Some of them are obvious, some are not:
* **Did the new prompt break anything?** Same dataset, new prompt, see if any scores regressed.
* **Is the cheaper model good enough for this task?** Swap `gpt-5` for `gpt-5-mini`, run the same inputs, compare.
* **Does this tool actually do what I think it does?** Score the tool's output against a target, not the agent's final answer.
* **Did the last hundred production traces expose a case my evals don't cover?** Pull the failing traces into a [dataset](/datasets/introduction) and rerun the evaluation against them.
If you've ever changed a prompt and hoped nothing broke, this is the answer to that hope.
## Explore a run, then track progress across runs
The run view above answers *why a datapoint scored the way it did*: every datapoint and its scores on the left, the selected datapoint's full trace on the right, so you go from a score to the exact model call behind it in one click.
The group view answers *did the score move*: runs sharing a group name are charted together, one line per score dimension, so a regression on any dimension is visible the moment the run lands.
 ## Render eval traces your way
Every datapoint in a run has the same trace shape, so reviewing a run means reading the same few fields over and over. [Custom rendering](/evaluations/custom-rendering) lets you replace the default trace view with one built for your eval: a small JSX component that receives the executor and evaluator spans and renders exactly what you need to judge a row.
## Render eval traces your way
Every datapoint in a run has the same trace shape, so reviewing a run means reading the same few fields over and over. [Custom rendering](/evaluations/custom-rendering) lets you replace the default trace view with one built for your eval: a small JSX component that receives the executor and evaluator spans and renders exactly what you need to judge a row.
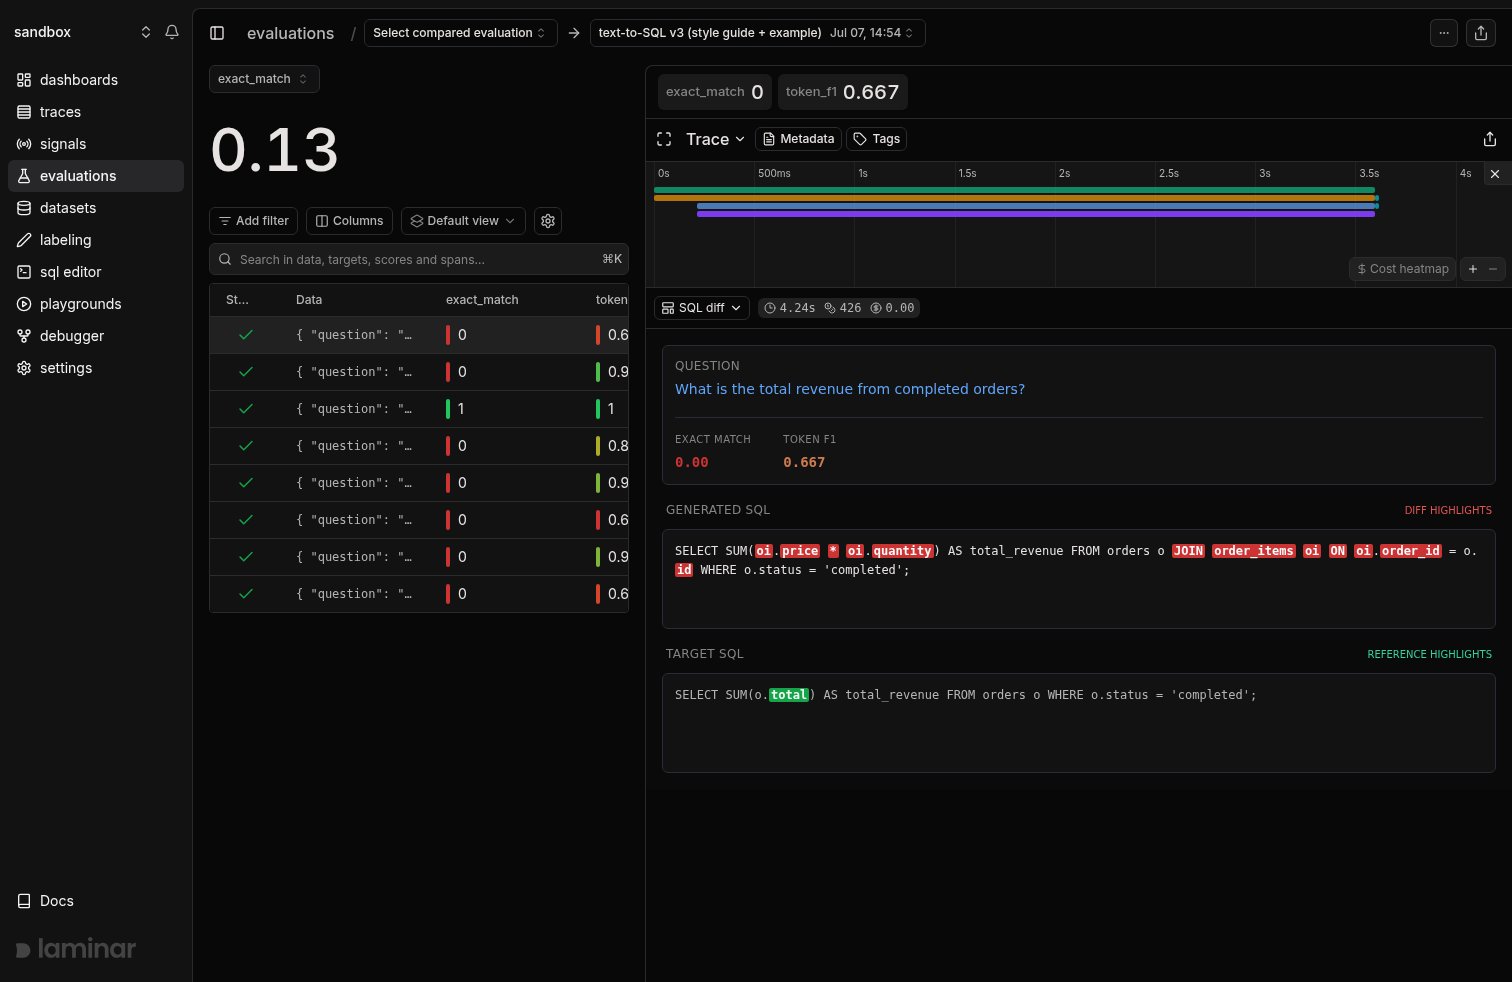 The view sticks as you click through datapoints, so reviewing a whole run takes seconds per row. See [Custom rendering](/evaluations/custom-rendering) for the full walkthrough.
## Anatomy of an evaluation
An evaluation has four parts:
* **Datapoints**: a list of `{ data, target?, metadata? }` objects. `data` is what the executor receives, `target` is what the evaluators compare against, `metadata` is anything extra you want to filter or query on.
* **Executor**: a function that takes `data` and returns whatever you want to score: the agent's output, a tool call, a parsed field.
* **Evaluators**: one or more functions that take the executor's output (and optionally `target`) and return a number or a map of numbers. Each number is a score dimension.
* **Group name**: a string that ties related runs together so Laminar can chart them over time.
When you call `evaluate()`, Laminar runs the executor on every datapoint in parallel, runs each evaluator against the output, records every call as a trace, and stores the scores on the datapoint.
Every datapoint becomes one trace with an `EVALUATION` root span, an `EXECUTOR` child, and one `EVALUATOR` child per scoring function. You can query those spans in the [SQL editor](/platform/sql-editor) the same way you query any other trace.
## Run an evaluation from code or from the CLI
Evaluations are SDK-first. You write the file once, then run it whichever way fits your workflow:
* **As a script**: `python my_eval.py` or `tsx my-eval.ts`. The script runs the evaluation and exits.
* **Via the CLI**: `lmnr eval` (Python) or `npx lmnr eval` (TypeScript) picks up every file matching the eval convention in your `evals/` directory and runs them. Use this in CI or when you want to run many evals at once.
Both paths talk to the same `evaluate()` function. The CLI is just a runner.
## Next steps
Write your first evaluation, run it, and read the results.
Datapoints, executors, evaluators, groups, and how they map to traces.
Group runs, read the progression chart, and do side-by-side diffs.
Back evaluations with a Laminar dataset instead of hardcoded lists.
The view sticks as you click through datapoints, so reviewing a whole run takes seconds per row. See [Custom rendering](/evaluations/custom-rendering) for the full walkthrough.
## Anatomy of an evaluation
An evaluation has four parts:
* **Datapoints**: a list of `{ data, target?, metadata? }` objects. `data` is what the executor receives, `target` is what the evaluators compare against, `metadata` is anything extra you want to filter or query on.
* **Executor**: a function that takes `data` and returns whatever you want to score: the agent's output, a tool call, a parsed field.
* **Evaluators**: one or more functions that take the executor's output (and optionally `target`) and return a number or a map of numbers. Each number is a score dimension.
* **Group name**: a string that ties related runs together so Laminar can chart them over time.
When you call `evaluate()`, Laminar runs the executor on every datapoint in parallel, runs each evaluator against the output, records every call as a trace, and stores the scores on the datapoint.
Every datapoint becomes one trace with an `EVALUATION` root span, an `EXECUTOR` child, and one `EVALUATOR` child per scoring function. You can query those spans in the [SQL editor](/platform/sql-editor) the same way you query any other trace.
## Run an evaluation from code or from the CLI
Evaluations are SDK-first. You write the file once, then run it whichever way fits your workflow:
* **As a script**: `python my_eval.py` or `tsx my-eval.ts`. The script runs the evaluation and exits.
* **Via the CLI**: `lmnr eval` (Python) or `npx lmnr eval` (TypeScript) picks up every file matching the eval convention in your `evals/` directory and runs them. Use this in CI or when you want to run many evals at once.
Both paths talk to the same `evaluate()` function. The CLI is just a runner.
## Next steps
Write your first evaluation, run it, and read the results.
Datapoints, executors, evaluators, groups, and how they map to traces.
Group runs, read the progression chart, and do side-by-side diffs.
Back evaluations with a Laminar dataset instead of hardcoded lists.