 ## Generate a template
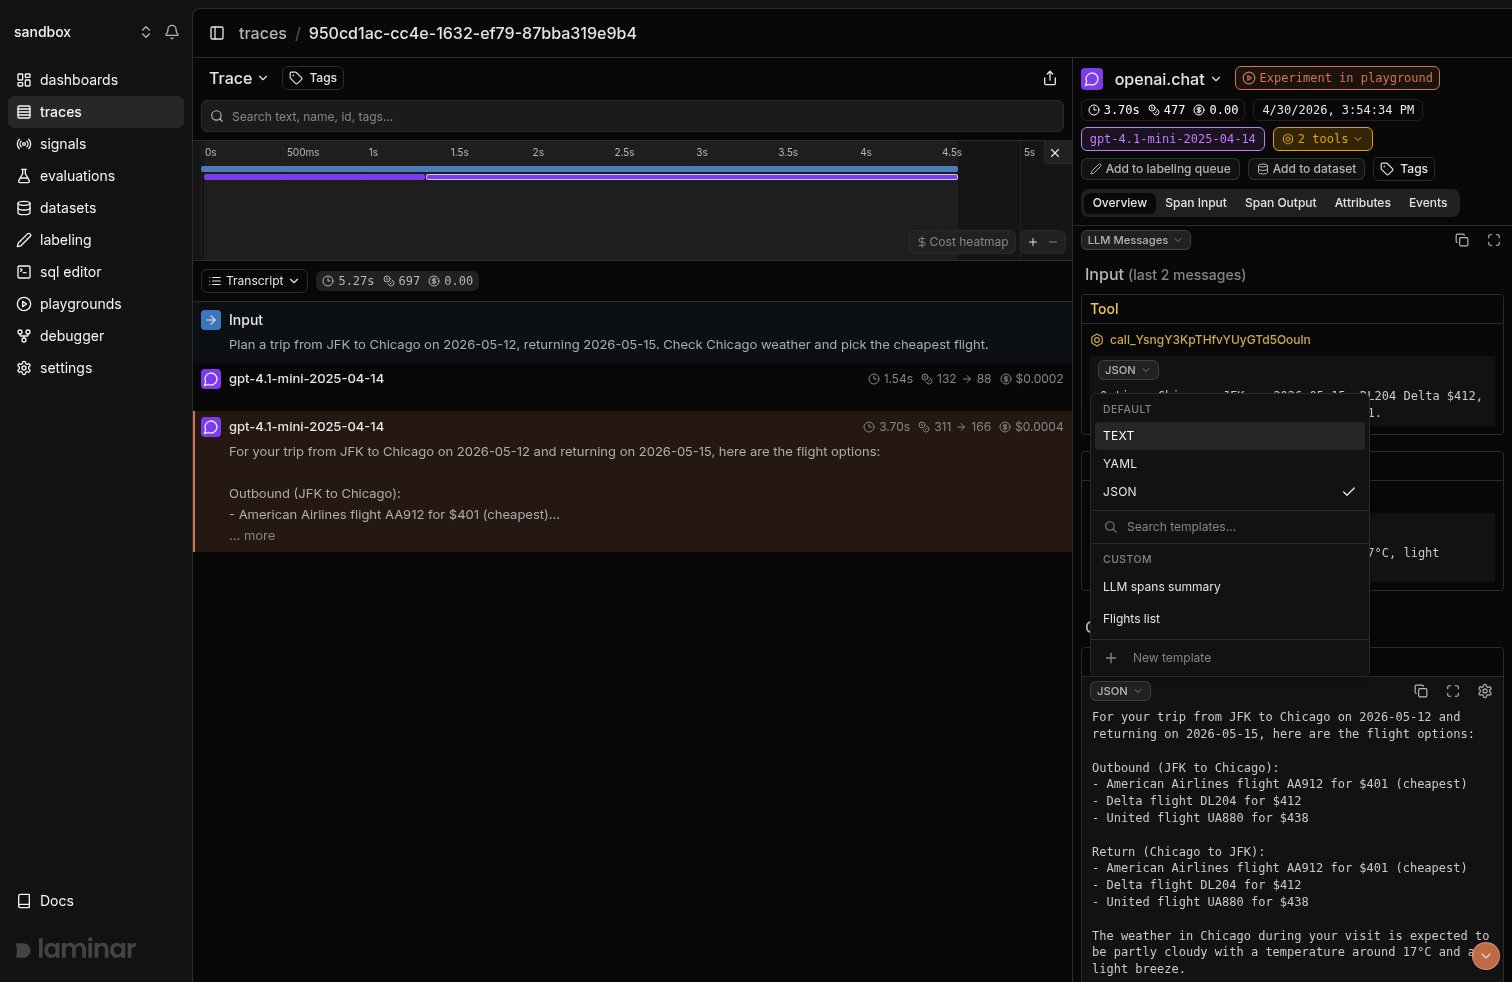
Open any I/O view, pick the mode dropdown, and click **+ New template**. The dialog opens with the pane's payload already loaded under the **Sample data** tab, so Laminar knows the shape of your data before you type anything. Then:
1. Name the template.
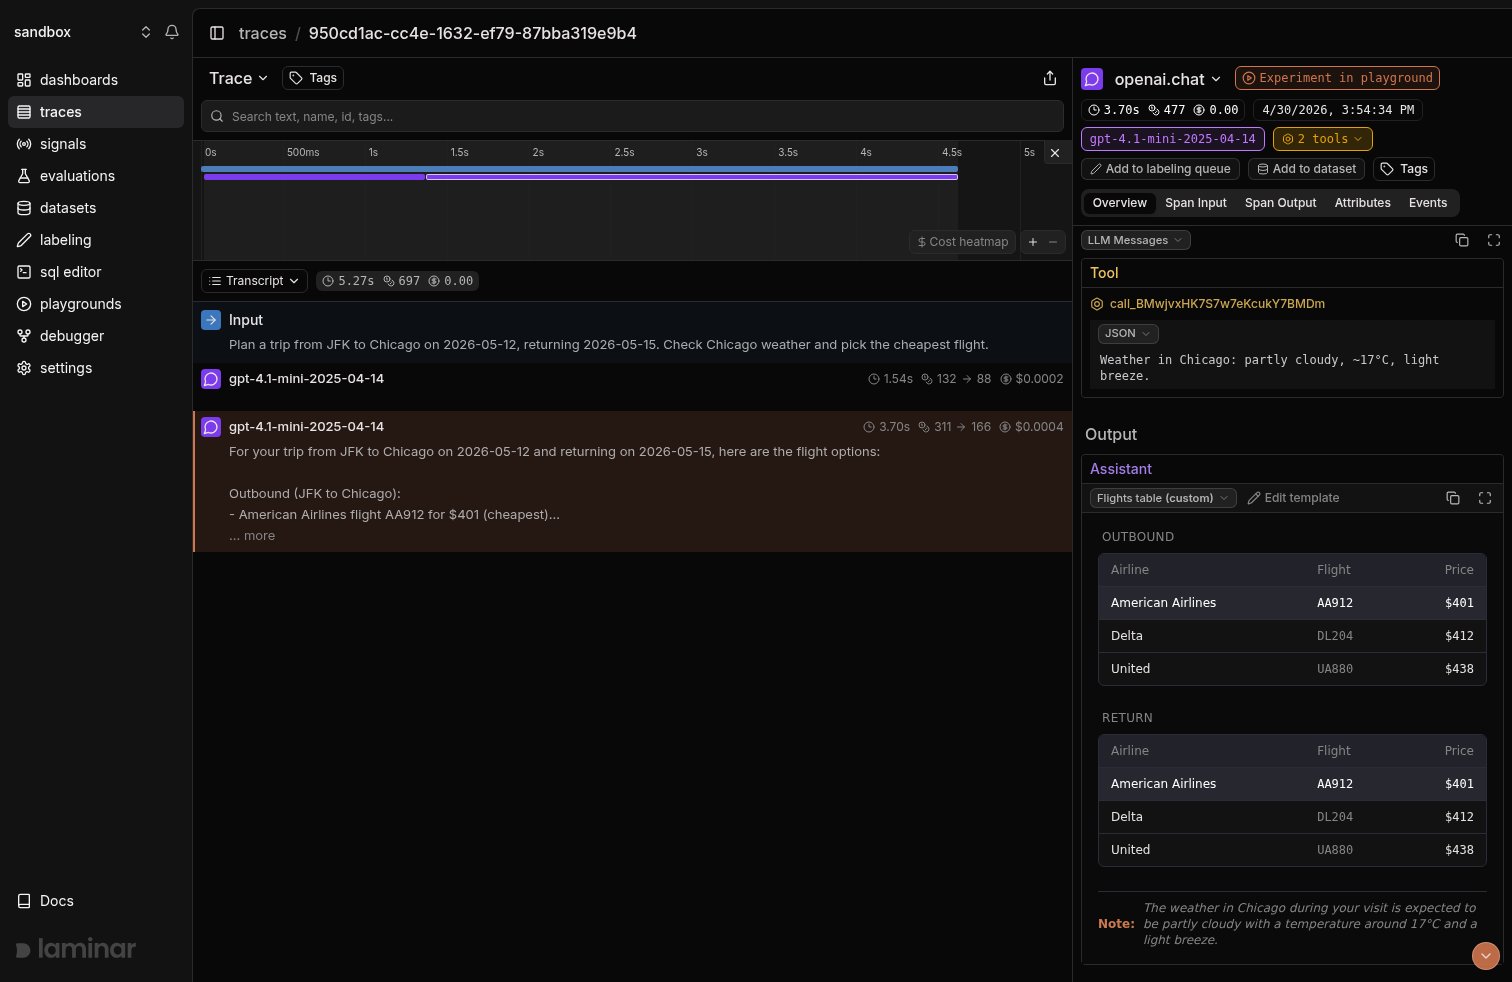
2. Describe the view you want in the text field, like "a table of flights with price, airline, and departure time, cheapest first".
3. Click **Generate**. Laminar writes the JSX against your sample data and the **Preview** tab renders it live.
4. Not quite right? Describe the change and click **Request changes**. Each iteration edits the existing template instead of starting over.
5. Click **Save**.
## Generate a template
Open any I/O view, pick the mode dropdown, and click **+ New template**. The dialog opens with the pane's payload already loaded under the **Sample data** tab, so Laminar knows the shape of your data before you type anything. Then:
1. Name the template.
2. Describe the view you want in the text field, like "a table of flights with price, airline, and departure time, cheapest first".
3. Click **Generate**. Laminar writes the JSX against your sample data and the **Preview** tab renders it live.
4. Not quite right? Describe the change and click **Request changes**. Each iteration edits the existing template instead of starting over.
5. Click **Save**.
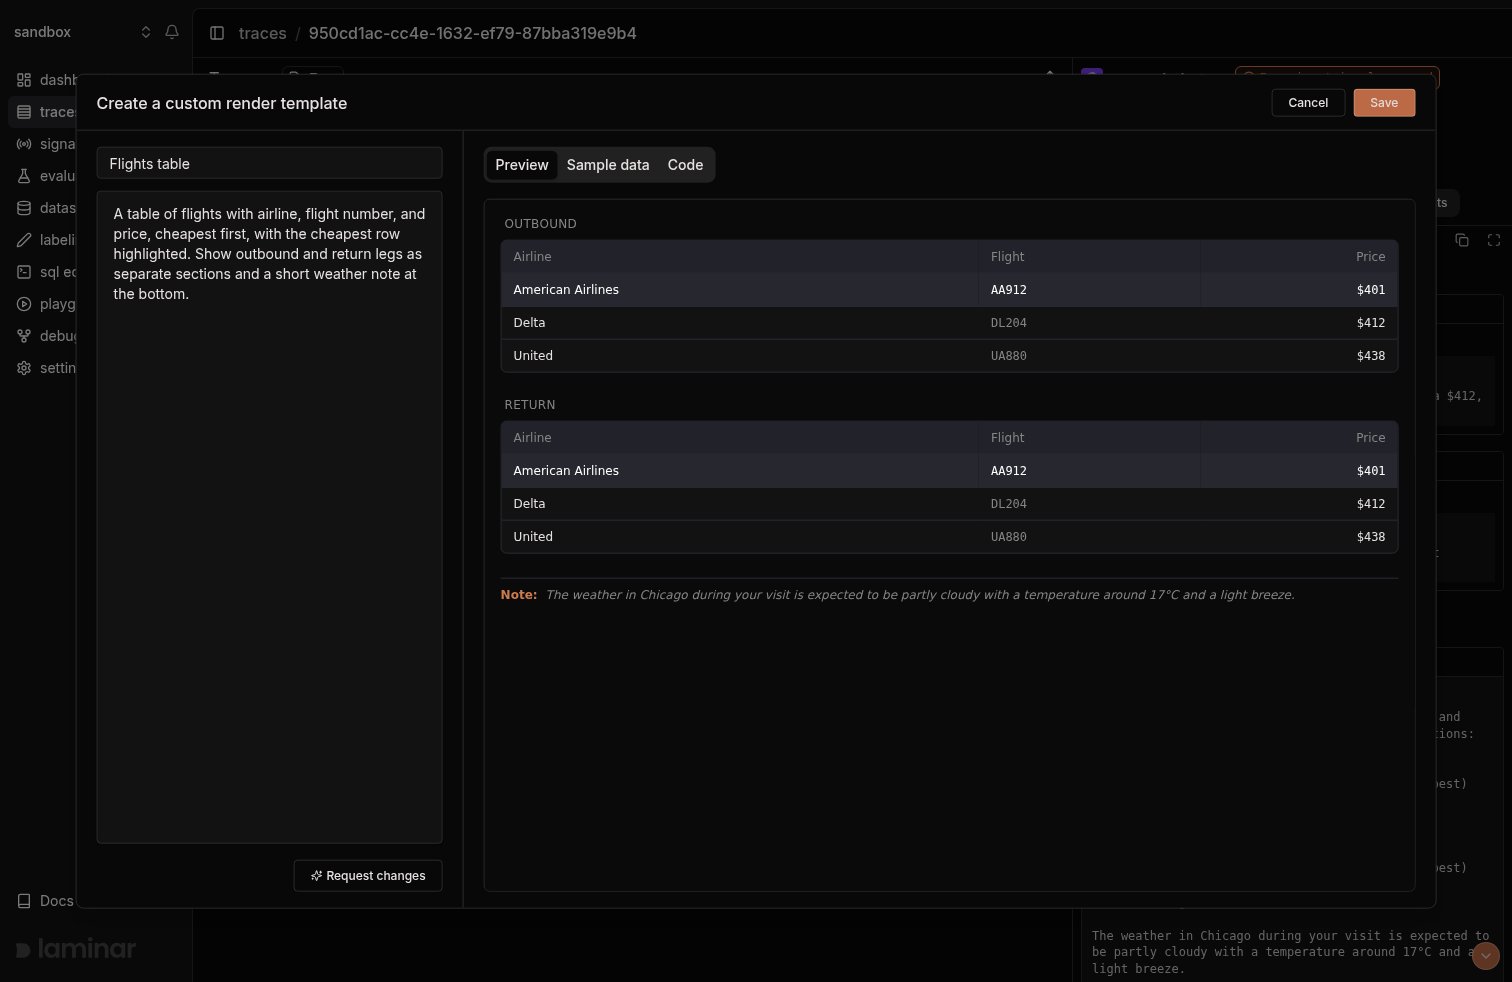 The generated code follows Laminar's style guide (theme tokens, Tailwind classes), so templates match the rest of the UI without extra prompting.
You can also write or edit the JSX by hand in the **Code** tab. The same tab has a **Copy prompt** button that packages the style guide and your sample data into a prompt for an external AI tool, if you'd rather generate the code elsewhere and paste it back.
## Manage templates
Open **Project Settings → Render Templates** to edit or delete any template in the project, span-scoped and trace-scoped alike.
## What a span template looks like
A template is one function that takes `{ data }` and returns JSX:
```jsx theme={null}
function({ data }) {
return (
The generated code follows Laminar's style guide (theme tokens, Tailwind classes), so templates match the rest of the UI without extra prompting.
You can also write or edit the JSX by hand in the **Code** tab. The same tab has a **Copy prompt** button that packages the style guide and your sample data into a prompt for an external AI tool, if you'd rather generate the code elsewhere and paste it back.
## Manage templates
Open **Project Settings → Render Templates** to edit or delete any template in the project, span-scoped and trace-scoped alike.
## What a span template looks like
A template is one function that takes `{ data }` and returns JSX:
```jsx theme={null}
function({ data }) {
return (
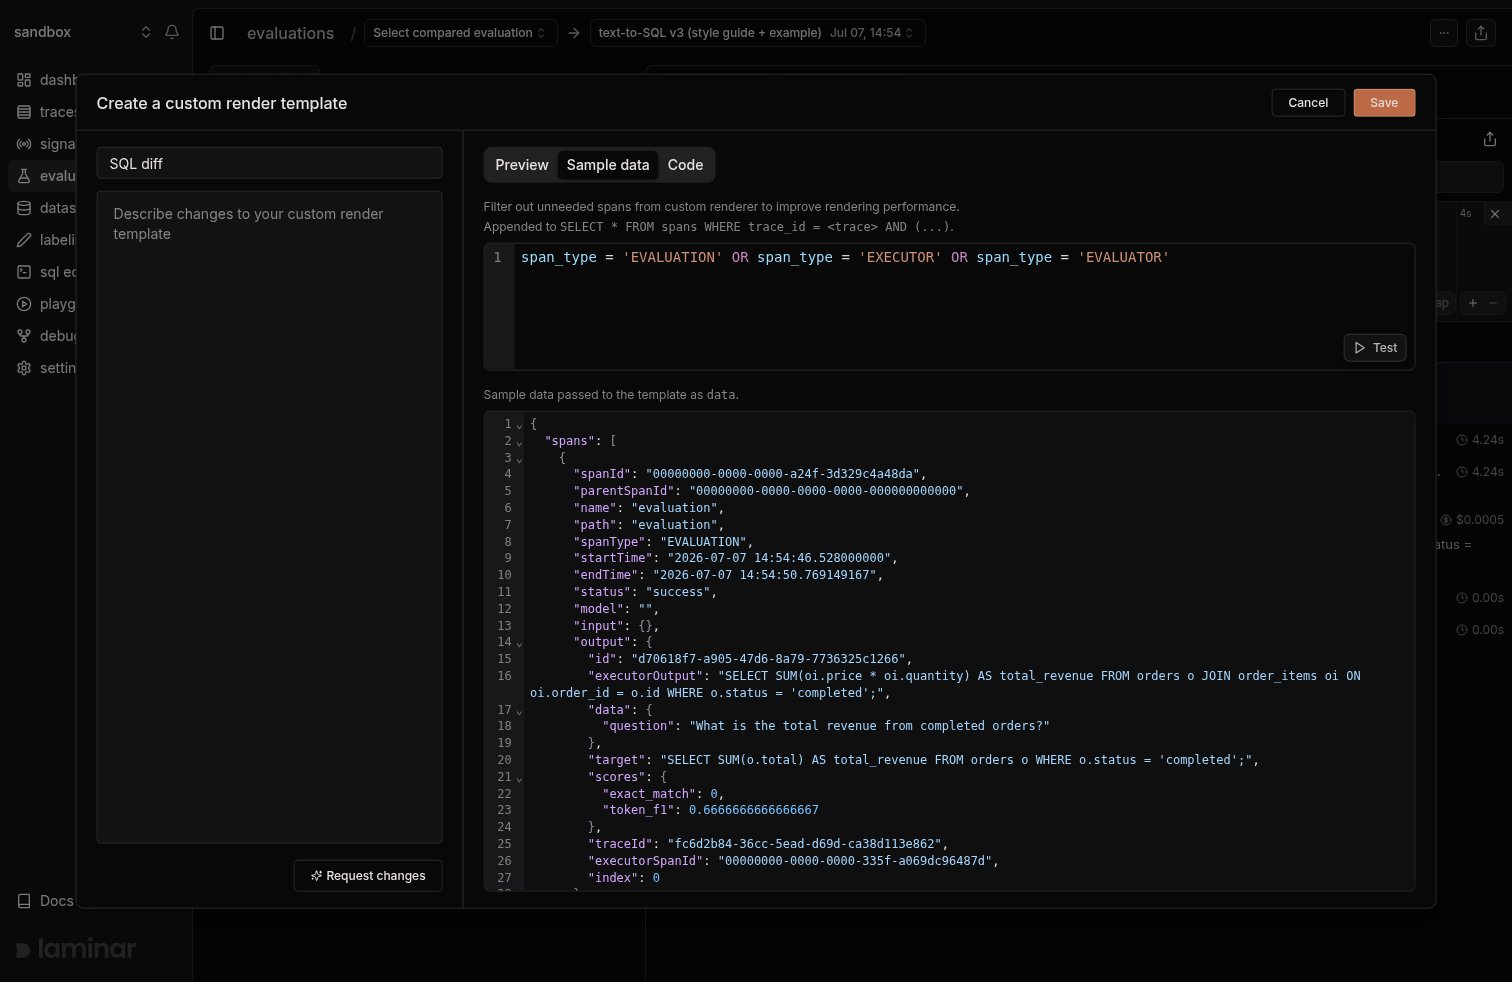
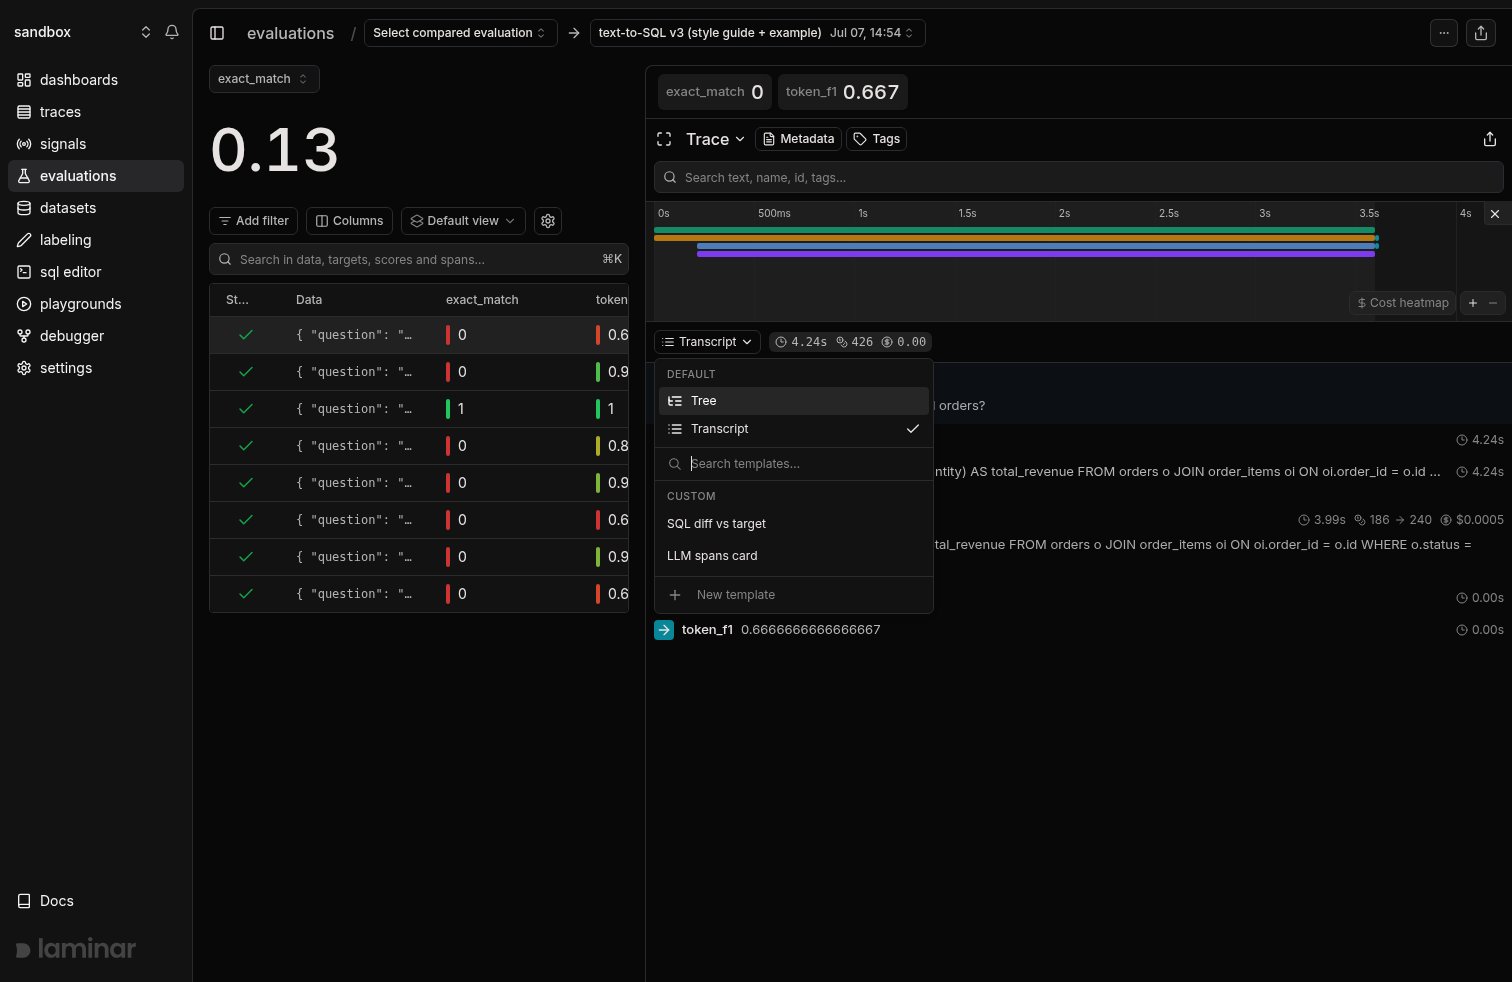 The flow is the same describe-and-generate as for span templates, with one addition: a trace template has a **Span filter (SQL WHERE)** that picks which spans it receives. Whatever the filter says is appended to `SELECT * FROM spans WHERE trace_id =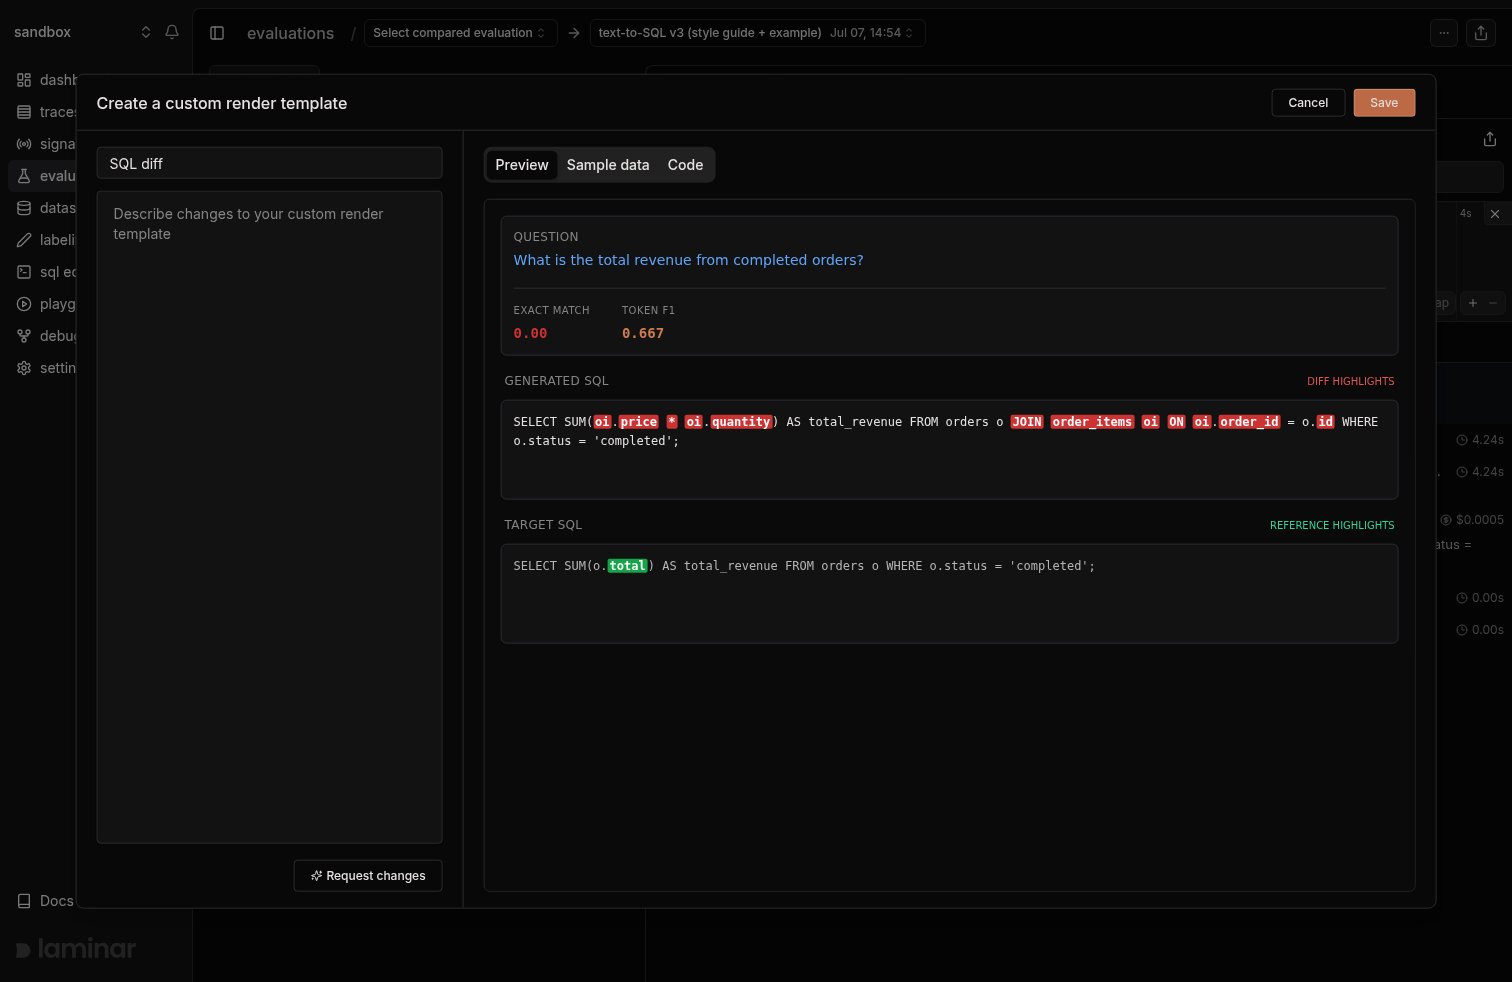
 The pane remembers which view you picked. Once you switch a trace to a template, every trace you open next renders through it until you switch back, which makes paging through eval datapoints or similar traces fast.
### What the template receives
`data` is an object with two fields:
```typescript theme={null}
{
spans: Array<{
spanId: string;
parentSpanId: string | null;
name: string;
path: string;
spanType: string; // 'LLM', 'TOOL', 'EXECUTOR', 'EVALUATOR', ...
startTime: string;
endTime: string;
status: string;
model: string;
input: unknown; // JSON-parsed when possible, otherwise raw string
output: unknown;
attributes: unknown;
}>;
truncated: boolean; // true if the trace had more than 256 matching spans
}
```
Spans arrive ordered by start time. At most 256 spans are passed to the template; if the filter matches more, `truncated` is `true`, so render a notice when you expect long traces.
### Example: diff an eval output against its target
The evaluation below generates SQL from analytics questions and scores it against a target query with `exact_match` and `token_f1` evaluators:
```typescript text2sql-eval.ts theme={null}
import { evaluate, LaminarAiSdkTelemetry } from '@lmnr-ai/lmnr';
import { registerTelemetry, generateText } from 'ai';
import { openai } from '@ai-sdk/openai';
registerTelemetry(new LaminarAiSdkTelemetry());
const SCHEMA = `
customers(id, name, email, created_at)
orders(id, customer_id, total, status, created_at)
order_items(id, order_id, product_id, quantity, price)
products(id, name, category, price)
`.trim();
const generateSql = async (data: { question: string }) => {
const response = await generateText({
model: openai('gpt-5-mini'),
system: `You translate analytics questions into SQL for this schema:\n${SCHEMA}\nReturn ONLY the SQL query.`,
prompt: data.question,
});
return response.text.trim();
};
const normalize = (sql: string) => sql.toLowerCase().replace(/\s+/g, ' ').replace(/;\s*$/, '').trim();
const tokens = (sql: string) => normalize(sql).split(/[\s,()]+/).filter(Boolean);
const exactMatch = (output: string, target: string) =>
normalize(output) === normalize(target) ? 1 : 0;
const tokenF1 = (output: string, target: string) => {
const out = tokens(output);
const tgt = tokens(target);
const tgtCounts = new Map
The pane remembers which view you picked. Once you switch a trace to a template, every trace you open next renders through it until you switch back, which makes paging through eval datapoints or similar traces fast.
### What the template receives
`data` is an object with two fields:
```typescript theme={null}
{
spans: Array<{
spanId: string;
parentSpanId: string | null;
name: string;
path: string;
spanType: string; // 'LLM', 'TOOL', 'EXECUTOR', 'EVALUATOR', ...
startTime: string;
endTime: string;
status: string;
model: string;
input: unknown; // JSON-parsed when possible, otherwise raw string
output: unknown;
attributes: unknown;
}>;
truncated: boolean; // true if the trace had more than 256 matching spans
}
```
Spans arrive ordered by start time. At most 256 spans are passed to the template; if the filter matches more, `truncated` is `true`, so render a notice when you expect long traces.
### Example: diff an eval output against its target
The evaluation below generates SQL from analytics questions and scores it against a target query with `exact_match` and `token_f1` evaluators:
```typescript text2sql-eval.ts theme={null}
import { evaluate, LaminarAiSdkTelemetry } from '@lmnr-ai/lmnr';
import { registerTelemetry, generateText } from 'ai';
import { openai } from '@ai-sdk/openai';
registerTelemetry(new LaminarAiSdkTelemetry());
const SCHEMA = `
customers(id, name, email, created_at)
orders(id, customer_id, total, status, created_at)
order_items(id, order_id, product_id, quantity, price)
products(id, name, category, price)
`.trim();
const generateSql = async (data: { question: string }) => {
const response = await generateText({
model: openai('gpt-5-mini'),
system: `You translate analytics questions into SQL for this schema:\n${SCHEMA}\nReturn ONLY the SQL query.`,
prompt: data.question,
});
return response.text.trim();
};
const normalize = (sql: string) => sql.toLowerCase().replace(/\s+/g, ' ').replace(/;\s*$/, '').trim();
const tokens = (sql: string) => normalize(sql).split(/[\s,()]+/).filter(Boolean);
const exactMatch = (output: string, target: string) =>
normalize(output) === normalize(target) ? 1 : 0;
const tokenF1 = (output: string, target: string) => {
const out = tokens(output);
const tgt = tokens(target);
const tgtCounts = new Map
Question
{question}
{evaluators.map((s) => (
{s.name}
{String(s.output)}
))}
Model output
{left.map((part, idx) =>
Target
{right.map((part, idx) =>
Span list truncated.
)}
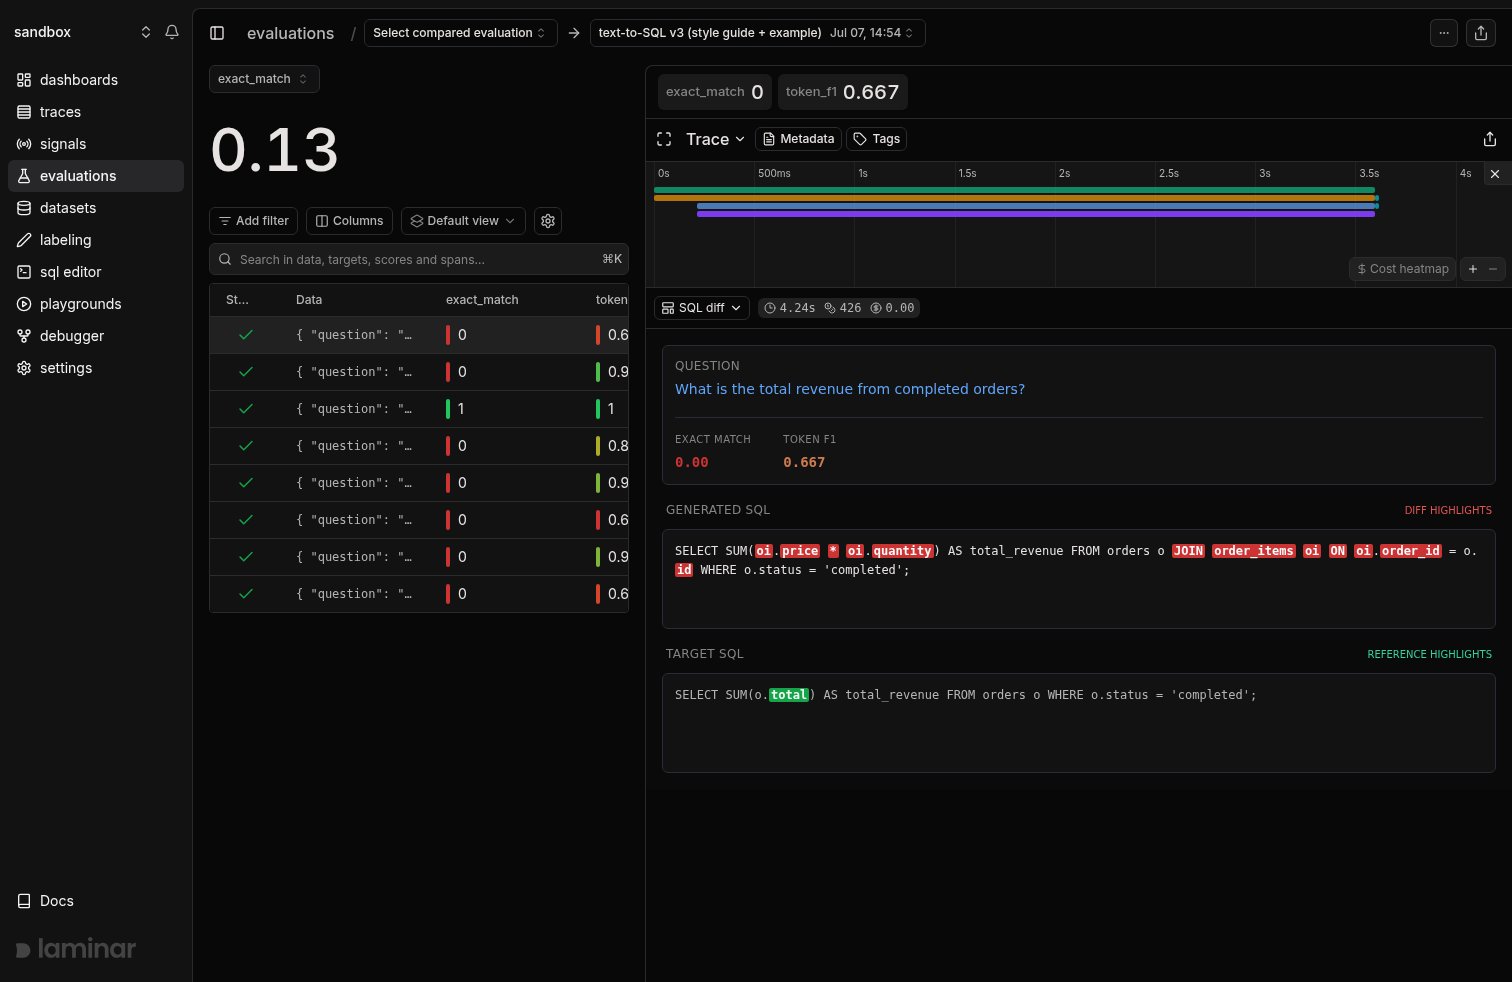 Clicking through datapoints keeps the view, so reviewing a whole run takes seconds per row. See [Custom rendering](/evaluations/custom-rendering) for the eval-focused walkthrough and [Compare runs](/evaluations/comparing-runs#see-why-a-score-moved-with-a-render-template) for how this fits into a regression workflow.
## Next steps
Clicking through datapoints keeps the view, so reviewing a whole run takes seconds per row. See [Custom rendering](/evaluations/custom-rendering) for the eval-focused walkthrough and [Compare runs](/evaluations/comparing-runs#see-why-a-score-moved-with-a-render-template) for how this fits into a regression workflow.
## Next steps