> ## Documentation Index
> Fetch the complete documentation index at: https://laminar.sh/docs/llms.txt
> Use this file to discover all available pages before exploring further.
# Quickstart
This quickstart walks through the full Signals loop: *generate traces, write a Signal that reads them, run it, and look at the events*.
Every new Laminar project ships with a **Failure Detector** signal pre-created and triggered automatically on traces with more than 1000 tokens. It categorizes issues as `tool_error`, `api_error`, `logic_error`, `looping`, `wrong_tool`, `timeout`, or `other`. You don't need to build this one yourself. Open it from the Signals list to see events as soon as your traces start arriving.
## Prerequisites
* A Laminar project and `LMNR_PROJECT_API_KEY`.
* An agent or LLM app whose traces land in Laminar. The example below uses the [Claude Agent SDK](/docs/tracing/integrations/claude-agent-sdk) to produce traces quickly.
## 1. Generate traces
Any traced application will do. The Claude Agent SDK example below sends a handful of prompts and emits one trace per prompt. Enough to exercise a Signal end-to-end.
```python theme={null}
import asyncio
import os
from claude_agent_sdk import ClaudeSDKClient
from lmnr import Laminar, observe
Laminar.initialize(project_api_key=os.environ["LMNR_PROJECT_API_KEY"])
PROMPTS = [
"Give me a one-line Python function to reverse a string.",
"Explain backpressure in distributed systems in one sentence.",
"What is the CAP theorem? Answer in one sentence.",
"Write a single bash command to find all .py files modified in the last day.",
"Why does TCP use three-way handshake? One sentence.",
"Give me a one-line idiomatic replacement for `for item in arr: print(item)` in Python.",
"Explain memoization in one sentence.",
"What is a REST API? One sentence.",
"What is an LLM hallucination? One sentence.",
"One-line SQL to find top 5 users by order count.",
]
@observe(name="quickstart_agent")
async def ask(prompt: str) -> None:
async with ClaudeSDKClient() as client:
await client.query(prompt)
async for _ in client.receive_response():
pass
async def main() -> None:
for p in PROMPTS:
await ask(p)
if __name__ == "__main__":
asyncio.run(main())
```
Run it, then refresh the Laminar traces page to confirm the `quickstart_agent` traces arrive.
## 2. Open Signals
Click **Signals** in the project sidebar. If this is a new project, the **Failure Detector** signal is already there, ready to run on any trace over 1000 tokens.
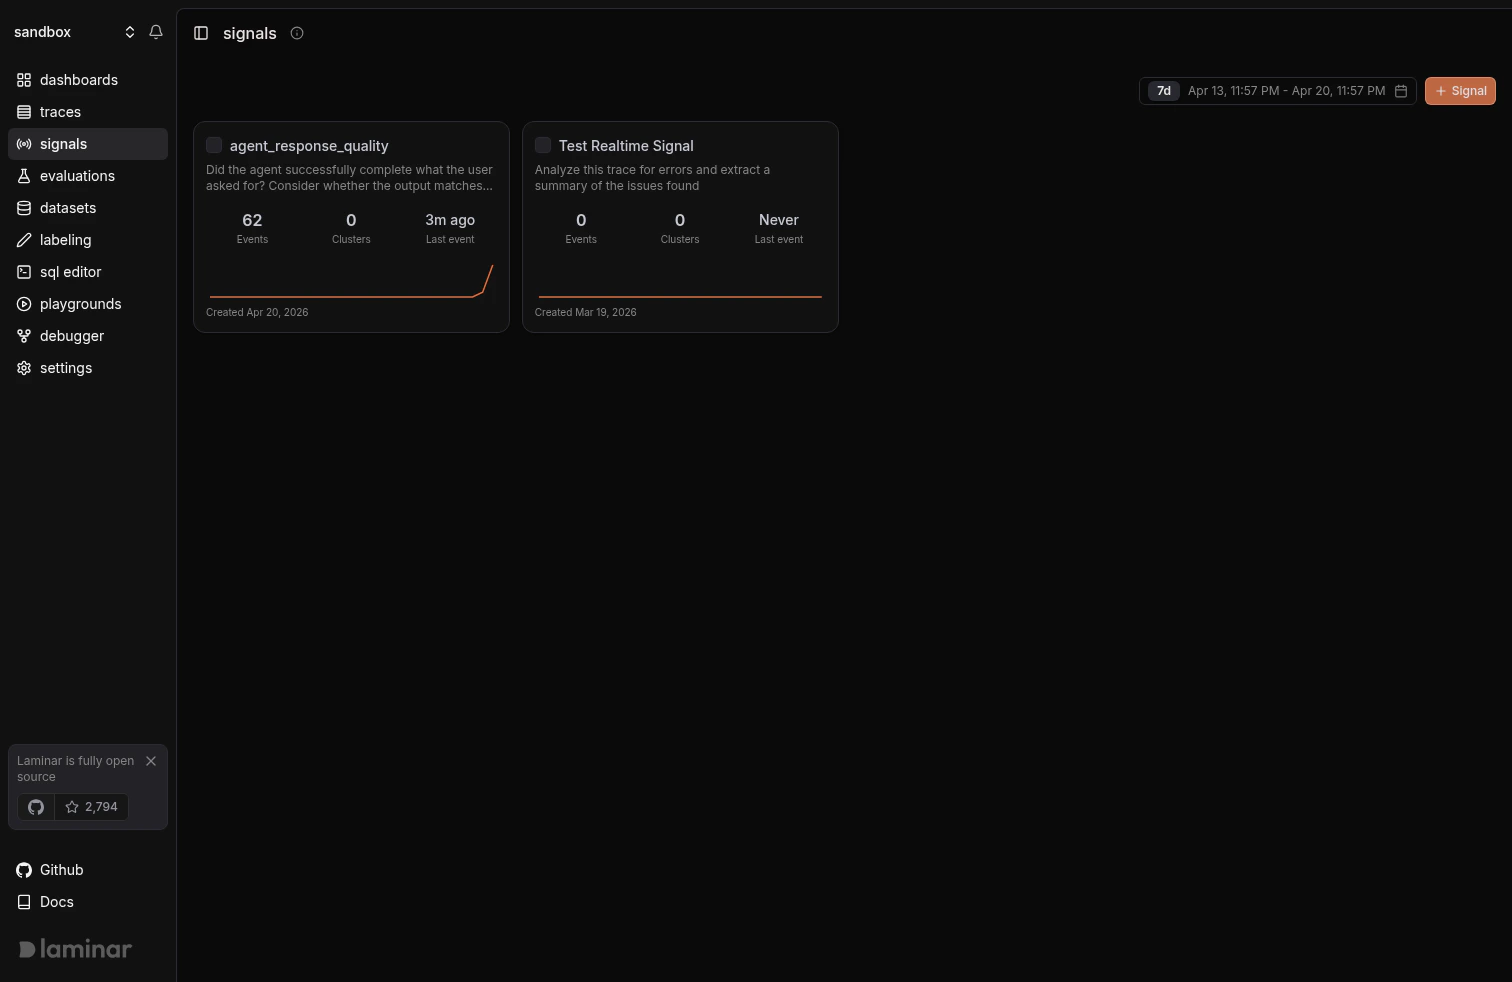 To write your own, click **Create signal**.
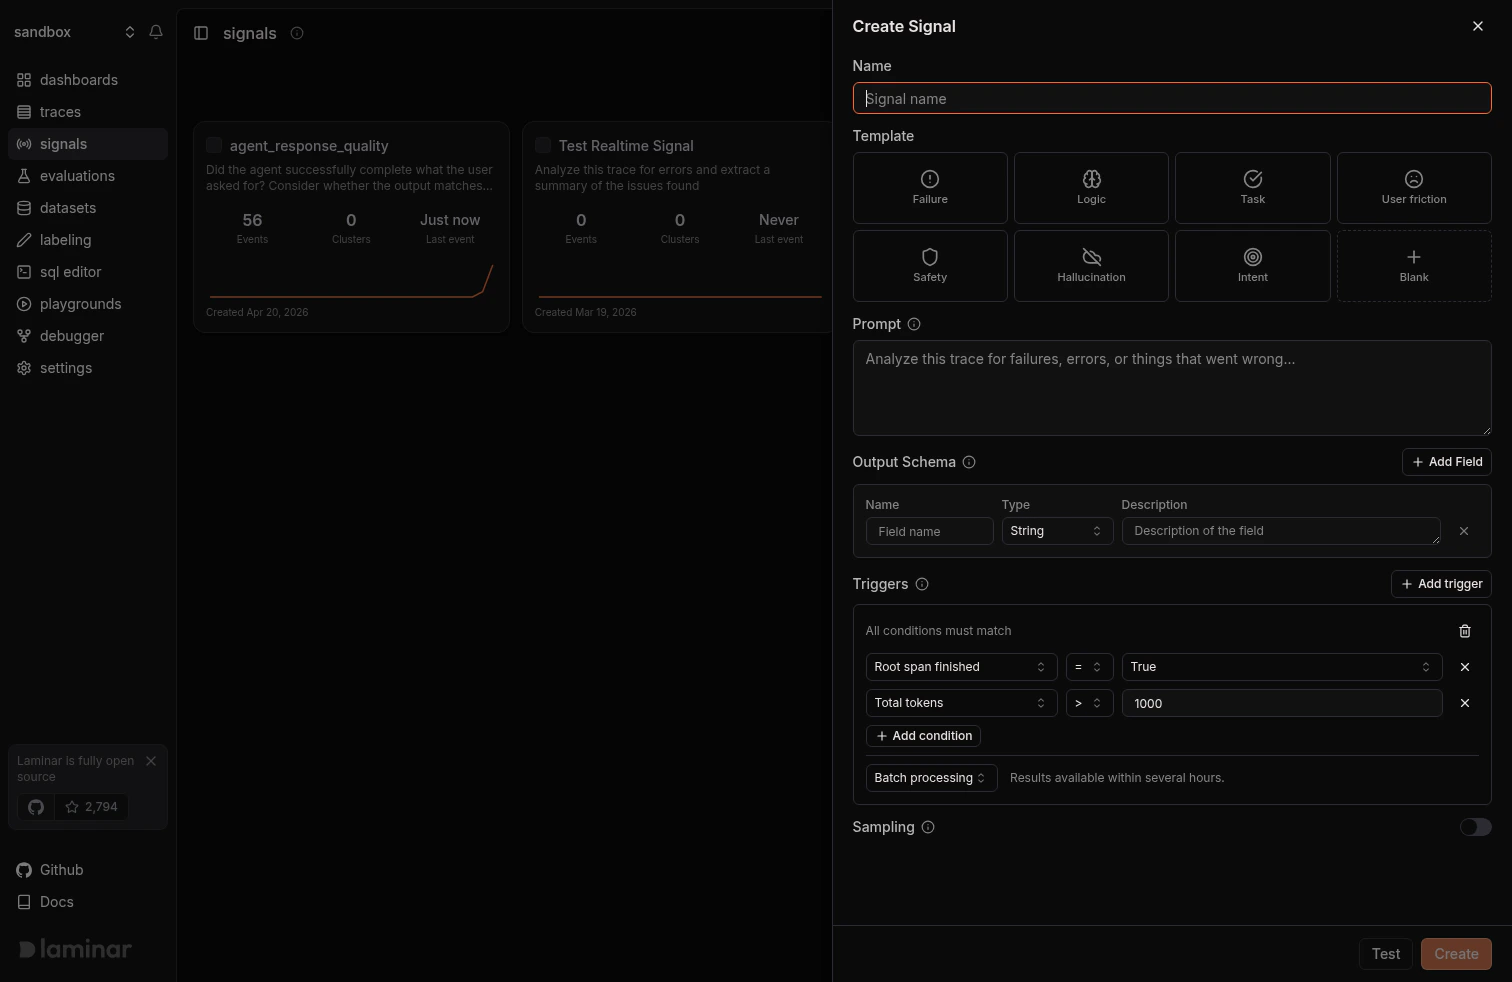 ## 3. Write the Signal
Fill in the form:
1. **Name**: a stable identifier. Use snake\_case or dot-notation (`agent_response_quality`, `checkout.completed`). The name is what you filter, alert, and query by.
2. **Template** (optional): pick a starting point. Laminar ships templates for task completion, user friction, safety, hallucination, and intent. Templates prefill the prompt and schema; edit both before saving.
3. **Prompt**: describe what the Signal should detect or extract from the trace. *Be concrete.* "The agent answered the user's question correctly and completely" is a better prompt than "good response".
4. **Structured output**: define the JSON schema for the payload. Keep fields small and stable; they become filterable columns on `signal_events`.
5. **Triggers**: toggle on to run this Signal automatically on new traces. Add filters to narrow which traces it runs against.
6. **Sampling** (optional): cap how many matching traces the trigger consumes per time window. Useful when a high-volume filter would otherwise fan out across every trace.
## 3. Write the Signal
Fill in the form:
1. **Name**: a stable identifier. Use snake\_case or dot-notation (`agent_response_quality`, `checkout.completed`). The name is what you filter, alert, and query by.
2. **Template** (optional): pick a starting point. Laminar ships templates for task completion, user friction, safety, hallucination, and intent. Templates prefill the prompt and schema; edit both before saving.
3. **Prompt**: describe what the Signal should detect or extract from the trace. *Be concrete.* "The agent answered the user's question correctly and completely" is a better prompt than "good response".
4. **Structured output**: define the JSON schema for the payload. Keep fields small and stable; they become filterable columns on `signal_events`.
5. **Triggers**: toggle on to run this Signal automatically on new traces. Add filters to narrow which traces it runs against.
6. **Sampling** (optional): cap how many matching traces the trigger consumes per time window. Useful when a high-volume filter would otherwise fan out across every trace.
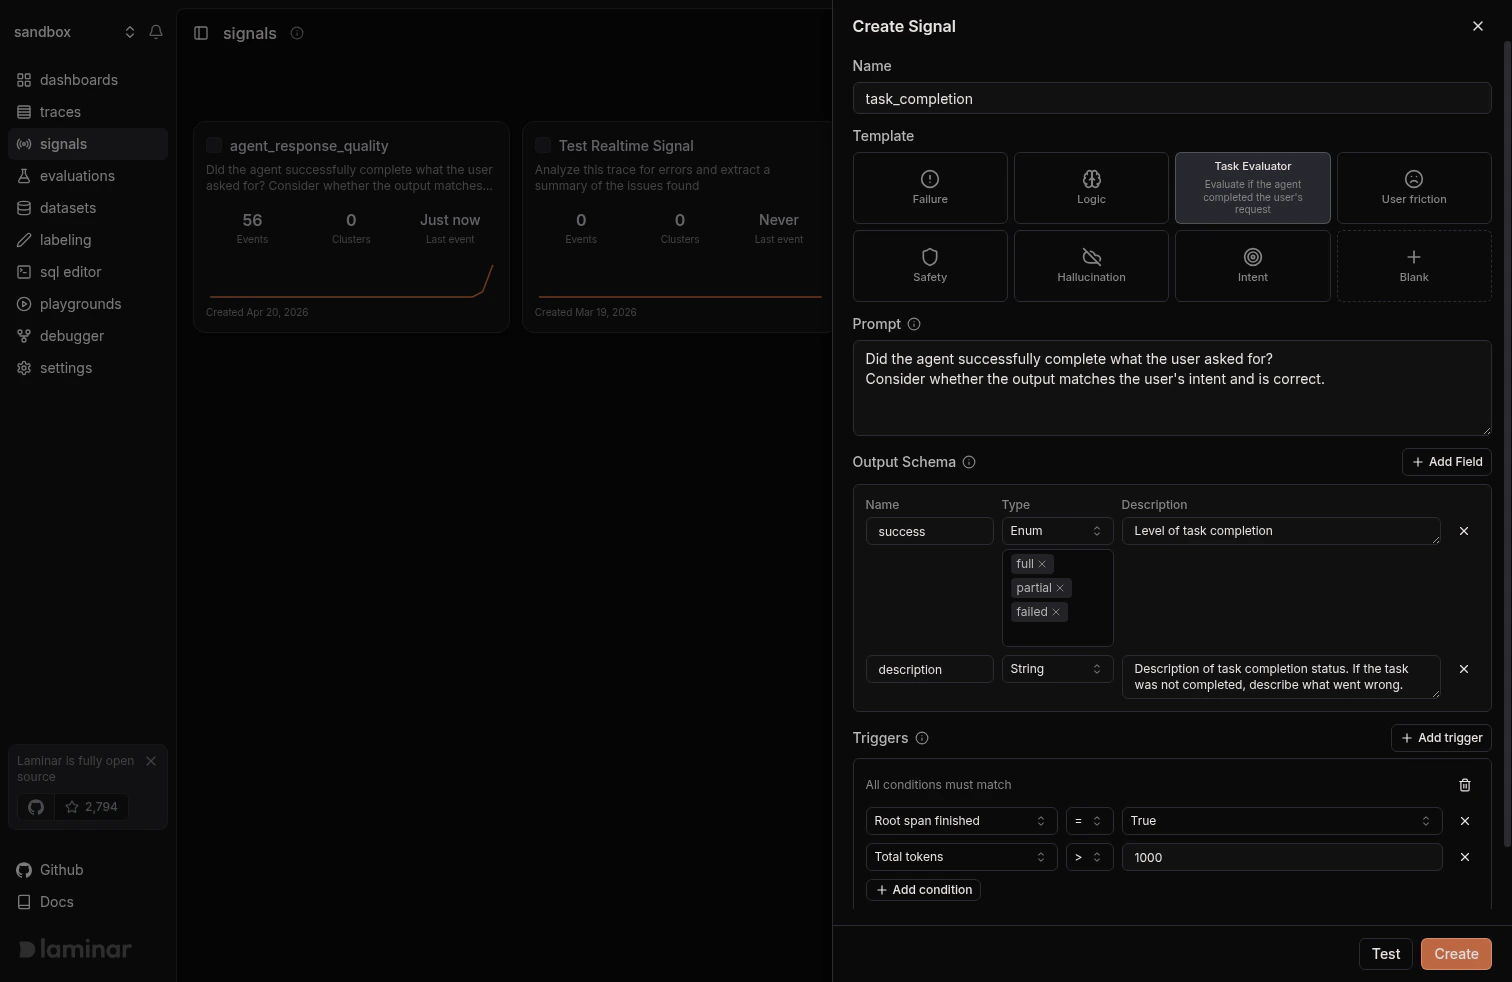 Click **Create**. The Signal is live from this point on: any configured Trigger starts processing new traces immediately.
Creating a Signal automatically creates a **Critical**-severity event alert that posts to the in-app notification center. Open the Signal's **Settings > Alerts** section (or **Project Settings > Alerts**) to route it to Slack or email, change the severity, or add output-schema filters. See [Alerts](/docs/signals/alerts).
## 4. Run the Signal: Triggers and Backfill
A Signal can run in two modes, independent of each other. Open a Signal and click **Settings** to manage both from a sidebar with four sections: **General** (definition and triggers), **Alerts**, **Backfill**, and **Activity**.
Click **Create**. The Signal is live from this point on: any configured Trigger starts processing new traces immediately.
Creating a Signal automatically creates a **Critical**-severity event alert that posts to the in-app notification center. Open the Signal's **Settings > Alerts** section (or **Project Settings > Alerts**) to route it to Slack or email, change the severity, or add output-schema filters. See [Alerts](/docs/signals/alerts).
## 4. Run the Signal: Triggers and Backfill
A Signal can run in two modes, independent of each other. Open a Signal and click **Settings** to manage both from a sidebar with four sections: **General** (definition and triggers), **Alerts**, **Backfill**, and **Activity**.
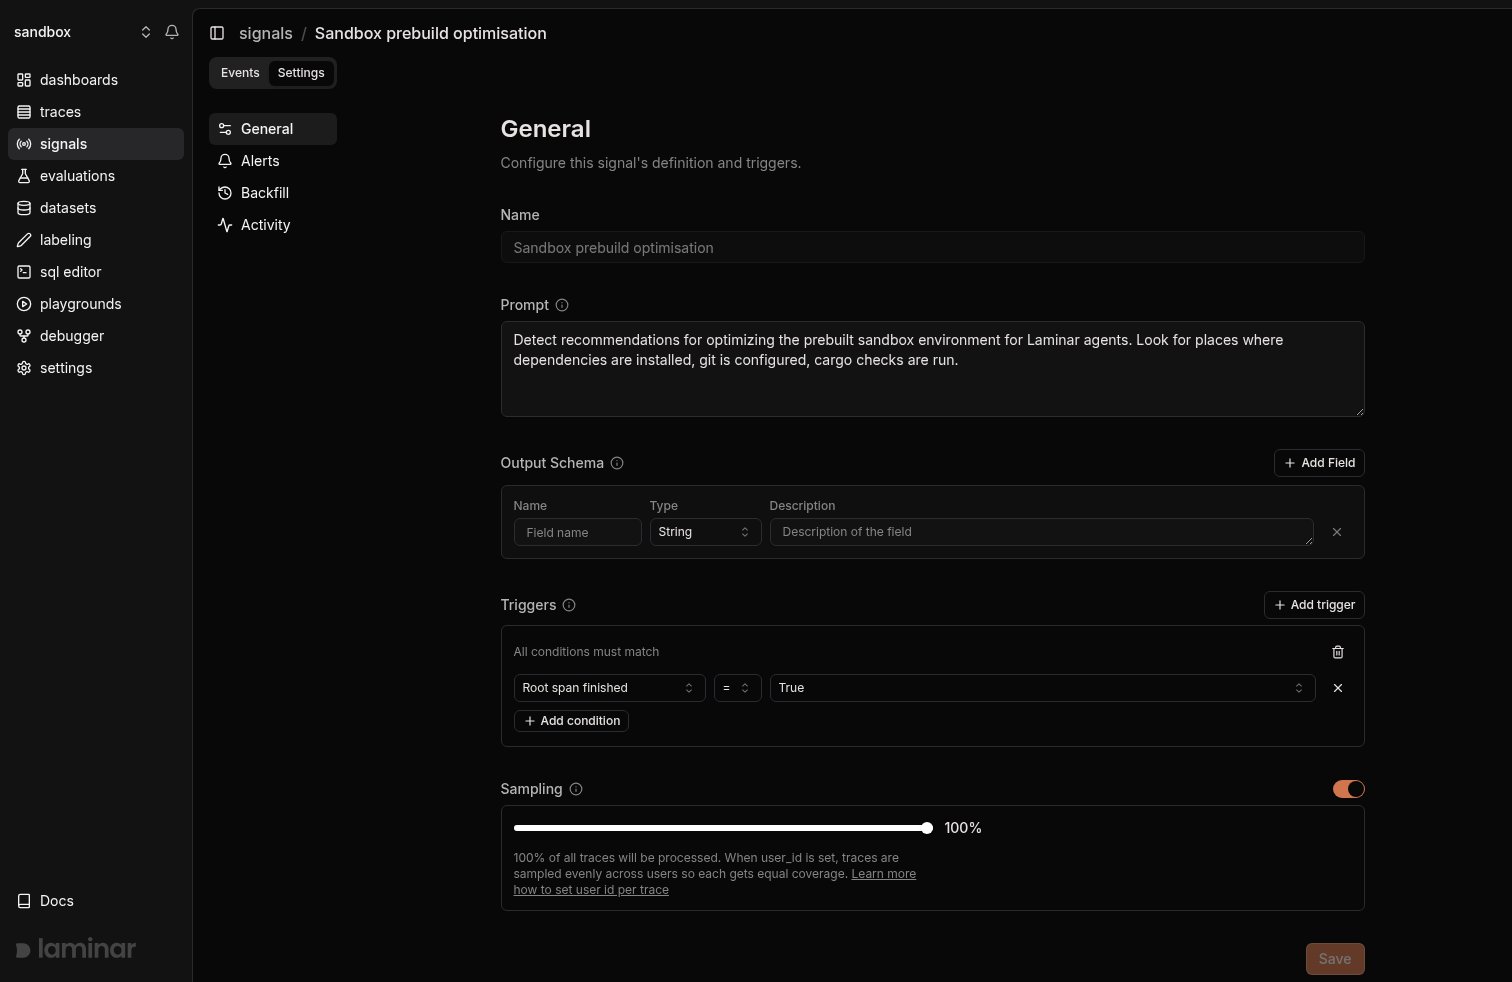 ### Triggers (live)
Triggers run the Signal automatically on new traces that match your filter set. **This is what feeds live dashboards and Alerts.**
* Open the Signal's **Settings > General** section and turn on **Triggers** (or configure Triggers while creating the Signal).
* Add one or more filters. All filters are AND-combined.
* Save. Every matching trace now produces a Run; runs that detect the Signal produce events.
### Backfill (historical)
Use **Backfill** to run a Signal across historical traces, for example to evaluate a freshly-created Signal over the last 24 hours of traffic.
### Triggers (live)
Triggers run the Signal automatically on new traces that match your filter set. **This is what feeds live dashboards and Alerts.**
* Open the Signal's **Settings > General** section and turn on **Triggers** (or configure Triggers while creating the Signal).
* Add one or more filters. All filters are AND-combined.
* Save. Every matching trace now produces a Run; runs that detect the Signal produce events.
### Backfill (historical)
Use **Backfill** to run a Signal across historical traces, for example to evaluate a freshly-created Signal over the last 24 hours of traffic.
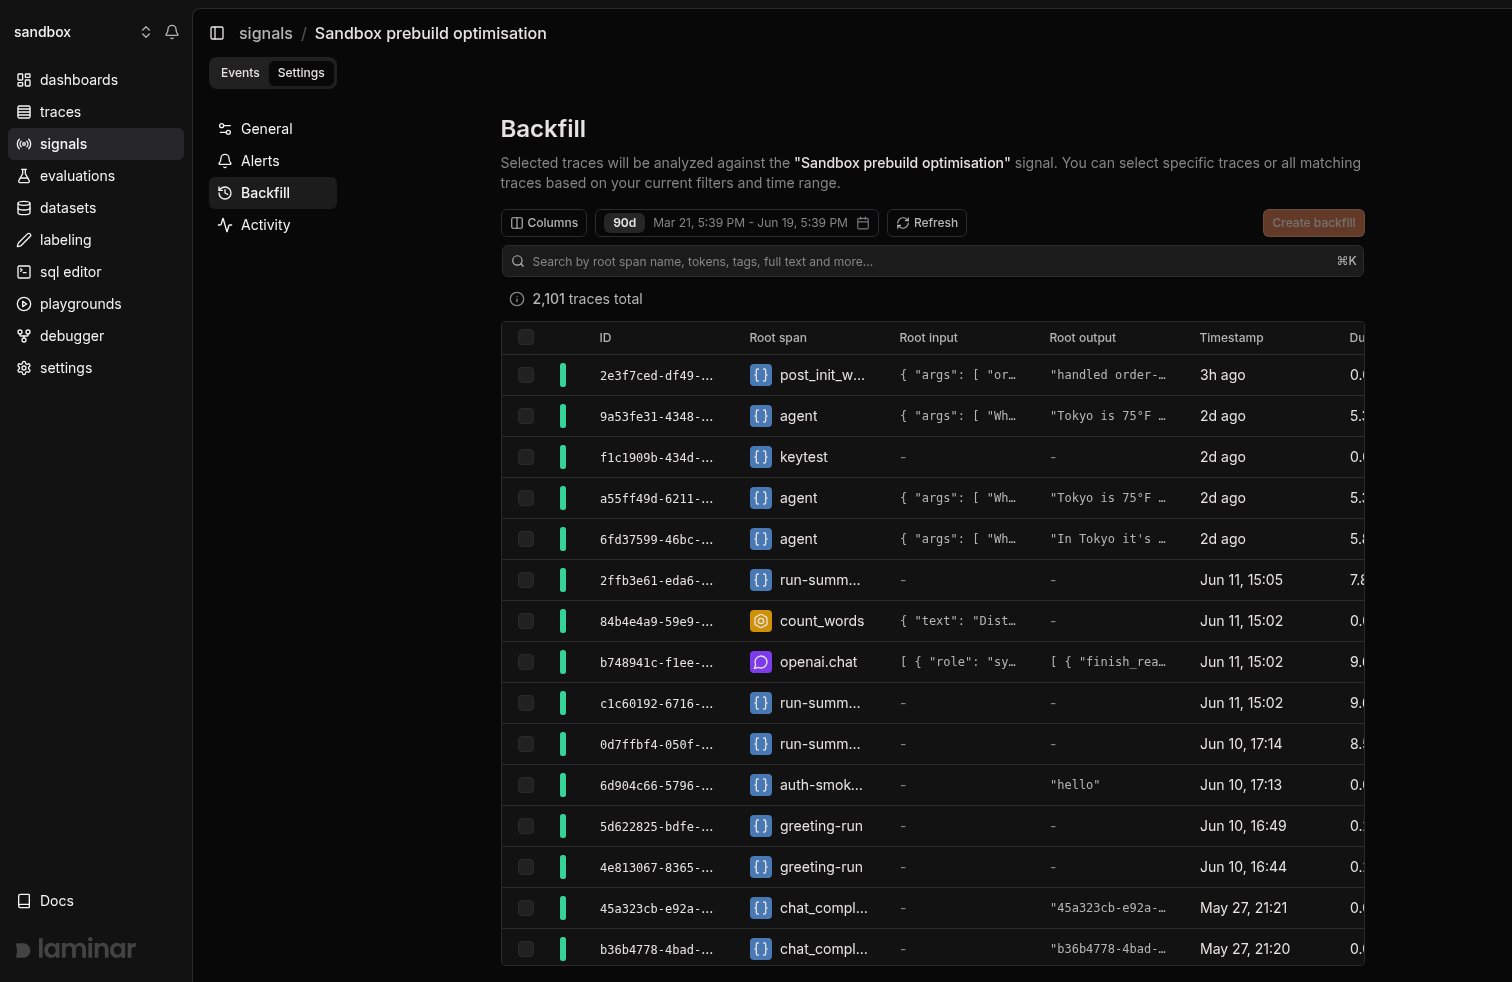 1. Open the Signal's **Settings > Backfill** section.
2. Pick a **time range** (defaults to the last 24 hours).
3. Optionally narrow with **filters** or **search**.
4. Choose **specific traces** or **all traces matching your filters**.
5. Click **Start backfill**. Laminar enqueues one Run per trace.
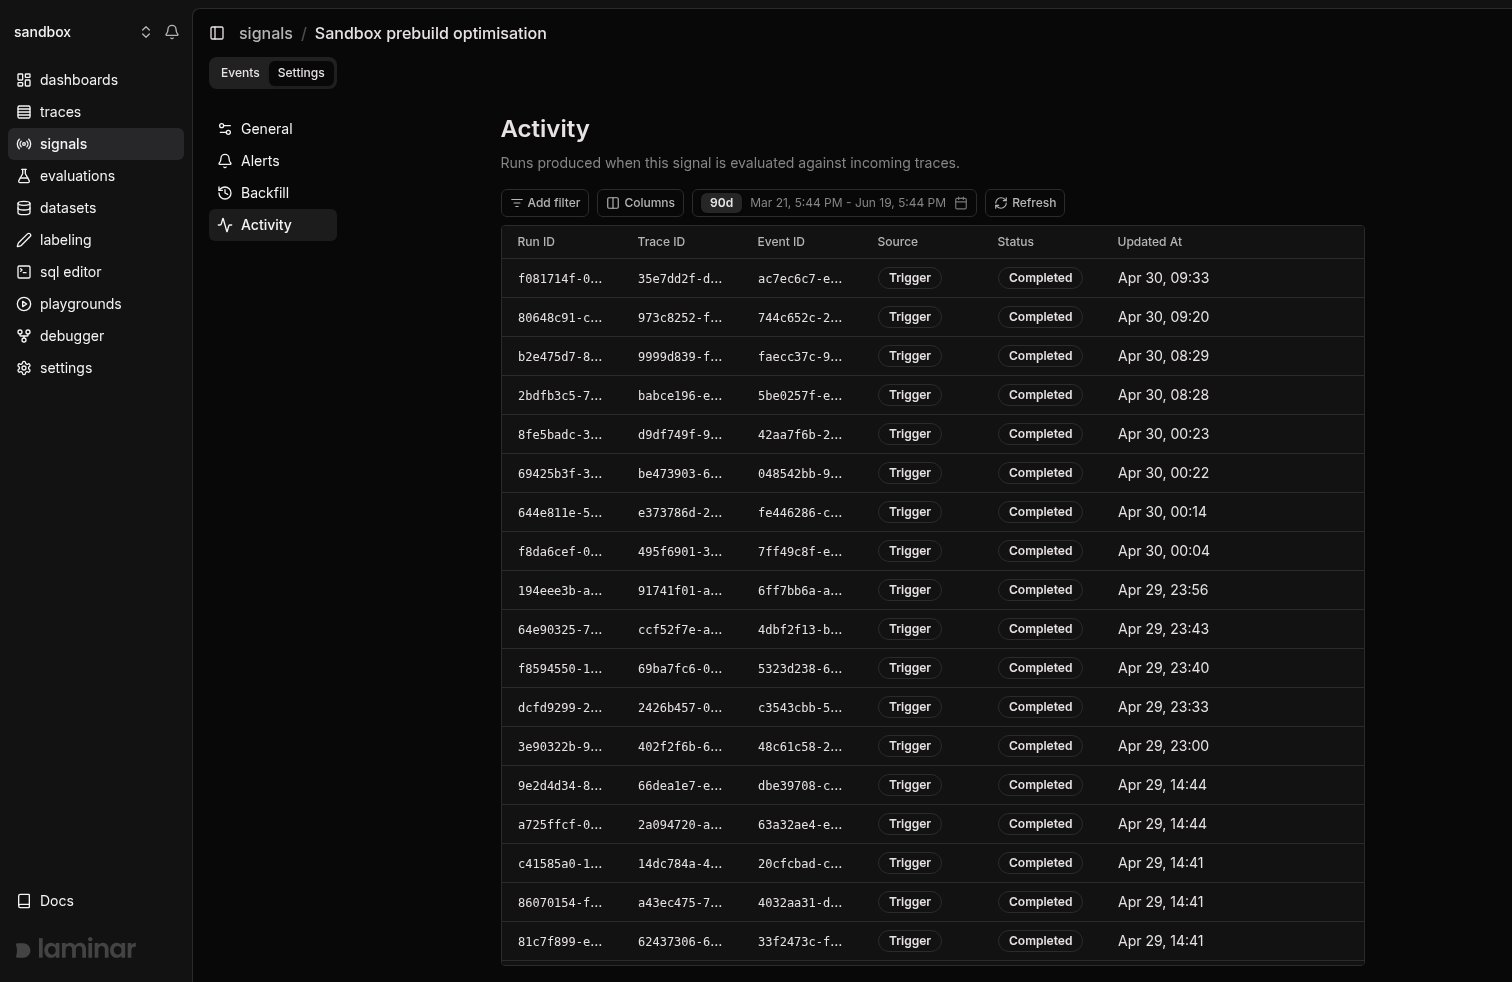
Runs appear in the **Activity** section with a status (Pending, Completed, Failed). Each Run that detects the Signal links to the resulting event in the **Events** tab.
1. Open the Signal's **Settings > Backfill** section.
2. Pick a **time range** (defaults to the last 24 hours).
3. Optionally narrow with **filters** or **search**.
4. Choose **specific traces** or **all traces matching your filters**.
5. Click **Start backfill**. Laminar enqueues one Run per trace.
Runs appear in the **Activity** section with a status (Pending, Completed, Failed). Each Run that detects the Signal links to the resulting event in the **Events** tab.
 ### Pause and resume a Signal
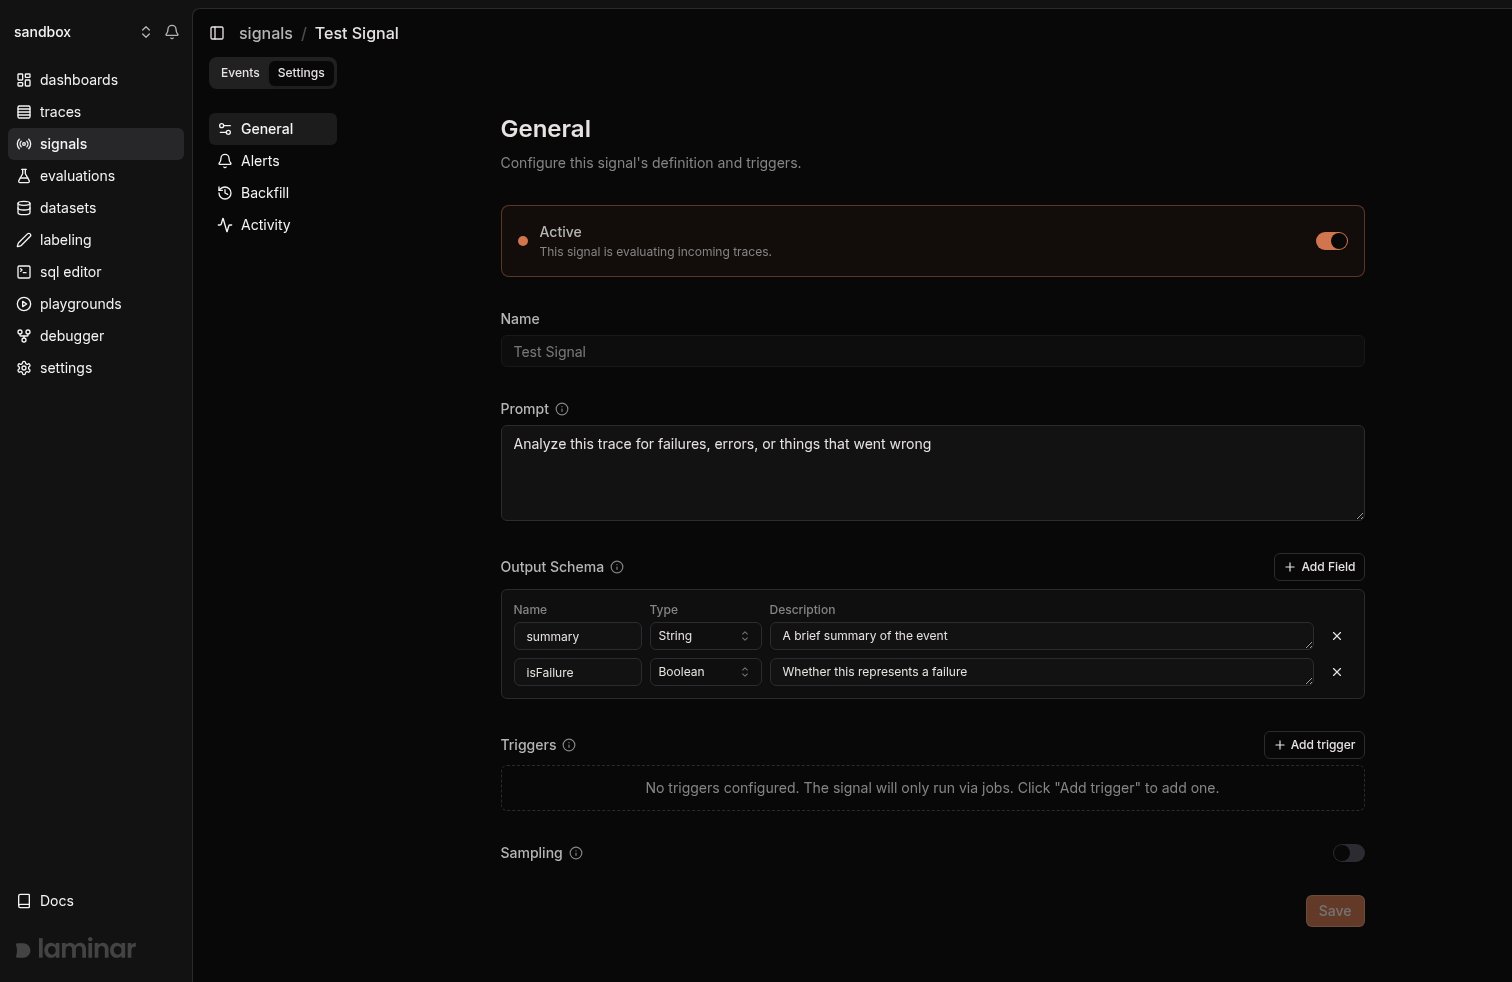
A Signal you're not ready to delete can be paused. Open the Signal's **Settings > General** section and flip the **Active** switch off.
### Pause and resume a Signal
A Signal you're not ready to delete can be paused. Open the Signal's **Settings > General** section and flip the **Active** switch off.
 While a Signal is paused:
* New traces are not evaluated, even if they match the Signal's triggers.
* Backfills are rejected until the Signal is re-enabled.
* Existing events and clusters are kept, and stay queryable in SQL and the UI.
* Alerts on the Signal stay configured but have nothing to fire on.
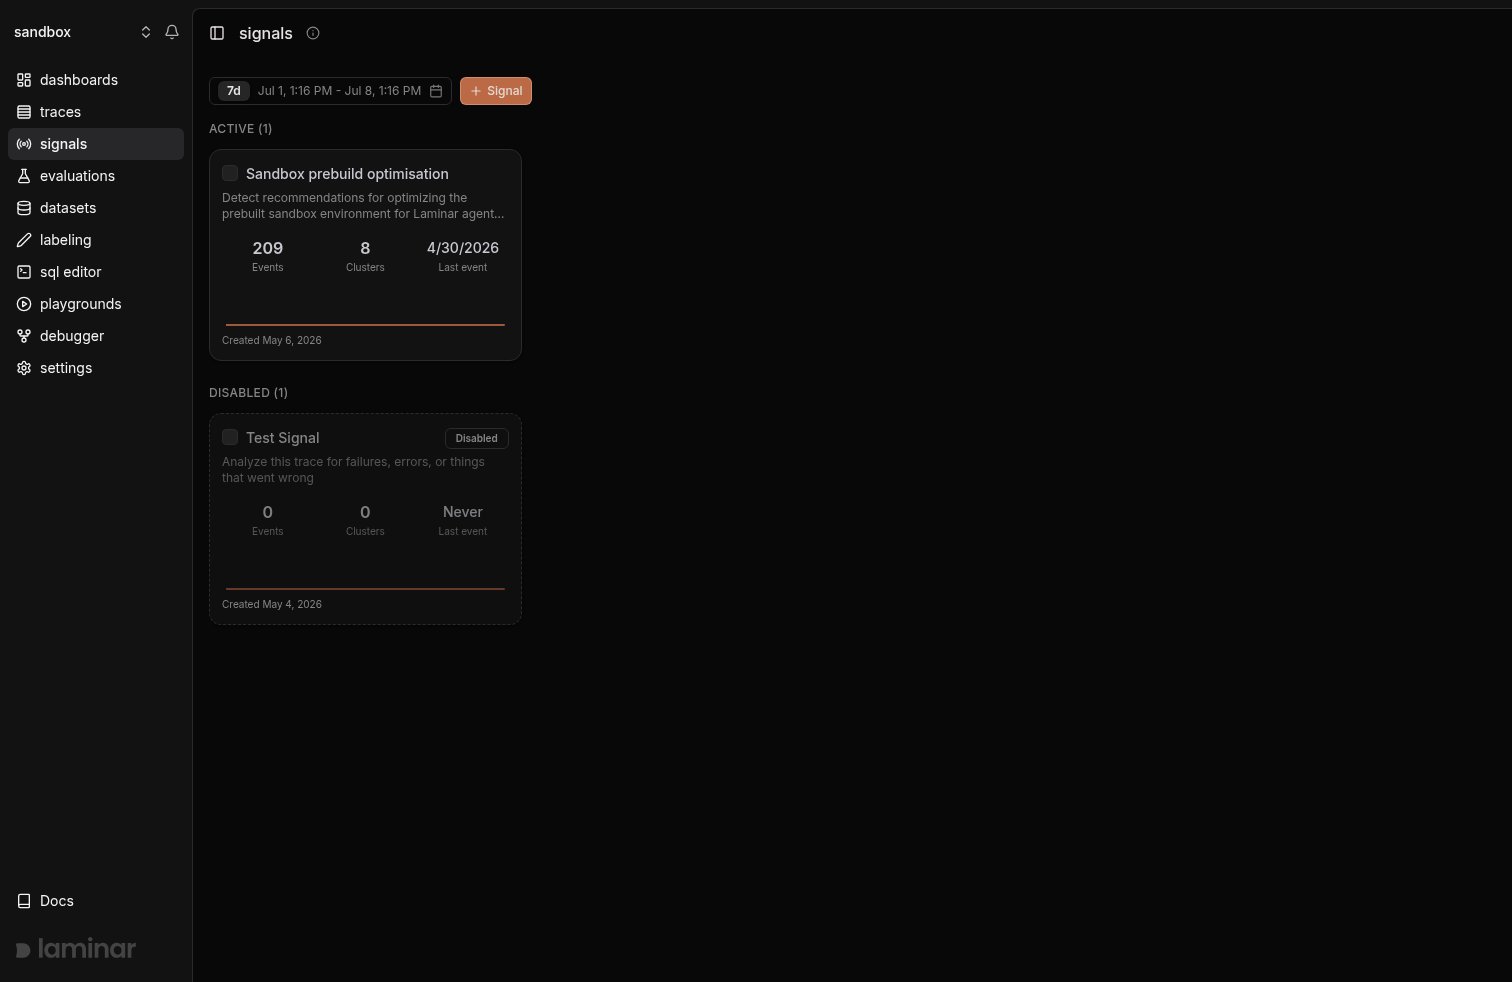
Paused Signals show a **Disabled** badge on the Signals list and are grouped separately from active ones. Flip the switch back on and the Signal resumes evaluating new traces immediately.
While a Signal is paused:
* New traces are not evaluated, even if they match the Signal's triggers.
* Backfills are rejected until the Signal is re-enabled.
* Existing events and clusters are kept, and stay queryable in SQL and the UI.
* Alerts on the Signal stay configured but have nothing to fire on.
Paused Signals show a **Disabled** badge on the Signals list and are grouped separately from active ones. Flip the switch back on and the Signal resumes evaluating new traces immediately.
 You can also pause a single [alert](/docs/signals/alerts#enable-or-disable-an-alert) instead of the whole Signal, to keep collecting events while silencing notifications.
## 5. Inspect events
Open the Signal detail page and switch to the **Events** tab. Each row is one detected event, linked back to the trace that produced it.
You can also pause a single [alert](/docs/signals/alerts#enable-or-disable-an-alert) instead of the whole Signal, to keep collecting events while silencing notifications.
## 5. Inspect events
Open the Signal detail page and switch to the **Events** tab. Each row is one detected event, linked back to the trace that produced it.
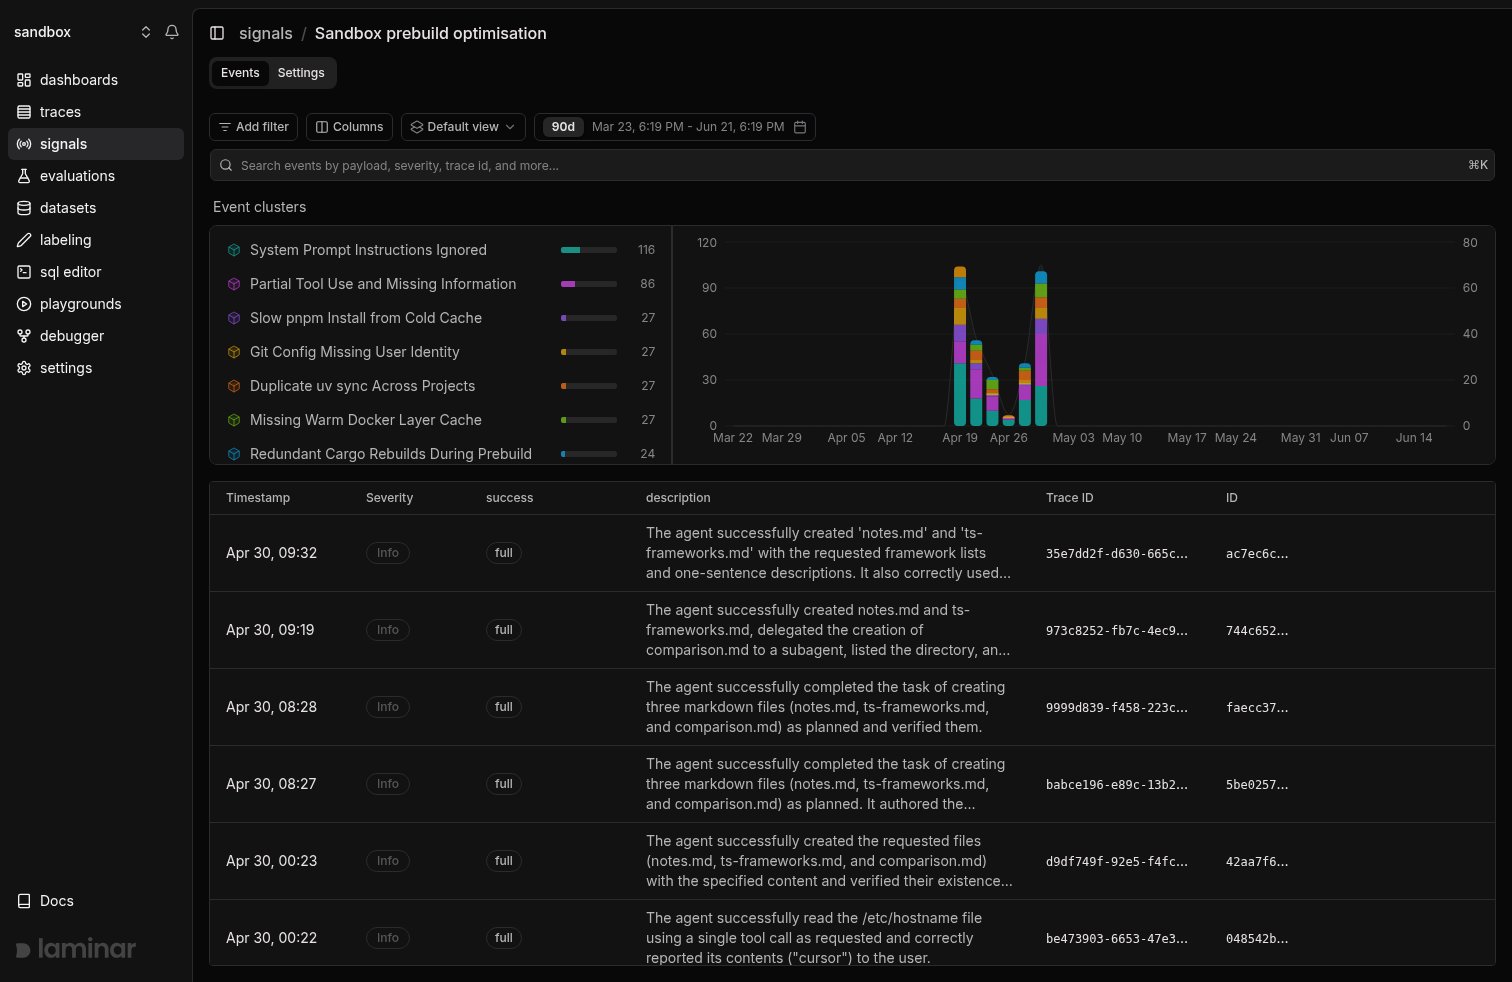 From here you can:
* Filter events by any field you defined in the structured output schema.
* Click any row to open the corresponding trace.
* Scroll to the clusters view below the events table to see similar events grouped together. See [Clusters](/docs/signals/clusters).
* Query the raw events in the [SQL Editor](/docs/platform/sql-editor) via the `signal_events` table.
## Querying `signal_events` in SQL
`signal_events` stores each event's payload as a JSON string. The UI's payload filter uses `simpleJSONExtractString` / `simpleJSONExtractRaw`, so you can mirror the same behavior in SQL.
### Quick payload filter (UI-equivalent)
```sql theme={null}
SELECT
timestamp,
trace_id,
name,
payload
FROM signal_events
WHERE name = 'checkout.completed'
AND (
simpleJSONExtractString(payload, 'error_type') = 'timeout'
OR simpleJSONExtractRaw(payload, 'error_type') = 'timeout'
)
AND timestamp > now() - INTERVAL 7 DAY
ORDER BY timestamp DESC
LIMIT 200
```
### Numeric comparisons with JSONExtractFloat
```sql theme={null}
SELECT
timestamp,
trace_id,
JSONExtractFloat(payload, 'score') AS score,
JSONExtractFloat(payload, 'latency_ms') AS latency_ms
FROM signal_events
WHERE name = 'agent_response_quality'
AND JSONExtractFloat(payload, 'score') >= 0.9
AND timestamp > now() - INTERVAL 30 DAY
ORDER BY score DESC
```
### Typed or nested fields with JSONExtract
```sql theme={null}
SELECT
timestamp,
trace_id,
JSONExtract(payload, 'summary', 'String') AS summary,
JSONExtract(payload, 'metrics', 'confidence', 'Float64') AS confidence,
JSONExtract(payload, 'labels', 'Array(String)') AS labels
FROM signal_events
WHERE name = 'support.intent_classification'
AND timestamp > now() - INTERVAL 14 DAY
ORDER BY timestamp DESC
LIMIT 100
```
## Next steps
Group similar events into recurring patterns.
Send Slack or email notifications on new signal events.
From here you can:
* Filter events by any field you defined in the structured output schema.
* Click any row to open the corresponding trace.
* Scroll to the clusters view below the events table to see similar events grouped together. See [Clusters](/docs/signals/clusters).
* Query the raw events in the [SQL Editor](/docs/platform/sql-editor) via the `signal_events` table.
## Querying `signal_events` in SQL
`signal_events` stores each event's payload as a JSON string. The UI's payload filter uses `simpleJSONExtractString` / `simpleJSONExtractRaw`, so you can mirror the same behavior in SQL.
### Quick payload filter (UI-equivalent)
```sql theme={null}
SELECT
timestamp,
trace_id,
name,
payload
FROM signal_events
WHERE name = 'checkout.completed'
AND (
simpleJSONExtractString(payload, 'error_type') = 'timeout'
OR simpleJSONExtractRaw(payload, 'error_type') = 'timeout'
)
AND timestamp > now() - INTERVAL 7 DAY
ORDER BY timestamp DESC
LIMIT 200
```
### Numeric comparisons with JSONExtractFloat
```sql theme={null}
SELECT
timestamp,
trace_id,
JSONExtractFloat(payload, 'score') AS score,
JSONExtractFloat(payload, 'latency_ms') AS latency_ms
FROM signal_events
WHERE name = 'agent_response_quality'
AND JSONExtractFloat(payload, 'score') >= 0.9
AND timestamp > now() - INTERVAL 30 DAY
ORDER BY score DESC
```
### Typed or nested fields with JSONExtract
```sql theme={null}
SELECT
timestamp,
trace_id,
JSONExtract(payload, 'summary', 'String') AS summary,
JSONExtract(payload, 'metrics', 'confidence', 'Float64') AS confidence,
JSONExtract(payload, 'labels', 'Array(String)') AS labels
FROM signal_events
WHERE name = 'support.intent_classification'
AND timestamp > now() - INTERVAL 14 DAY
ORDER BY timestamp DESC
LIMIT 100
```
## Next steps
Group similar events into recurring patterns.
Send Slack or email notifications on new signal events.