> ## Documentation Index
> Fetch the complete documentation index at: https://laminar.sh/docs/llms.txt
> Use this file to discover all available pages before exploring further.
# Observability for OpenCode coding agents
## Overview
[OpenCode](https://opencode.ai/) is an open-source AI coding agent. Its [`@opencode-ai/sdk`](https://opencode.ai/docs/sdk/) package lets you call OpenCode programmatically — spin up a server, drive a session, and build products on top of the agent instead of using the TUI. Laminar makes those runs observable.
What Laminar captures:
* Every conversation turn, one trace per turn.
* LLM prompts, responses, token counts, latency, and cost.
* Tool calls (`bash`, `read`, `write`, `edit`, custom tools) with arguments and results.
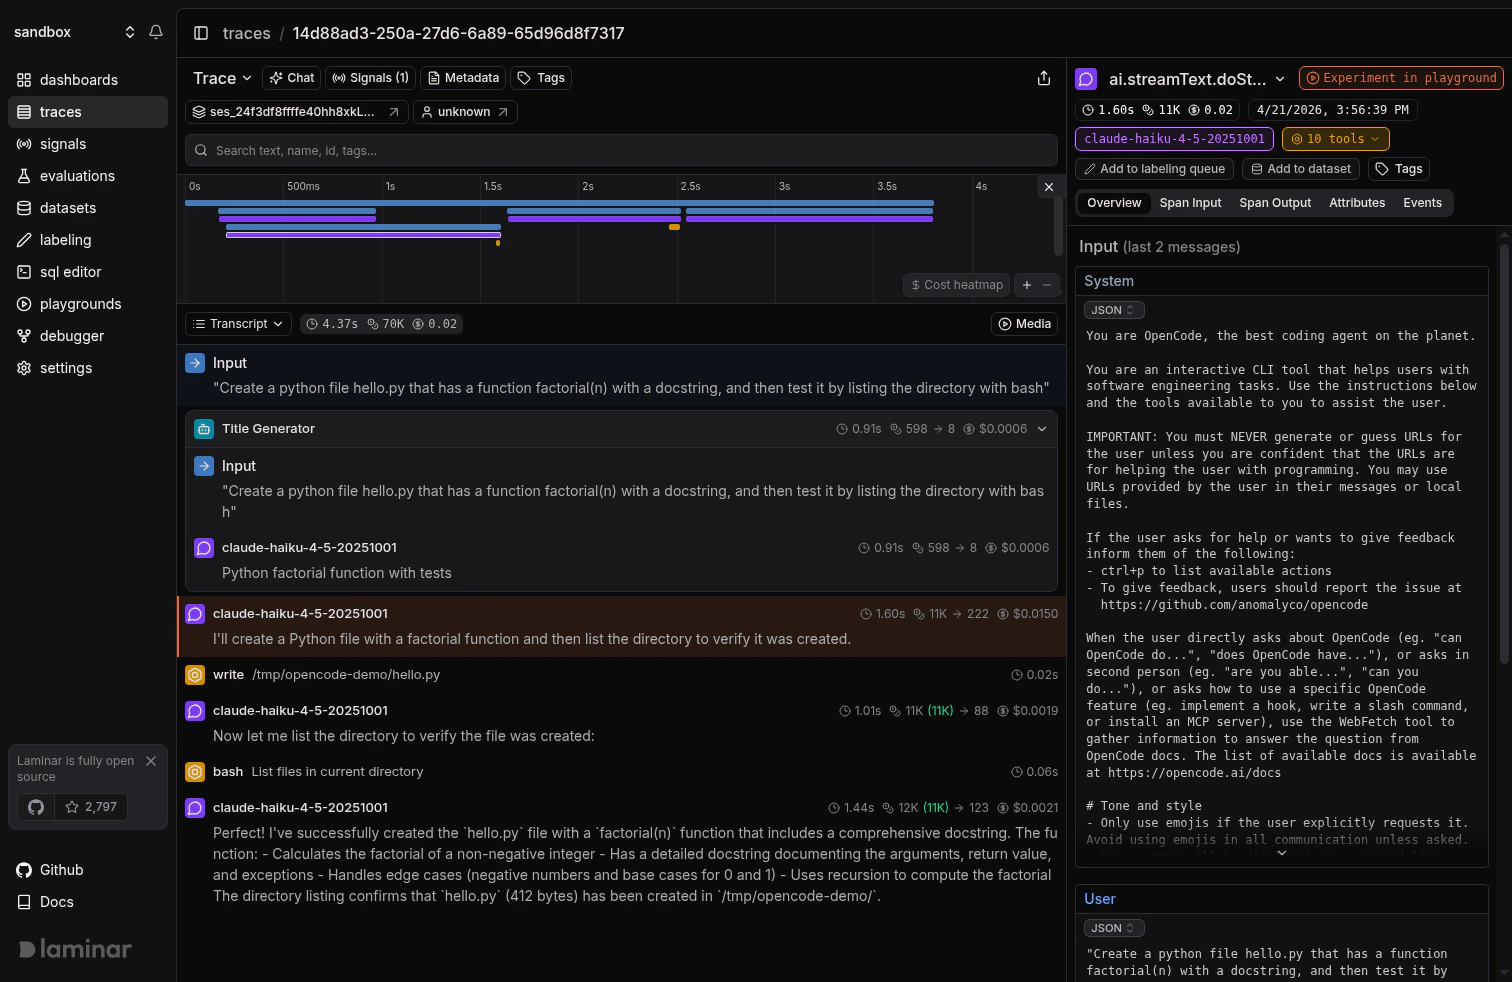
* Sub-agents (the Title Generator, task runners) as nested spans.
* When you wrap `client.session.prompt` in `observe`, the server-side turn nests under your caller span, so the entire call stack lands in a single trace.
Each trace carries the OpenCode session ID as its Laminar session ID, so every turn in the same OpenCode conversation shows up under one session in Laminar.
## Calling OpenCode from TypeScript
Laminar ships two pieces that cooperate:
* **`@lmnr-ai/lmnr`** patches `@opencode-ai/sdk` on the caller side. When you wrap a `client.session.prompt` call in `observe`, the instrumentation injects the current span context into the request.
* **`@lmnr-ai/opencode-plugin`** runs inside the OpenCode server, picks up that context, and emits the turn, LLM, and tool-call spans as children of your caller span.
The result: one trace per turn that spans from your `observe` block into the server's `turn` span and all the way down to each LLM call.
```bash theme={null}
npm install @lmnr-ai/lmnr@latest @opencode-ai/sdk@latest
```
The caller-side instrumentation only injects context; the server-side plugin is what actually emits the turn and tool spans. Create (or edit) `opencode.json` next to your code:
```json opencode.json theme={null}
{
"$schema": "https://opencode.ai/config.json",
"plugin": ["@lmnr-ai/opencode-plugin"]
}
```
The JSON key is `plugin`, not `plugins`. OpenCode will reject the file otherwise.
OpenCode reads config from [multiple locations](https://opencode.ai/docs/config/#locations). The closest one wins: a file in the current project overrides `~/.config/opencode/opencode.json`. If you want tracing on by default everywhere, put the plugin block in the global file. See [OpenCode's plugin docs](https://opencode.ai/docs/config/#plugins) for the full layering rules.
The plugin reads `LMNR_PROJECT_API_KEY` from the environment of whatever process starts the OpenCode server. When you use `opencode.createOpencode()`, that's the same process that runs your TypeScript code, so exporting it in your shell is enough:
```bash theme={null}
export LMNR_PROJECT_API_KEY=your-laminar-project-api-key
```
To get the project API key, go to the Laminar dashboard, click the project settings,
and generate a project API key. This is available both in the cloud and in the self-hosted version of Laminar.
Specify the key at `Laminar` initialization. If not specified,
Laminar will look for the key in the `LMNR_PROJECT_API_KEY` environment variable.
Self-hosting Laminar? Also set `LMNR_BASE_URL` and `LMNR_GRPC_PORT` to point at your instance. For the OSS default, that's `http://localhost` and `8001`.
```typescript {1,2,5-9,16} theme={null}
import * as opencode from "@opencode-ai/sdk";
import { Laminar, observe } from "@lmnr-ai/lmnr";
// Initialize Laminar once at the entry point.
Laminar.initialize({
instrumentModules: {
opencode,
},
});
const { client, server } = await opencode.createOpencode();
try {
const sessionRes = await client.session.create({ body: { title: "agent run" } });
await observe({ name: "my-agent-step" }, async () => {
await client.session.prompt({
path: { id: sessionRes.data.id },
body: {
model: { providerID: "anthropic", modelID: "claude-haiku-4-5" },
parts: [{ type: "text", text: "Create a Python factorial function and test it." }],
},
});
});
} finally {
server.close();
await Laminar.shutdown();
}
```
If you import `@opencode-ai/sdk` before `Laminar.initialize()` (common when the project has `"type": "module"` in `package.json`), your local reference won't be auto-wrapped. Pass the module via `instrumentModules` as shown above; the instrumentation attaches to the SDK's `Session` class and every new `OpencodeClient` picks it up.
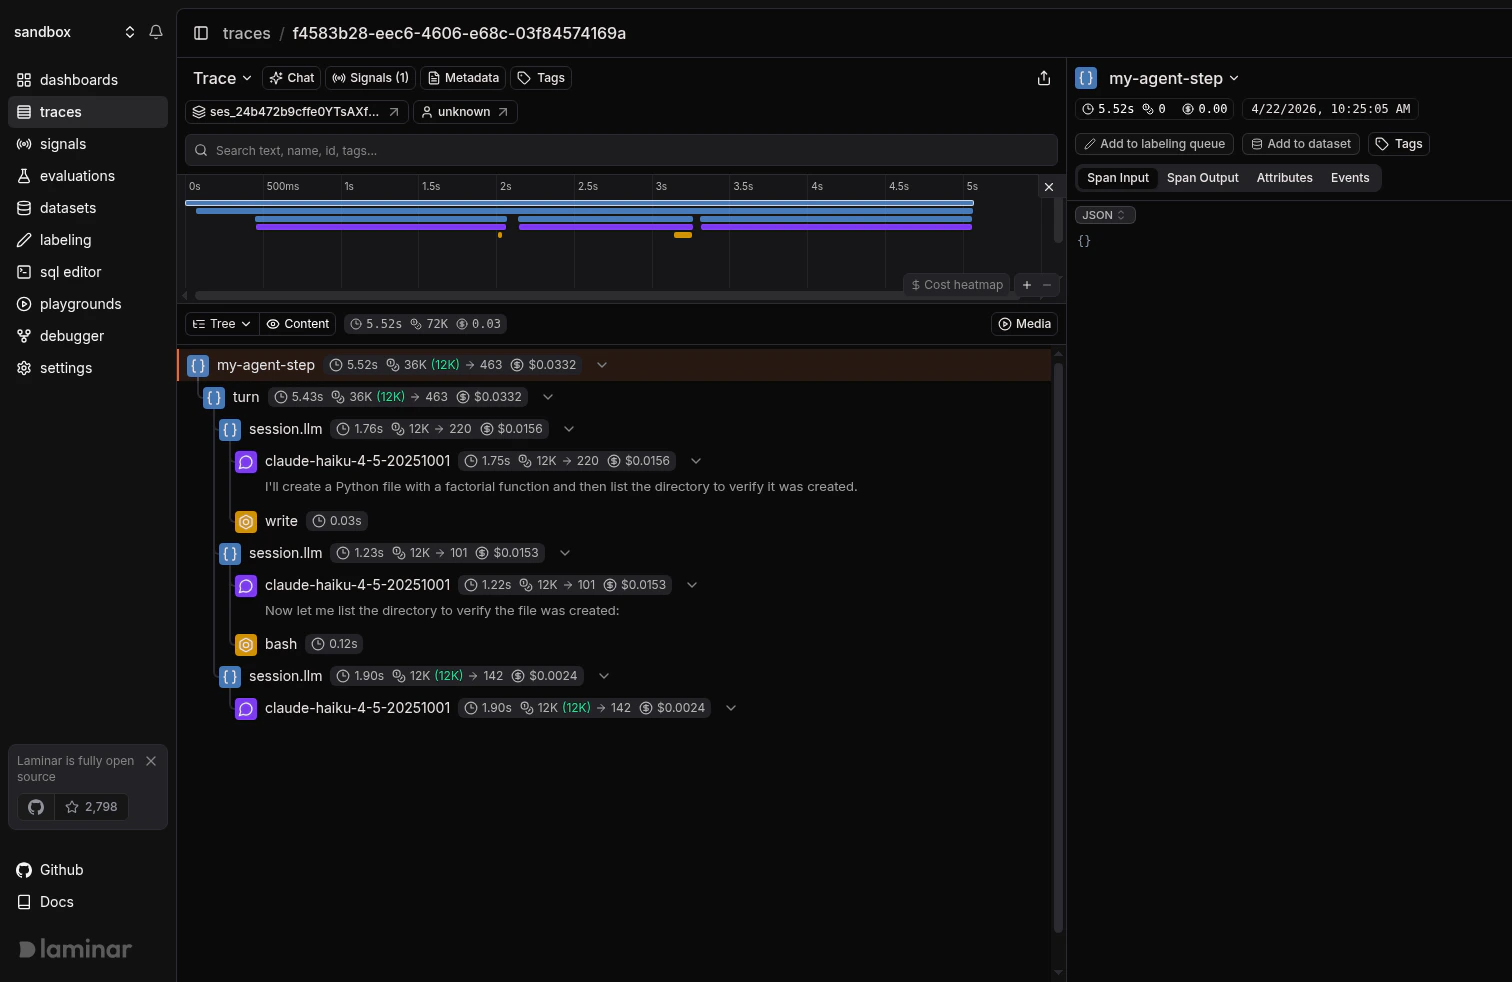
## Trace structure
Because the caller-side instrumentation hands the span context to the server-side plugin, the trace comes back as a single tree: your `observe` span is the root, the server's `turn` span is its child, and every `session.llm`, model call, and tool call hangs off `turn`. There is no separate trace for the server — everything the OpenCode process does on this turn shows up nested under the TypeScript code that kicked it off.
The tree view makes that nesting obvious:
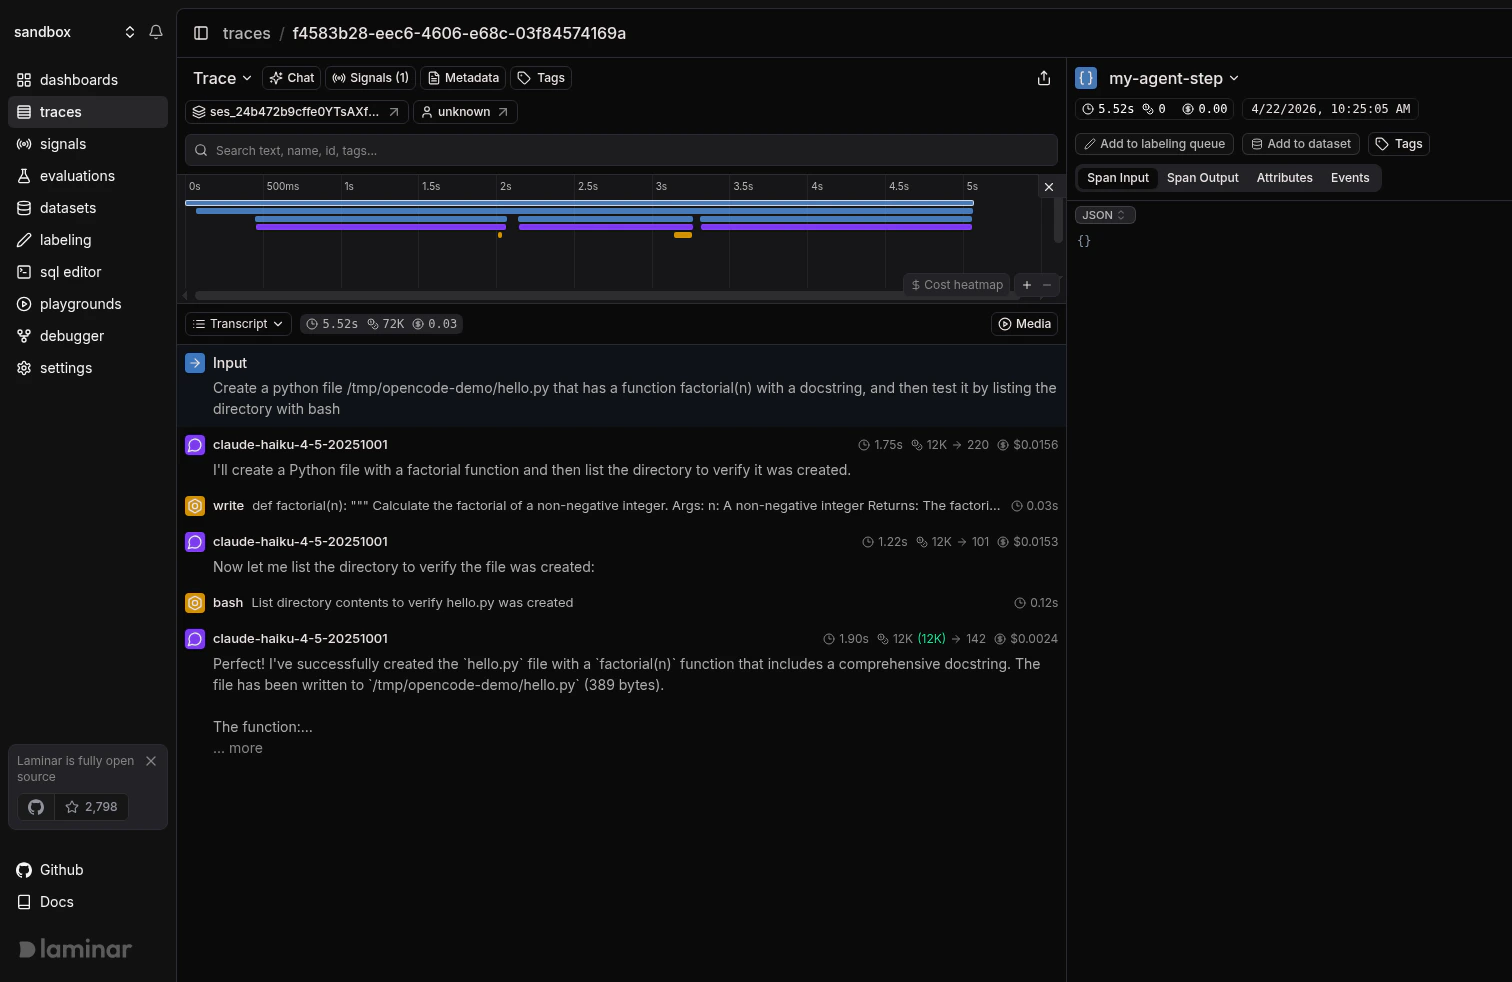
 Switch to transcript view on the same trace to read the conversation — user prompt, model output, tool calls, and tool results read as a dialogue instead of a span tree. More on the trace UX: [Viewing traces](/docs/platform/viewing-traces).
 ## Using the OpenCode CLI
The plugin works the same way on a standalone `opencode` CLI run: add it to `opencode.json`, export `LMNR_PROJECT_API_KEY`, and every conversation turn gets traced. There's no TypeScript caller to be the parent span, so each turn becomes its own top-level trace.
Follow [OpenCode's install guide](https://opencode.ai/docs/#install). You do not need to install the plugin package yourself; OpenCode resolves it from npm on first run.
Use the same `opencode.json` plugin entry as the SDK section above, and export `LMNR_PROJECT_API_KEY` in the shell you launch `opencode` from. You can also put the key in a `.env` file in the project directory; OpenCode loads it automatically.
```bash theme={null}
opencode
```
The first run downloads the plugin. On startup you'll see a log line like `Laminar tracing initialized → https://api.lmnr.ai`. The plugin also flips OpenCode's experimental OpenTelemetry flag on for you, so you don't need to touch the OTel config.
## Using the OpenCode CLI
The plugin works the same way on a standalone `opencode` CLI run: add it to `opencode.json`, export `LMNR_PROJECT_API_KEY`, and every conversation turn gets traced. There's no TypeScript caller to be the parent span, so each turn becomes its own top-level trace.
Follow [OpenCode's install guide](https://opencode.ai/docs/#install). You do not need to install the plugin package yourself; OpenCode resolves it from npm on first run.
Use the same `opencode.json` plugin entry as the SDK section above, and export `LMNR_PROJECT_API_KEY` in the shell you launch `opencode` from. You can also put the key in a `.env` file in the project directory; OpenCode loads it automatically.
```bash theme={null}
opencode
```
The first run downloads the plugin. On startup you'll see a log line like `Laminar tracing initialized → https://api.lmnr.ai`. The plugin also flips OpenCode's experimental OpenTelemetry flag on for you, so you don't need to touch the OTel config.
 ## Track outcomes with Signals
Traces answer *what happened on this turn*. **[Signals](/docs/signals/introduction) answer the cross-trace question**: *how often does the agent edit a file it wasn't asked to, when does the bash tool run a destructive command, which turns burn tokens without touching a file*. A Signal pairs a plain-language prompt with a JSON output schema. Laminar runs it live on new traces (Triggers) or backfills it across history (Jobs) and records a structured event every time it matches. From there you [query](/docs/platform/sql-editor), [cluster](/docs/signals/clusters), and [alert](/docs/signals/alerts) on events across every trace.
Every new project ships with a **Failure Detector** Signal that categorizes issues on any trace over 1000 tokens. Open it from the Signals sidebar to see events as soon as your OpenCode traces arrive.
## Query across traces
* **[SQL editor](/docs/platform/sql-editor)** for ad-hoc queries across traces, spans, signals, and evals.
* **SQL API** for programmatic access from scripts and pipelines.
* **[CLI](/docs/platform/cli)** (`lmnr-cli sql query`) for terminal-driven queries and piping JSON into shell tools or coding agents.
* **[MCP server](/docs/platform/mcp)** to query Laminar directly from OpenCode, Claude Code, Cursor, or Codex.
## Troubleshooting
* `LMNR_PROJECT_API_KEY` must be set in the environment of the process that launches the OpenCode server, not just in the process that creates the OpenCode client. The plugin runs on the server side and reads the key there.
* Check the OpenCode startup log for `Laminar tracing initialized → ...`. If you see `LMNR_PROJECT_API_KEY not set, skipping plugin initialization`, the plugin loaded but had no key.
* Confirm `opencode.json` uses the key `"plugin"` (singular). `"plugins"` silently does nothing.
* Make sure both sides are on a current `@lmnr-ai/lmnr` (install with `@latest`). The caller-side instrumentation and the plugin's context extraction need to match up.
* The server process also needs the plugin in `opencode.json`. Without it, the caller-side span lands in Laminar but the server spans land in their own trace.
* Wrap the `client.session.prompt` call in `observe` (or another active span). The SDK instrumentation only injects the context if there is one.
Export `LMNR_BASE_URL` and `LMNR_GRPC_PORT` in the same environment as `LMNR_PROJECT_API_KEY`. For a local OSS instance, that's `LMNR_BASE_URL=http://localhost` and `LMNR_GRPC_PORT=8001`. The plugin passes these through when it initializes Laminar.
## What's next
Read the transcript view, filter, and search across traces.
Detect behaviors and failures across every OpenCode turn, then query, cluster, and alert on them.
Query traces programmatically from the UI, API, or your IDE.
Sessions, metadata, and tags for deeper control.
Running OpenCode alongside Claude Agent SDK? Trace both here.
## Track outcomes with Signals
Traces answer *what happened on this turn*. **[Signals](/docs/signals/introduction) answer the cross-trace question**: *how often does the agent edit a file it wasn't asked to, when does the bash tool run a destructive command, which turns burn tokens without touching a file*. A Signal pairs a plain-language prompt with a JSON output schema. Laminar runs it live on new traces (Triggers) or backfills it across history (Jobs) and records a structured event every time it matches. From there you [query](/docs/platform/sql-editor), [cluster](/docs/signals/clusters), and [alert](/docs/signals/alerts) on events across every trace.
Every new project ships with a **Failure Detector** Signal that categorizes issues on any trace over 1000 tokens. Open it from the Signals sidebar to see events as soon as your OpenCode traces arrive.
## Query across traces
* **[SQL editor](/docs/platform/sql-editor)** for ad-hoc queries across traces, spans, signals, and evals.
* **SQL API** for programmatic access from scripts and pipelines.
* **[CLI](/docs/platform/cli)** (`lmnr-cli sql query`) for terminal-driven queries and piping JSON into shell tools or coding agents.
* **[MCP server](/docs/platform/mcp)** to query Laminar directly from OpenCode, Claude Code, Cursor, or Codex.
## Troubleshooting
* `LMNR_PROJECT_API_KEY` must be set in the environment of the process that launches the OpenCode server, not just in the process that creates the OpenCode client. The plugin runs on the server side and reads the key there.
* Check the OpenCode startup log for `Laminar tracing initialized → ...`. If you see `LMNR_PROJECT_API_KEY not set, skipping plugin initialization`, the plugin loaded but had no key.
* Confirm `opencode.json` uses the key `"plugin"` (singular). `"plugins"` silently does nothing.
* Make sure both sides are on a current `@lmnr-ai/lmnr` (install with `@latest`). The caller-side instrumentation and the plugin's context extraction need to match up.
* The server process also needs the plugin in `opencode.json`. Without it, the caller-side span lands in Laminar but the server spans land in their own trace.
* Wrap the `client.session.prompt` call in `observe` (or another active span). The SDK instrumentation only injects the context if there is one.
Export `LMNR_BASE_URL` and `LMNR_GRPC_PORT` in the same environment as `LMNR_PROJECT_API_KEY`. For a local OSS instance, that's `LMNR_BASE_URL=http://localhost` and `LMNR_GRPC_PORT=8001`. The plugin passes these through when it initializes Laminar.
## What's next
Read the transcript view, filter, and search across traces.
Detect behaviors and failures across every OpenCode turn, then query, cluster, and alert on them.
Query traces programmatically from the UI, API, or your IDE.
Sessions, metadata, and tags for deeper control.
Running OpenCode alongside Claude Agent SDK? Trace both here.