We obsess over agent performance not because any single run matters that much, but because inefficiencies compound: a wasted second becomes wasted hours, and redundant tokens become real cost at scale. So we look everywhere.
This is a breakdown of one investigation: a research paper analysis agent built on kernl, examined through Laminar's traces and Ask AI.
Kernl
If you have not used kernl yet, it is a lightweight TypeScript framework for building agents with threads, memory, and tools baked in, and the basic setup is only a handful of lines:
import { Agent } from "kernl";

const agent = new Agent({
  instructions: "Summarize the paper and flag relevance to kernl.",
});
Feed it a paper when you need it and build up from there with tools, memory, and parallel sub-agents.
The setup
The agent has two stages: a harvester filters arXiv papers relevant to kernl's roadmap, and analyst sub-agents process each paper in parallel, extracting summaries, key techniques, novelty assessments, and actionable recommendations.
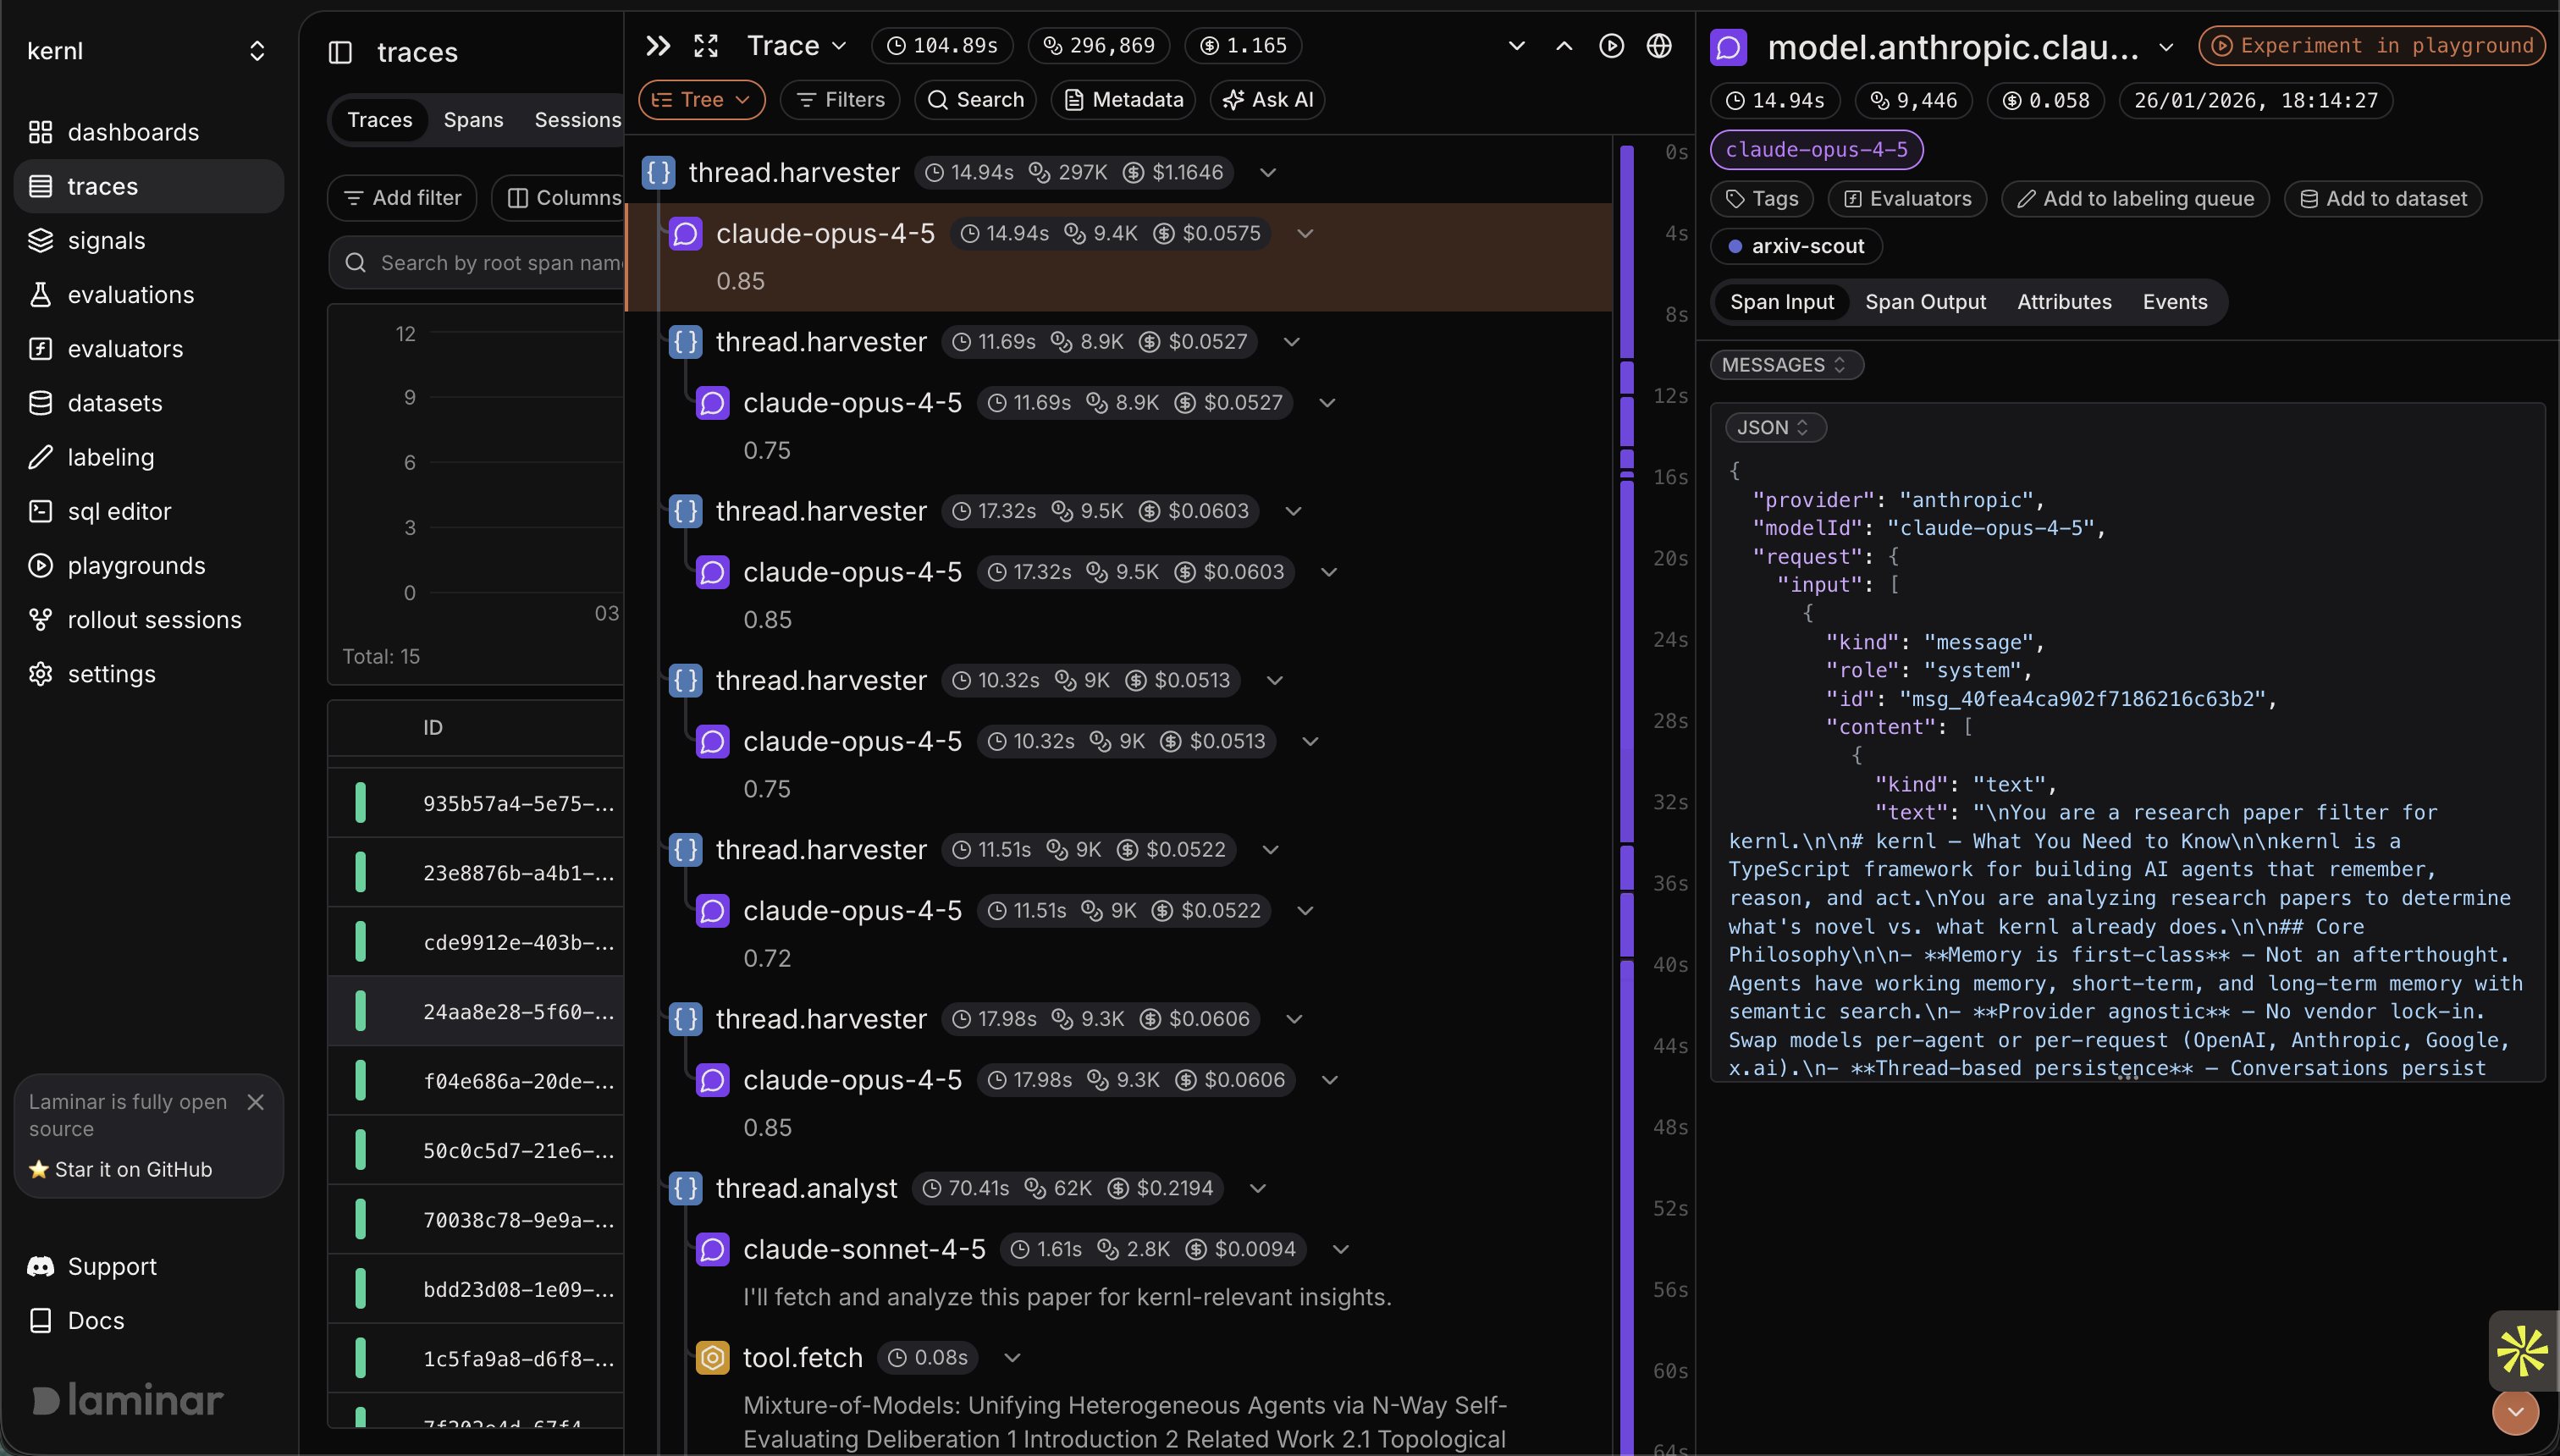
First run: 104.89 seconds, 296,869 tokens, $1.165.
Let's dig a bit deeper to find out where the time and tokens are going.
Ask AI analysis
A good place to start is Laminar's Ask AI feature, which can analyze traces for inefficiencies automatically.
I selected the trace and asked for a breakdown.
The response identified multiple inefficiencies, but let's select the most impactful one: Each analyst fetches kernl docs separately, so for N papers you get N x (number of doc pages) redundant network requests even though the documents are identical across runs.
Examining the trace
Now we can examine the trace more closely. The harvester looked clean, papers filtered correctly, analyst agents spawned as expected, and the span structure showed proper separation of concerns.
Then I expanded the analyst spans and watched the fetch calls.
As expected, each analyst was hitting the same URLs:
- https://docs.kernl.sh/core/agents
- https://docs.kernl.sh/core/memory
- https://docs.kernl.sh/core/threads
Same documentation, fetched by every analyst for every paper.
This is static content that doesn't change between papers, so each analyst fetching it independently makes no sense.
The fix
Two changes: prefetch all kernl documentation once before any analysts run, store it, and pass it to each analyst as context; then rewrite the analyst prompt to reference provided docs instead of fetching them.
// Before: analysts fetch on demand
const analyst = new Agent({
  instructions: `
    Analyze the paper for relevance to kernl.
    If it touches on a specific feature, fetch the relevant doc.
  `,
});

// After: docs injected, no fetch logic needed
const kernlDocs = await prefetchKernlDocs();

const analyst = new Agent({
  instructions: `
    Analyze the paper for relevance to kernl.
    Reference the documentation provided below.

    <kernl_documentation>
    ${kernlDocs}
    </kernl_documentation>
  `,
});
This eliminates:
- All redundant fetch calls
- All "should I fetch?" LLM reasoning steps
- The latency of sequential network requests
Second run
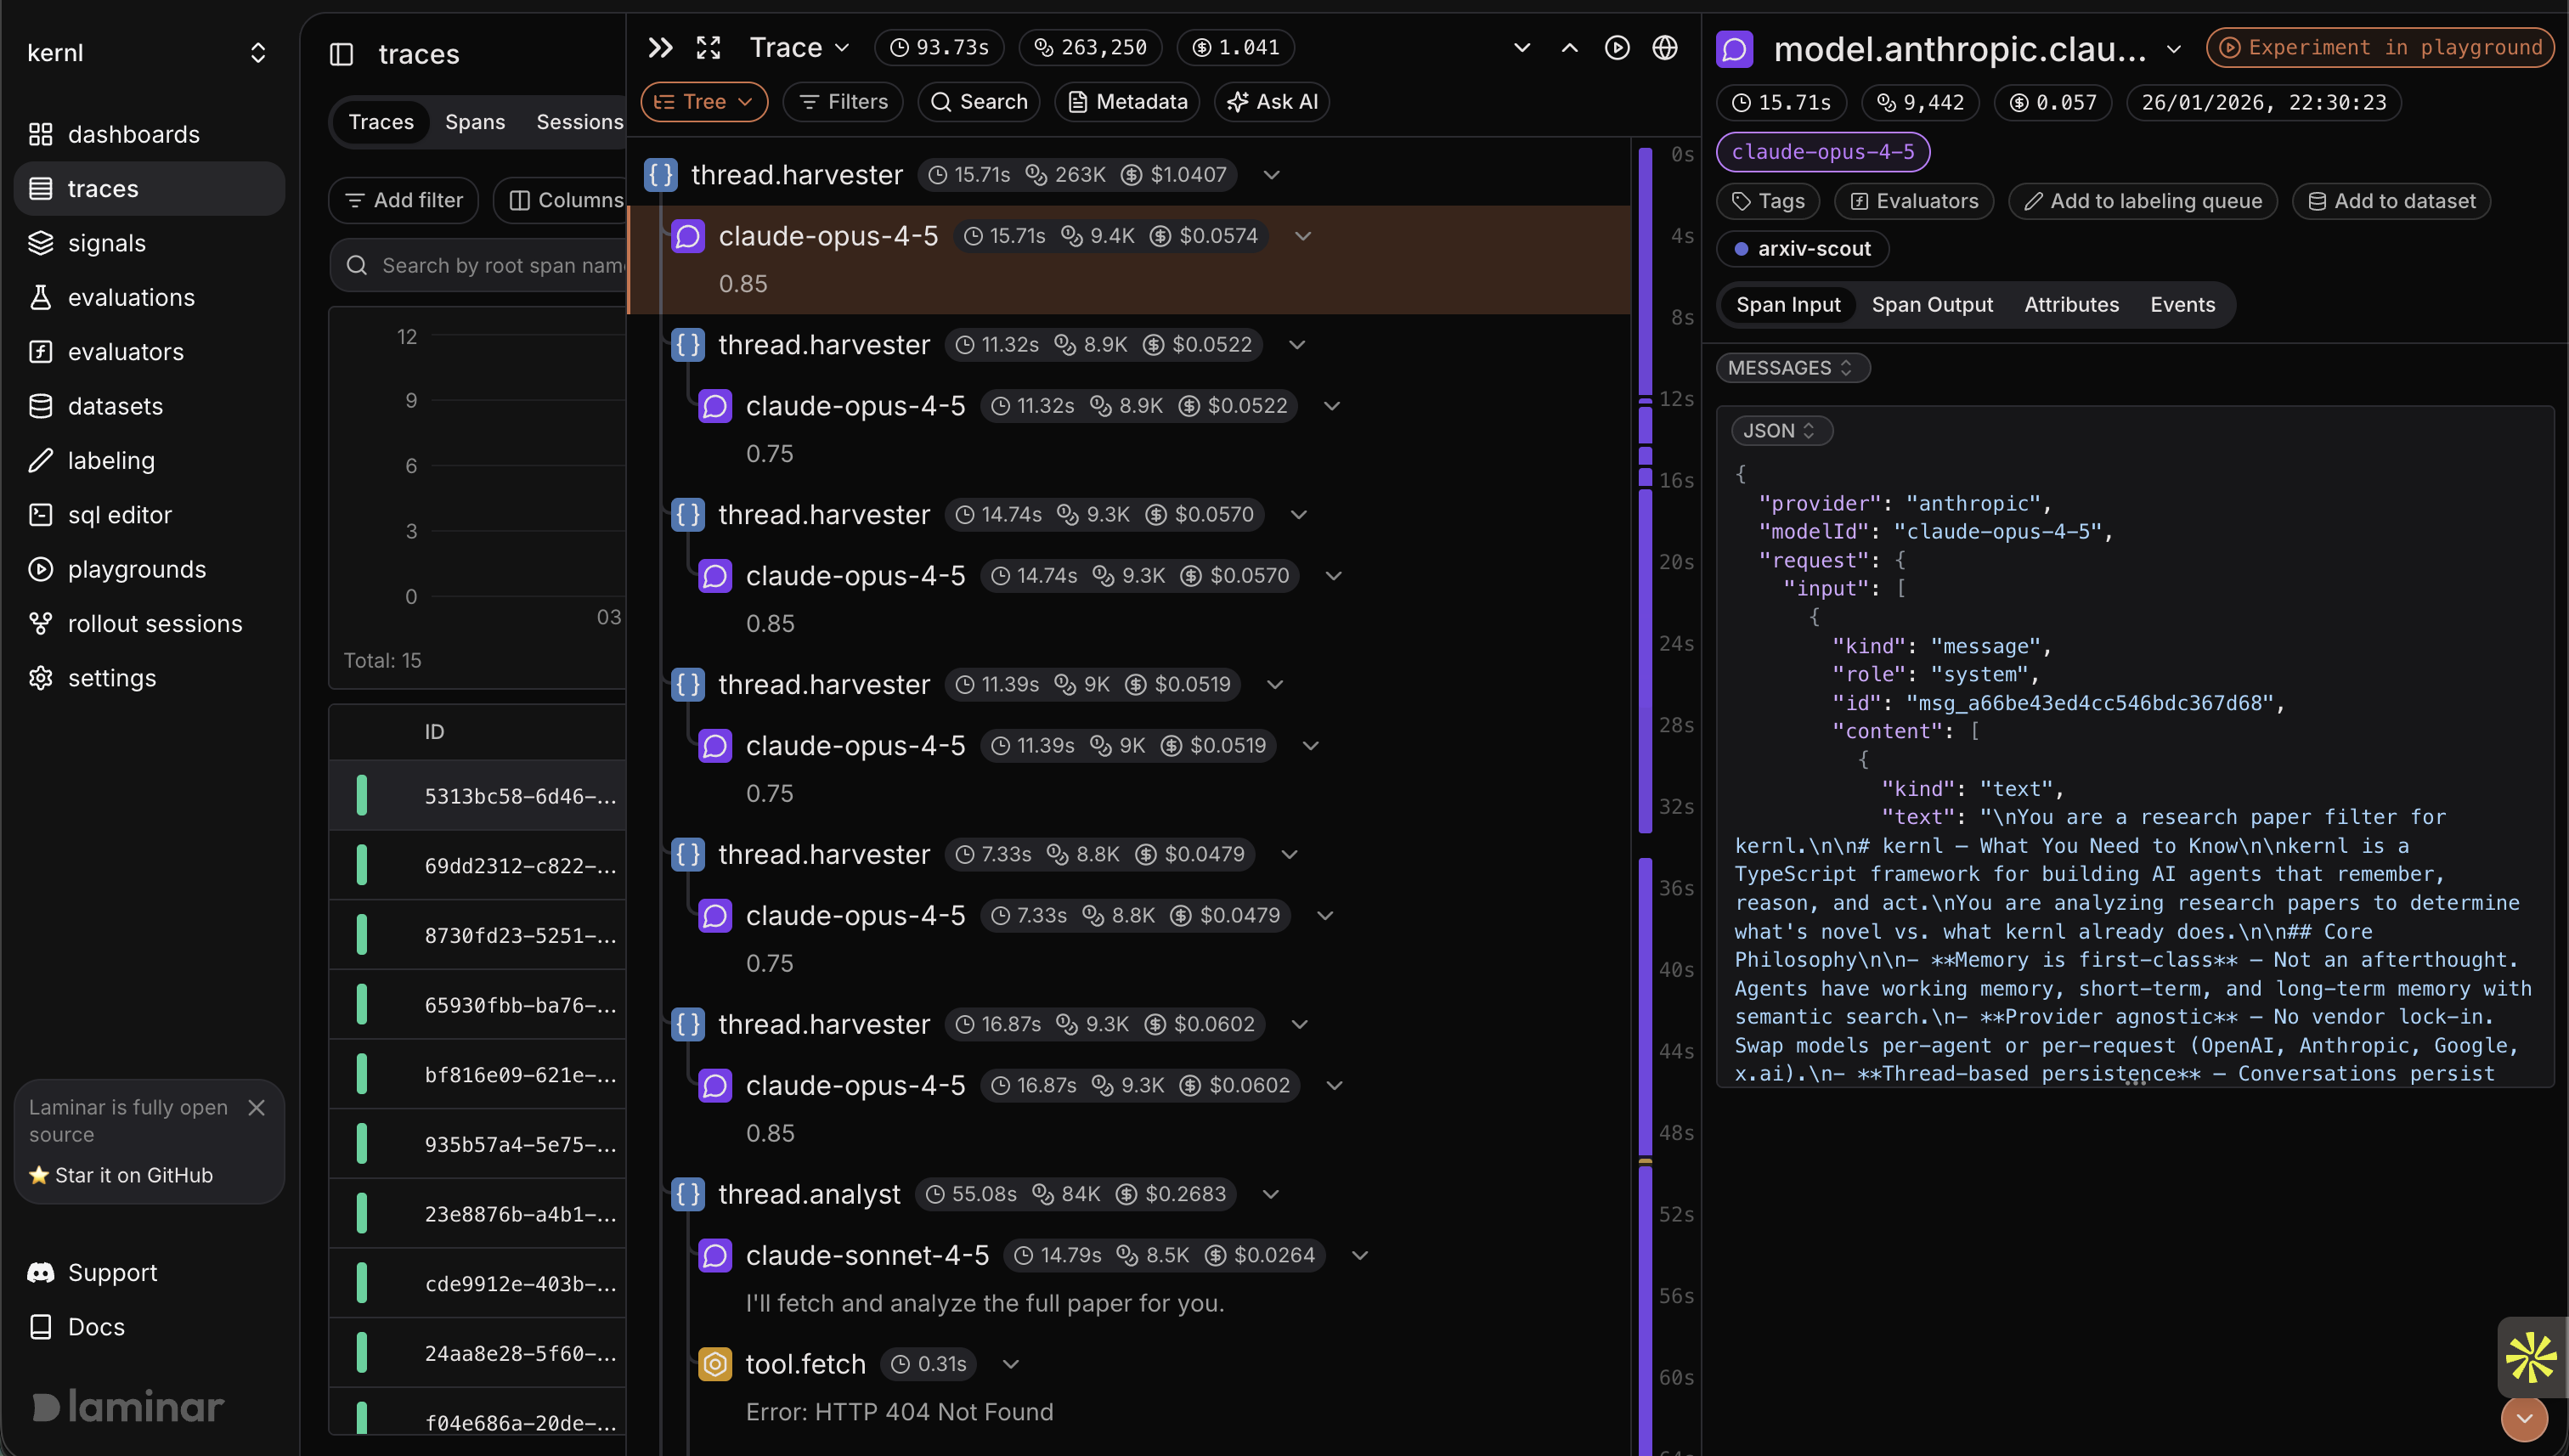
| Metric | Before | After | Delta |
|---|---|---|---|
| Duration | 104.89s | 93.73s | -10.6% |
| Tokens | 296,869 | 263,250 | -11.3% |
| Cost | $1.165 | $1.041 | -10.6% |
That's 11 seconds, 33,000 tokens, and 12 cents per run.
This pipeline runs on new arXiv drops daily, so the savings are small in isolation and meaningful in aggregate.
What we learned
The inefficiency wasn't in the agent's logic or prompting: the harvester/analyst separation was correct, the structured outputs were well-designed, and the model selection was reasonable.
The waste was in the plumbing: how context flowed between stages, what decisions were delegated to the LLM versus hardcoded, where network calls happened relative to each other.
These are exactly the things that disappear when you're writing the code because you're focused on whether the agent produces correct output; the trace shows whether it produced that output efficiently.
The investigation loop
This took about ten minutes:
- Run the pipeline, capture the trace
- Ask for systematic analysis of inefficiencies
- Scan the timeline for these anomalies
- Implement the recommended changes
- Rerun and compare
No custom profiling or printf debugging; the trace is the record and Ask AI is the analyst.
We'll keep hunting.
