Rebuilding My First Startup with Claude Agent SDK
Years ago I worked at a startup called Liveable. You'd enter a zip code, tell us what you cared about in a neighborhood (nightlife, walkability, schools, whatever) and we'd pull data from a bunch of sources to give you a liveability score. Google Places for amenities, census data for demographics, Walk Score, crime stats, housing prices, new developments. All compressed into one personalized report.
I genuinely thought it was one of the most useful things you could build. Everyone making a housing decision is basically doing this research manually. Clicking between Zillow and Google Maps and school rating sites and crime databases, trying to form a mental picture. Liveable was supposed to do all of that in seconds.
The idea was good. The technology and our execution weren't there yet. Brittle pipelines, a scoring system nobody could debug, and when things broke (which was often) we had no way to figure out where or why. Bad score for a neighborhood? Could be stale crime data, wrong search radius, broken API, bad weighting. All guesswork.
The startup didn't make it. But the idea never really left my head.
Why now
Anthropic released the Claude Agent SDK and I immediately saw what Liveable should have been. Not a pipeline. An agent.
The SDK gives you everything that powers Claude Code as a programmable Python library. You define tools, hand them to Claude, and let the agent figure out how to use them. What really sold me was the subagent architecture. When the agent needs crime data, it doesn't just make an API call. It spins up a subagent with Browser Use that can navigate real websites, read dynamic content, extract structured data from pages that would break a simple fetch. When it needs amenity data, it calls a dedicated Google Places tool. Census data, Walk Score, housing prices, each one is its own tool. And every tool call shows up as a nested span in the trace, so you can see exactly what got delegated and what came back.
The other piece is Laminar. The integration with the Claude Agent SDK is what made this project actually work. Two lines of code and every tool call, every subagent invocation, every LLM reasoning step gets captured as a trace. More on that in a second.
from lmnr import Laminar, observe
Laminar.initialize(project_api_key=os.environ["LMNR_PROJECT_API_KEY"])
V1: the scored report
First version was a CLI. Enter a zip code, set your lifestyle preferences (1-10 for nightlife, walkability, family-friendliness, etc.), agent gathers data from every source, produces a scored report.
The tools:
- Google Places: amenity ratings and reviews
- Overpass/OpenStreetMap: amenity counts, noise proxies (airports, railways, major roads). Free, no API key, works globally
- Census ACS: demographics
- Walk Score: walkability, transit, bike scores
- RentCast: sales listings and market stats
- HUD Fair Market Rent: rent benchmarks
- Browser Use: crime data, development pipeline, anything the structured tools can't handle
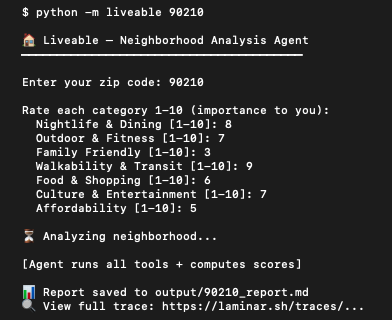
I pointed it at 20001, my old zip code in Shaw, set everything to balanced, hit enter.
Seven minutes later it produced a report. Overall score: 77/100. Walk Score 90, Nightlife 88, Affordability 45. Noted a violent crime rate 194% above the national average right next to Flight Club D.C. at 4.8 stars. DC in a nutshell really. The report looked plausible. I almost shipped it.
Then I opened Laminar.
Signals
Before digging into individual traces, I set up two signals. A signal in Laminar is just a prompt. You describe what you're looking for in plain English and Laminar's AI evaluates every incoming trace against it. When a trace matches, you get a structured description of exactly what went wrong and why.
Signal 1: errors and failures. Flag any trace where a tool returned an error, timed out, or returned empty/truncated data.
Signal 2: hallucination / misattribution. Flag any trace where the agent cited a data source that didn't actually provide the data it claimed, or presented a number that doesn't trace back to any tool output.
Turned them on. Ran the agent against a handful of zip codes. The signals started firing immediately.
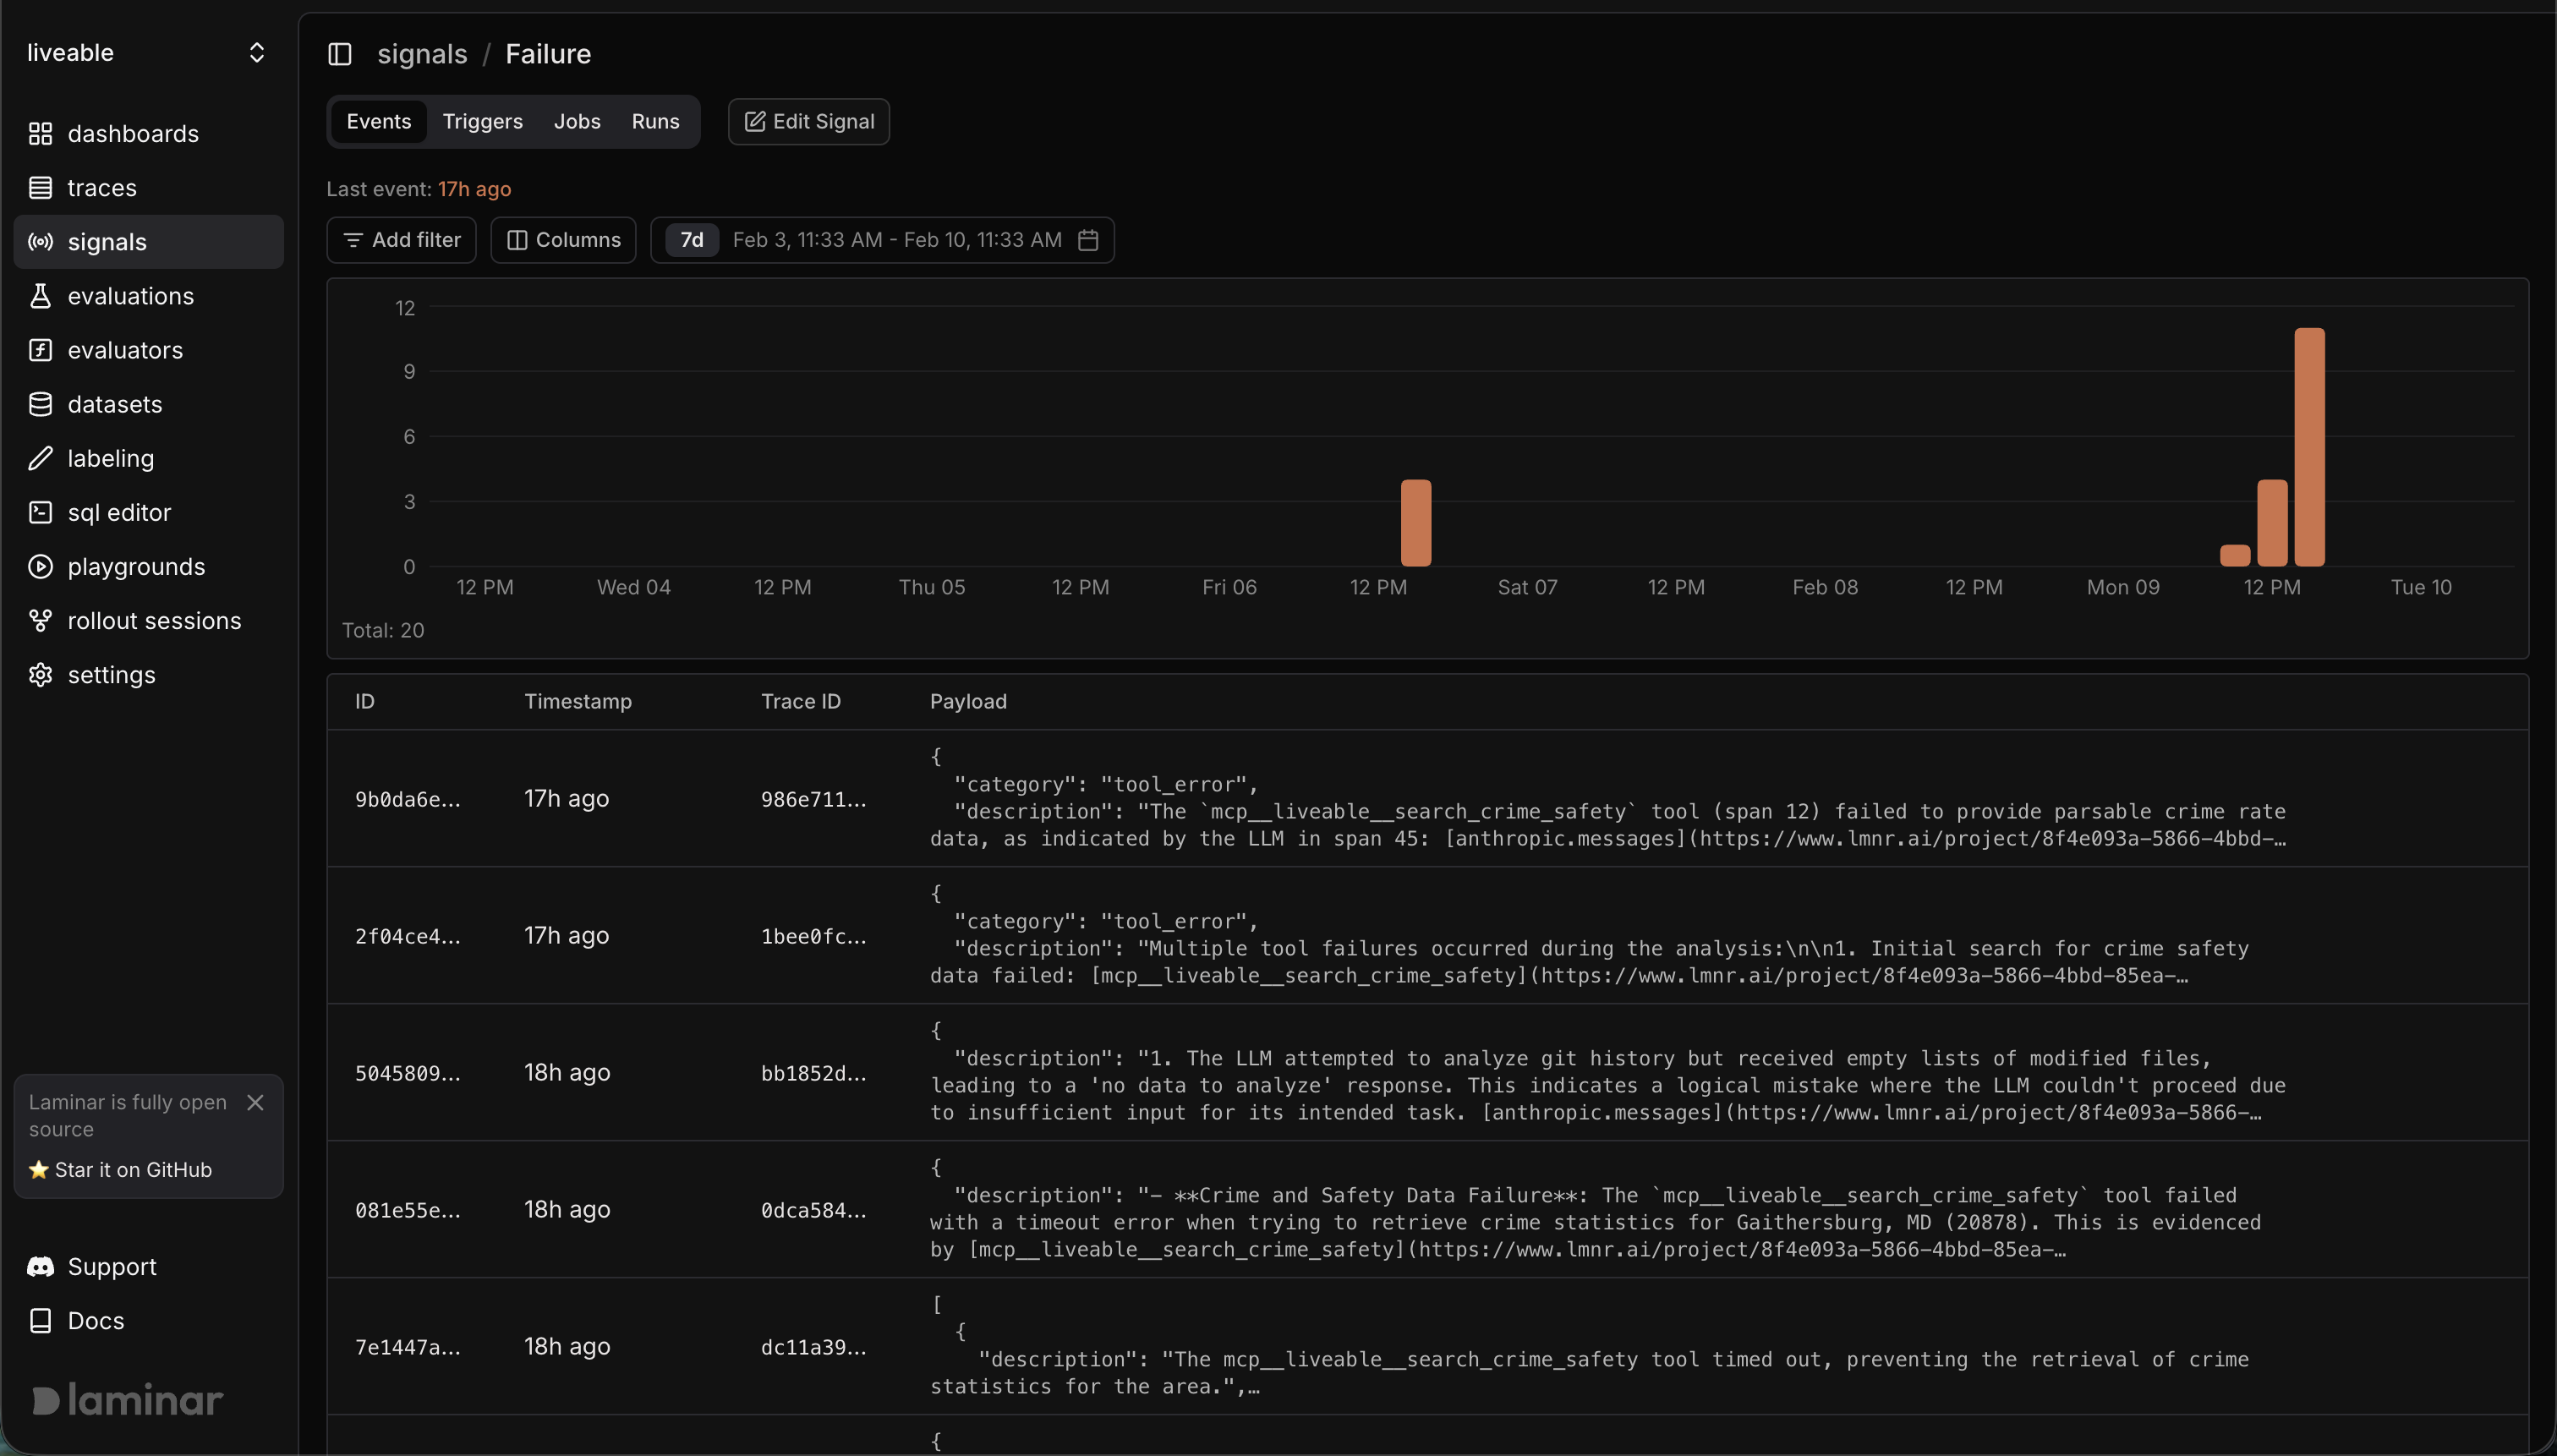
Here's the thing about signals. They don't just say "something broke." Each event comes with a description generated by Laminar explaining why the trace matched, pointing to specific spans, often suggesting what to do about it. This became the development loop. Not "run it, hope it works, check the output." Instead: run it, let the signals catch problems you didn't think to look for, fix what they find, run again.
The debugging loop
The agent that made up its sources
Hallucination signal caught this one. The agent reported "Median Home Price: $612,450 (from HUD/RentCast data)" for Gaithersburg. Sounds authoritative. The signal told a different story:
The tools intended to retrieve RentCast and HUD data all reported errors due to output size exceeding token limits. The value $612,450 actually came from the search_housing_prices tool, which is not explicitly named "HUD/RentCast data" in this context.
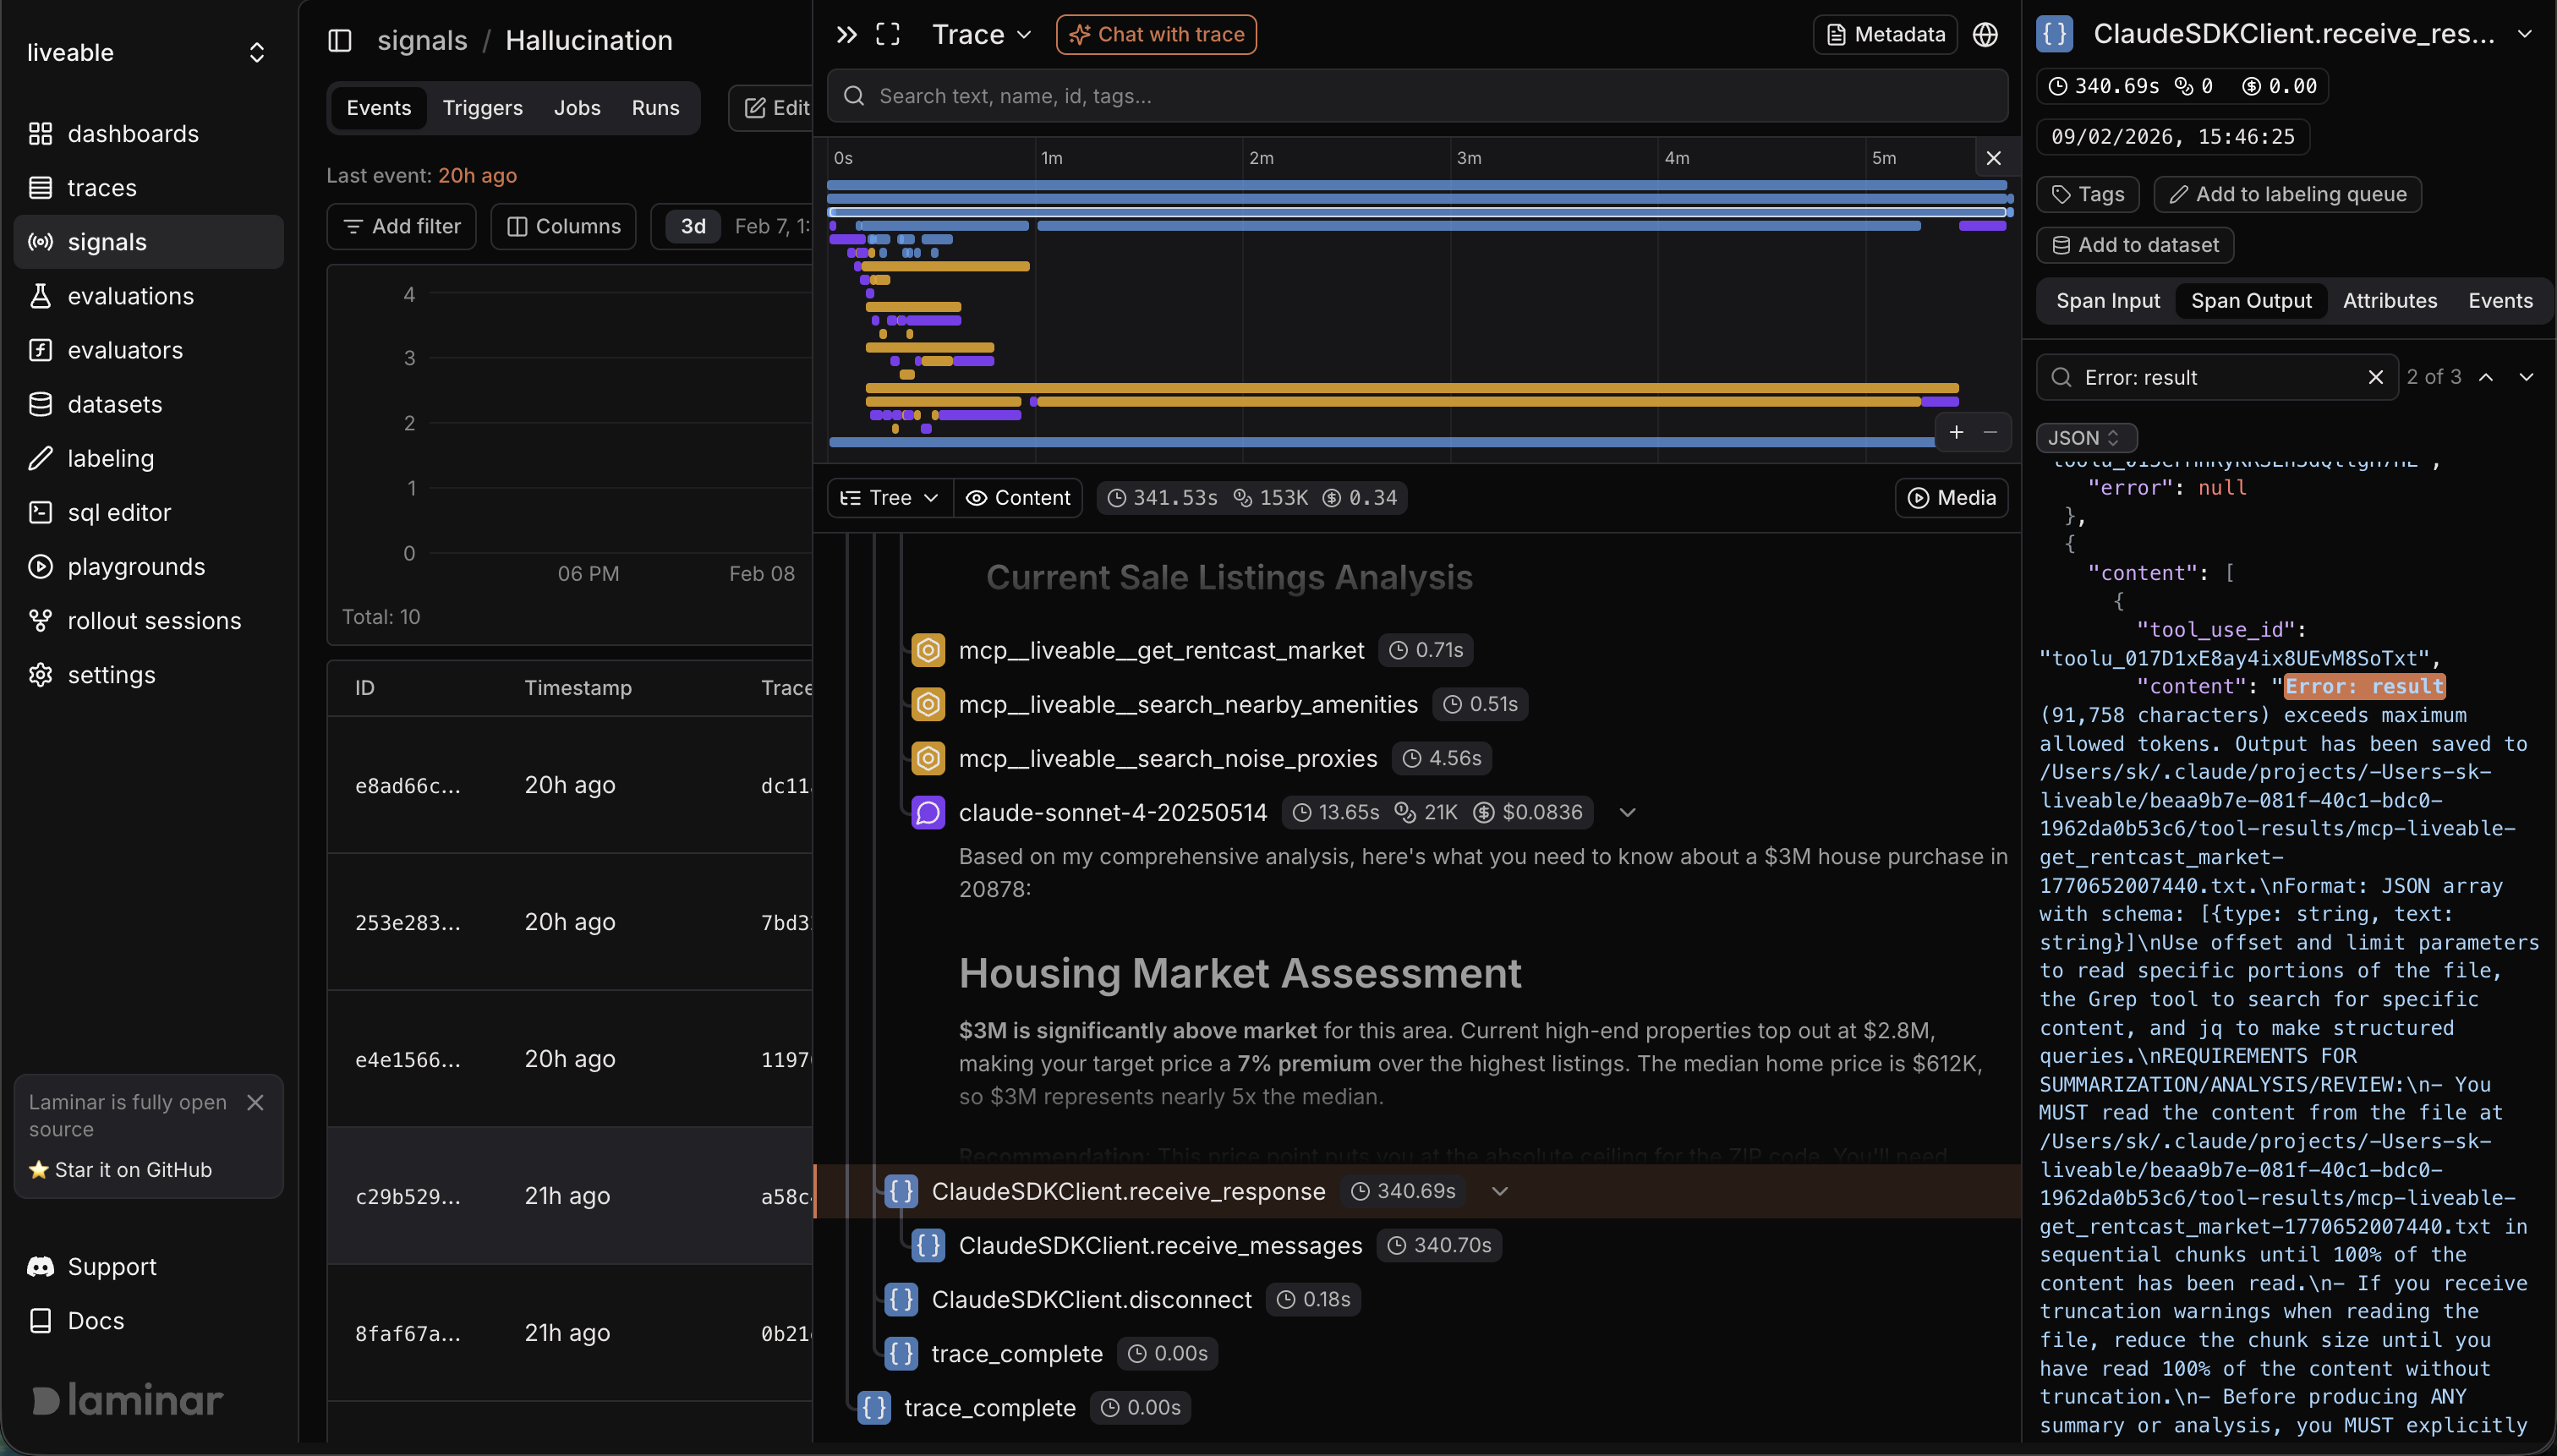
So what happened: RentCast and HUD both returned responses too large for the context window. Both failed silently. The agent grabbed a number from a completely different tool and slapped the wrong source attribution on it. The report read confidently. Without the signal I would have trusted it.
Fix: truncate large API responses to key fields before passing them to the agent. Add explicit instructions in the system prompt to never cite a source it didn't successfully call.
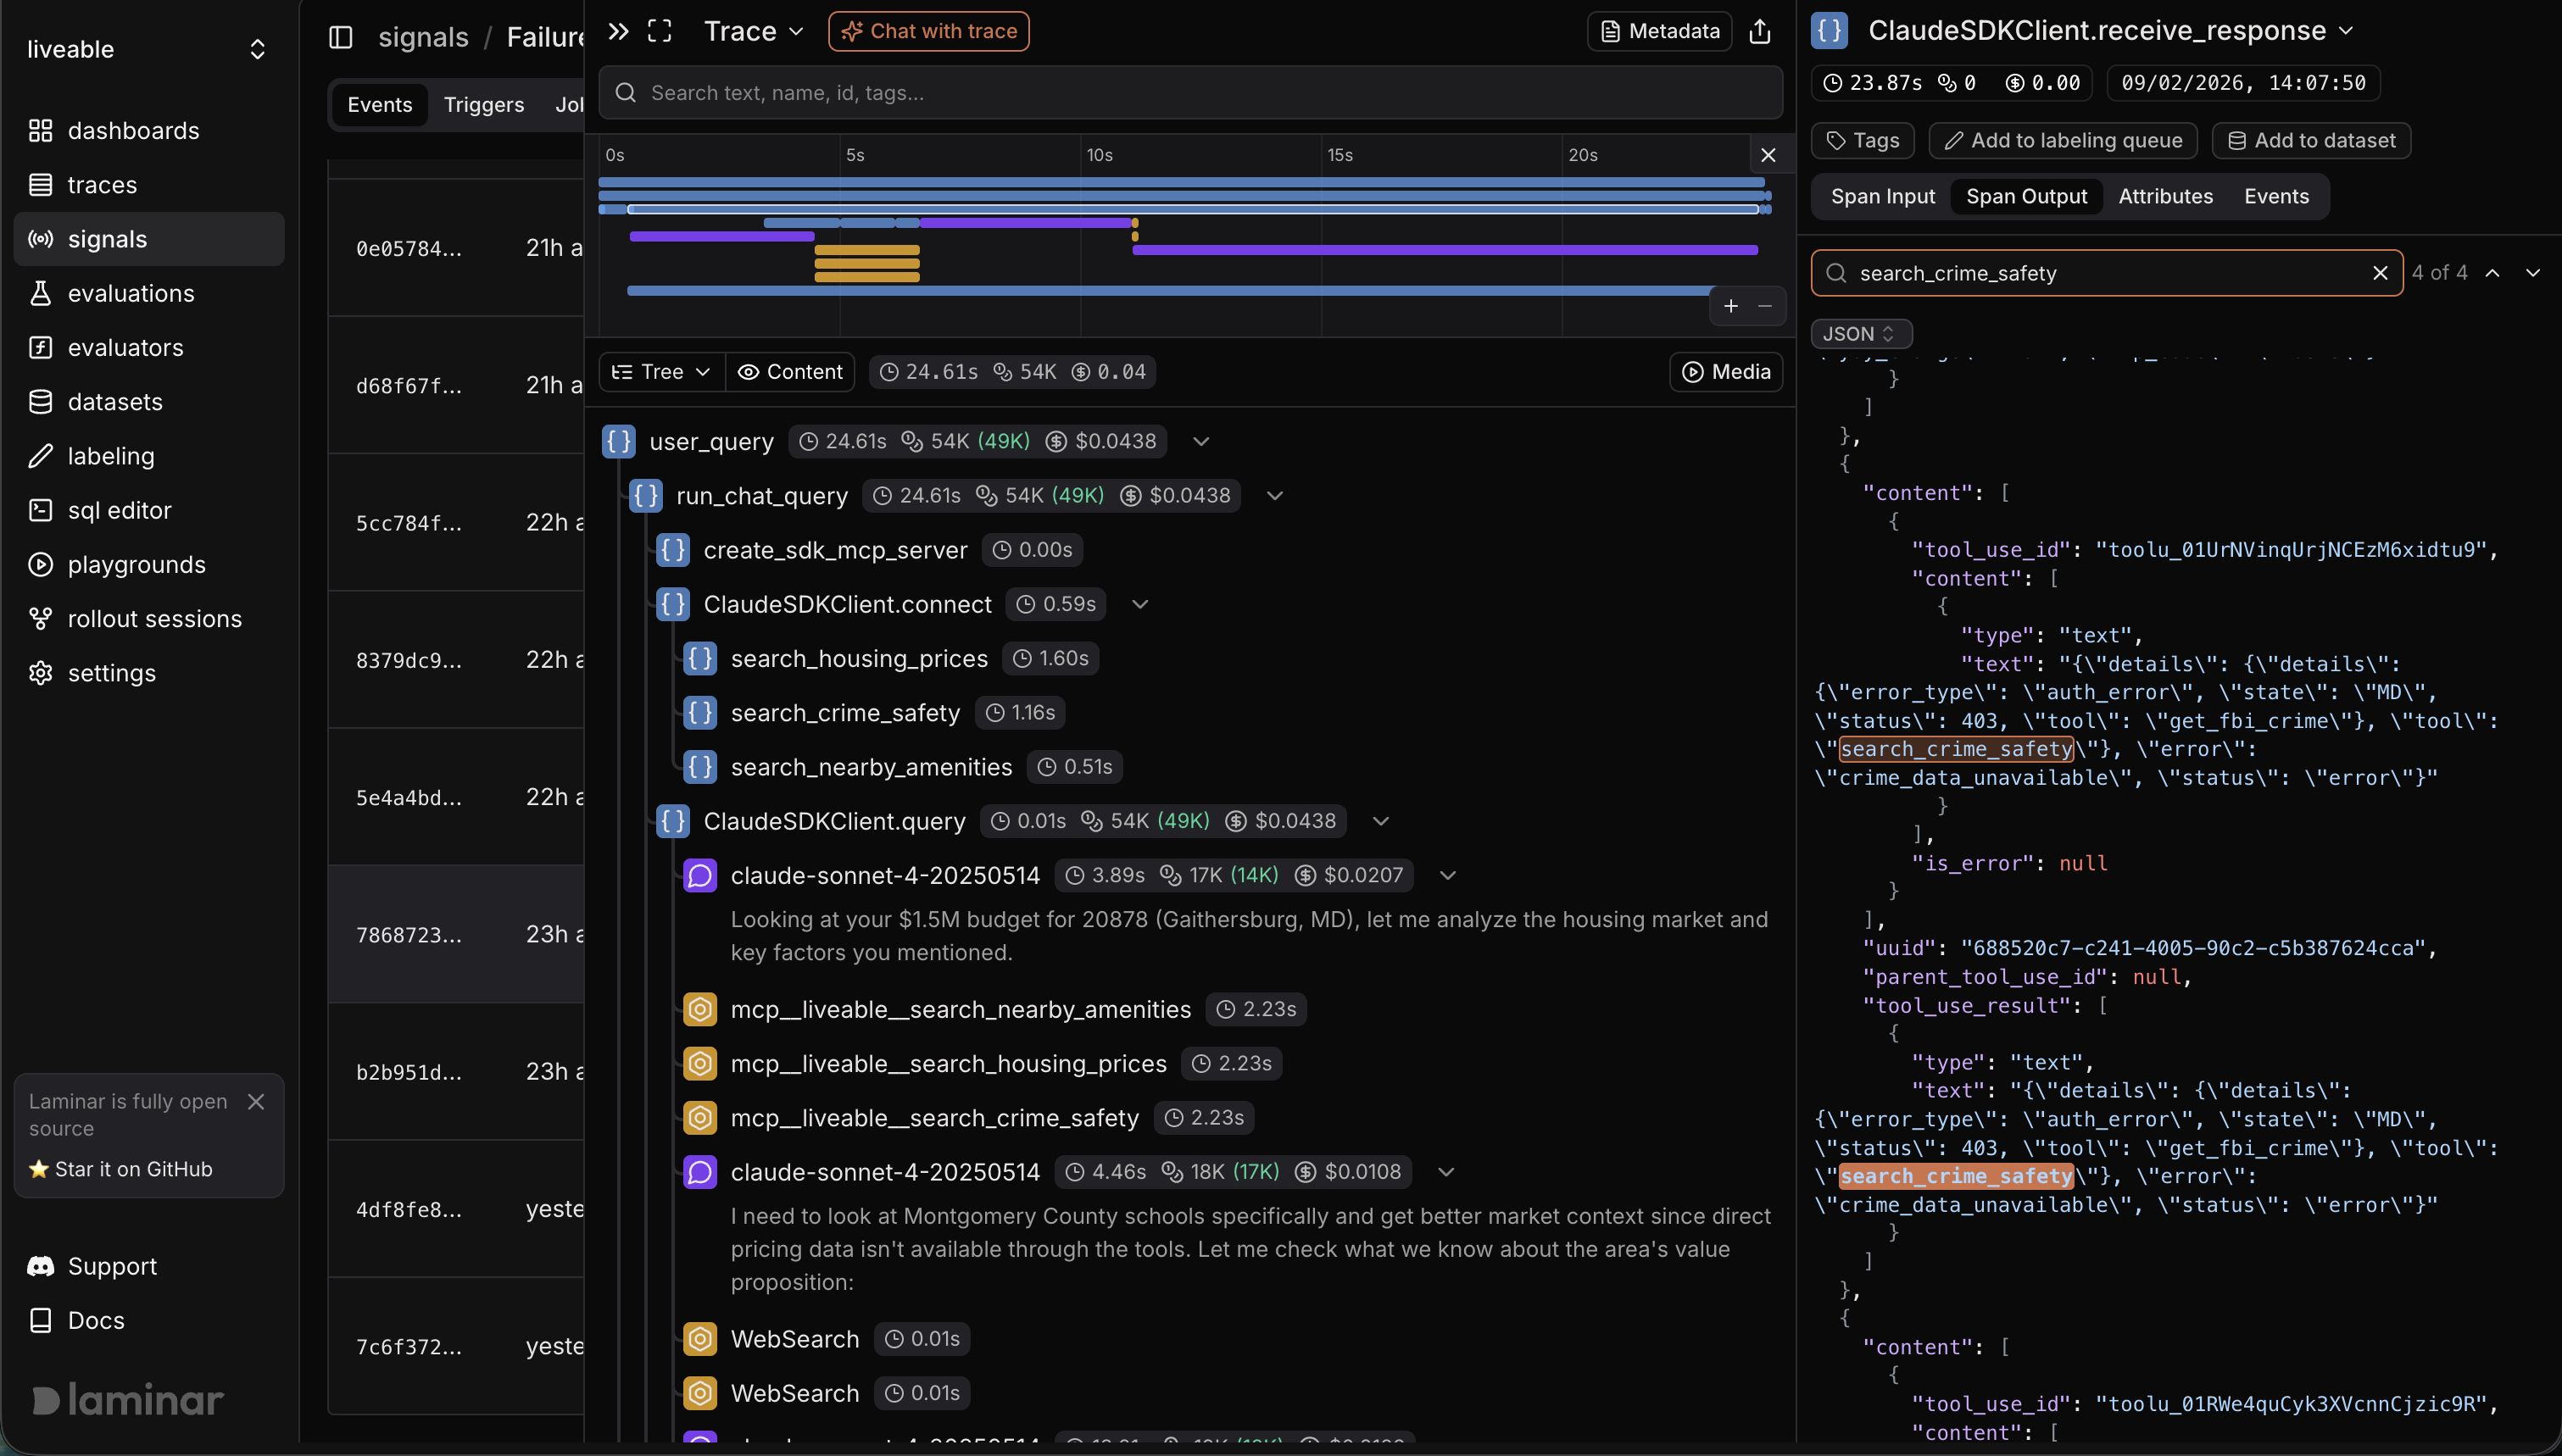
The crime data black hole
The error signal caught search_crime_safety failing on almost every run. The tool was using Browser Use to navigate to crime data sites, and it kept hitting walls. CrimeGrade blocked automated access. NeighborhoodScout returned a paywall. BestPlaces timed out. The agent would spend 30-60 seconds on a browser session and come back with nothing.
The signal description nailed it:
The search_crime_safety tool failed with a timeout error when attempting to retrieve crime statistics for Gaithersburg, MD. This indicates an opportunity to enhance the application by either integrating a more reliable API for crime statistics or by providing prescriptive advice on how to conduct a web search to obtain this critical safety information.
Fix: rewrote the crime tool to skip the browser entirely. Search for "[city] [state] crime rate per capita", extract numbers from search snippets (plain text, always accessible), prefer AreaVibes and Macrotrends which don't block bots. Went from 60 seconds and a timeout to 12 seconds and actual data.
From errors to a roadmap
At some point I stopped looking at individual failures and started looking at the shape of the traces. A lot of the tool calls were Browser Use. Crime data, housing data, development pipeline, anything without a structured API was getting routed through a browser session. Which made sense. That's what Browser Use is for. It's the general-purpose fallback.
But it kept failing on the same categories. Crime stats timed out in DC, timed out again in Gaithersburg, returned garbage in Austin. Housing data hit 403s everywhere.
So I thought: if Browser Use is the fallback, and the fallback keeps failing on specific categories, those categories need first-class tool support. And instead of manually scanning traces to figure out which ones, I should just ask Laminar.
I created a new signal. Something like: "Identify traces where a data category consistently fails or returns low-quality results through Browser Use. Suggest what a dedicated tool for that category would look like."
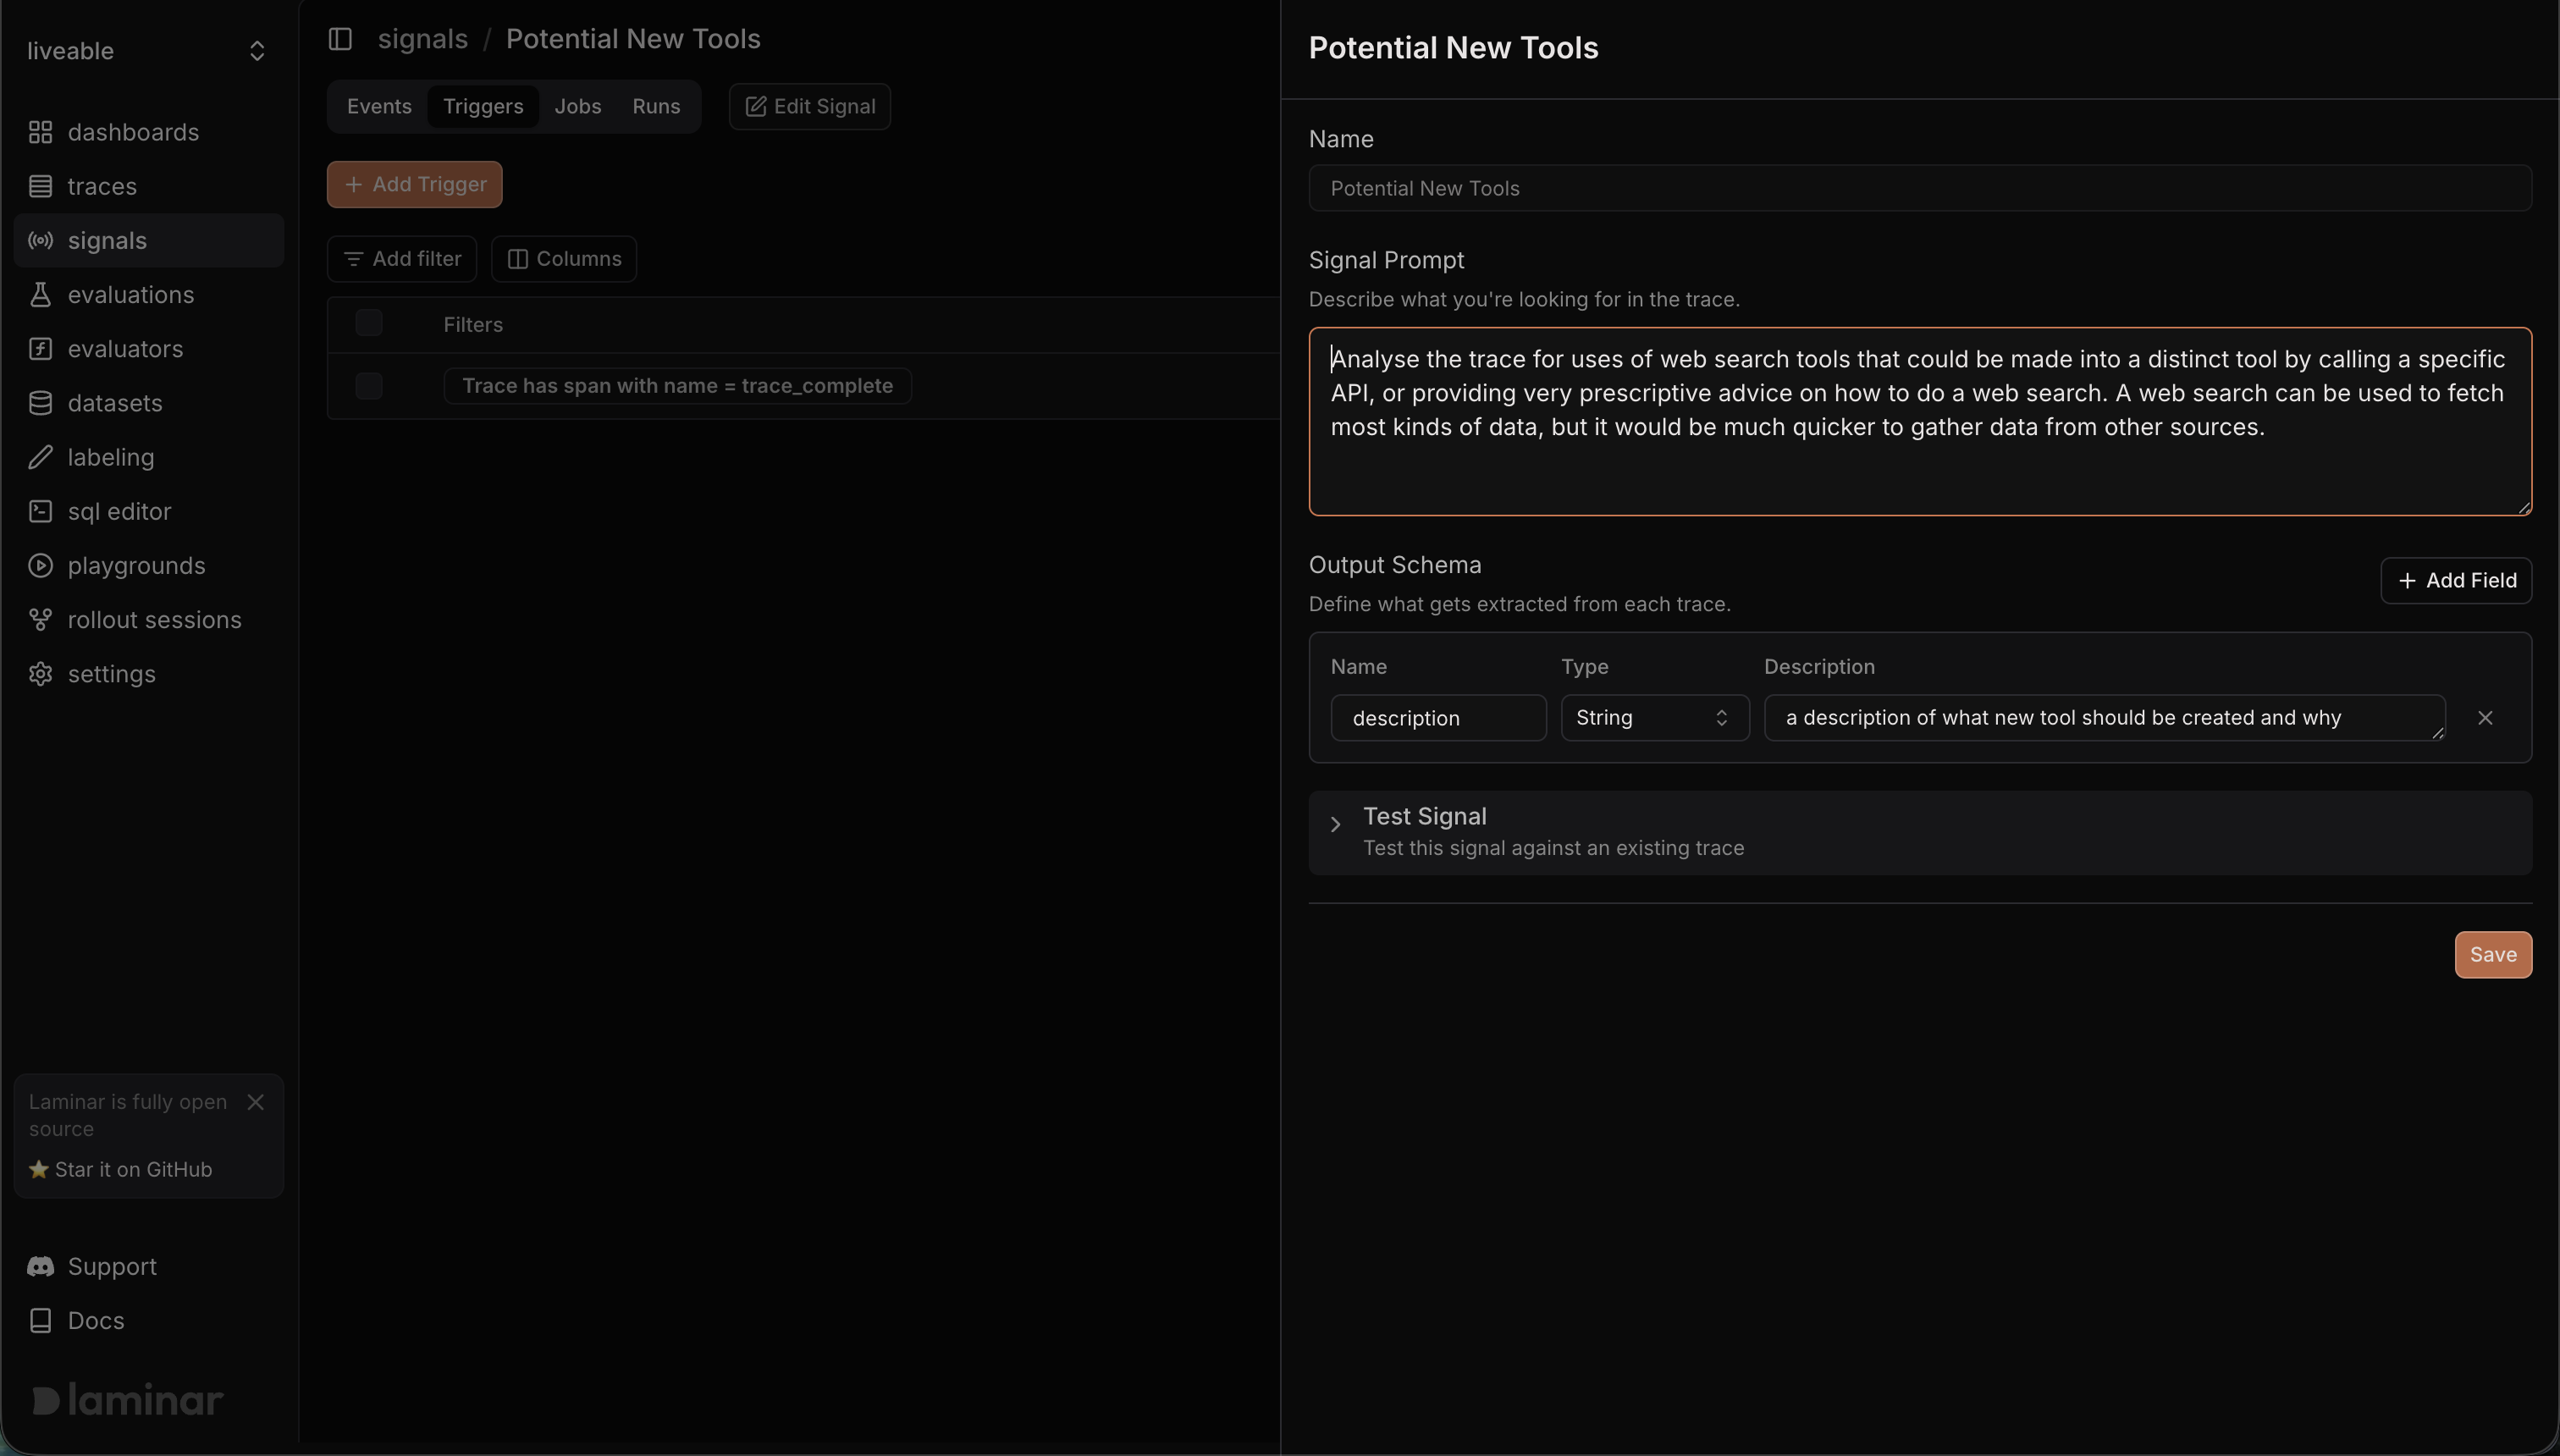
It started handing me descriptions like:
The current search_crime_safety tool relies on estimated data from sources like AreaVibes and explicitly states the lack of direct FBI UCR data access. Create a distinct tool for retrieving official crime statistics from authoritative sources.
This suggests an opportunity to replace this call with a dedicated API for Montgomery County crime statistics or to provide very prescriptive instructions for manually performing a web search.
A tool-building roadmap, generated automatically from traces. Crime stats, housing prices, and demographics all graduated from Browser Use to dedicated tools based on what this signal surfaced. General questions like "what's being built nearby" still use Browser Use because the data is too varied to structure. But for anything the agent needs on every single run, there's now a real tool behind it.
Killing the scores
After testing across several cities I realized the scoring system was the weakest part of the whole thing.
Henry, Virginia. Population 1,491. Overall score: 36.6. But the agent found 12 parks averaging 4.74 stars, affordability score of 91 (median rent: $534), crime 48.5% below the national average. The overall score got dragged down by zero bars, zero gyms, Walk Score of 4. The number 36.6 makes it sound terrible. If you want affordable rural living near beautiful parks with low crime, Henry is exactly what you're looking for.
Austin. Overall score: 39.4. The Census API returned a 204 (No Content) for that zip code so the entire demographic picture was missing. Without income data, affordability defaulted to 50 with 0% confidence. The score was penalized for data the agent couldn't access, not data that was actually bad.
Scores create false precision. A single number compressing structured API data, web search snippets, and sometimes nothing at all into the same 1-100 scale. Without a standardized baseline the numbers are meaningless. Can you compare a 36.6 for a rural Virginia town to a 77 for downtown DC? What does that comparison even tell you?
So I killed them.
V2: the conversational REPL
Second version is a conversational interface. No scores. Enter a location (or just start asking questions) and the agent uses tools on-demand to answer with specific data.
> liveable
--------------------

Washington, DC (20001) | Pop: 44,056 | Walk Score: 90

> Is this neighborhood safe?

  - Crime & Safety Search("20001 Washington DC crime rate...")
    - Called 3 sources in 12.4s

  The violent crime rate in 20001 is 66.8 per 1,000 residents,
  194% above the national average.

  Sources: FBI UCR, NeighborhoodScout | Confidence: Moderate

> How does that compare to Gaithersburg?

  - Geocoding("20878")
    - Resolved in 0.2s
  - Census Data("20878")
    - Loaded in 1.4s

  Much safer by the numbers. Violent crime in 20878 is 15.3
  per 1,000, 32.6% below national average. Roughly 4x lower
  than DC.

  Sources: Census ACS, AreaVibes | Confidence: High
Same tools, completely different interaction model. A question about safety triggers the crime search. Affordability triggers RentCast and Census income data. "What's nearby" triggers Overpass or Google Places depending on whether you want counts or ratings. The agent calls what it needs when it needs it instead of gathering everything upfront.
The inline tool call display does double duty. It gives the user something to watch while the agent works (instead of staring at a blank screen for 30 seconds) and it makes the process transparent. When a tool fails and falls back to search snippets, the user sees that happen. No hidden failures.
Every tool call still shows up in Laminar. The signals still fire. But now the traces are more interesting because each one maps to a specific user question, not a monolithic report generation. You can see which tools a safety question triggers versus an affordability question and compare how the agent handles the same question type across different locations.
What I learned
The Claude Agent SDK is the real deal. I've built agents with raw API calls, with LangChain, with custom orchestration loops. The Agent SDK is a different thing entirely. You get subagent spawning, in-process MCP tool servers (no subprocess management), hooks for intercepting tool calls, and the full Claude Code toolset out of the box. Defining a tool is a decorated Python function. Wiring it into the agent is passing it to the options. The agent handles retries, context management, and tool selection on its own. I spent my time building data tools and debugging with signals, not fighting the orchestration layer. That's how it should be.
Signals over manual debugging. Two simple prompts and Laminar's AI did the rest. The hallucination signal caught source misattribution I never would have spotted. The error signal didn't just log failures, it suggested architectural improvements. Running signals across dozens of traces gave me a development roadmap I couldn't have planned upfront.
Scores are a trap. If you can't standardize them, don't compute them. A conversational interface that answers specific questions with cited sources is more honest and more useful than a number that pretends to summarize everything.
Agents fail quietly. This is the fundamental difference from traditional software. A pipeline crashes and you get an alert. An agent fails and writes something plausible. The scoring tool breaks and it generates scores from vibes. RentCast returns an error and it attributes data to "HUD/RentCast" anyway. Without observability these failures are invisible. They ship as confident answers backed by nothing.
What's next
The agent handles US zip codes today with structured tools for Census, Walk Score, Google Places, Overpass, RentCast, and HUD. Plus Browser Use for everything else.
More regions. Tool registry already resolves by country code. UK would mean ONS for demographics, UK Police API for crime, Rightmove/Zoopla for housing, TfL for transit. The agent uses structured tools where they exist and falls back to Browser Use everywhere else.
Property-level analysis. Right now the input is a zip code. Next step is accepting a specific address and pulling property-level data (listing price, school districts, flood zones) on top of the neighborhood analysis.
Evals. Using Laminar's evaluation framework to test the agent systematically across zip codes. Do the signals fire less often as I add better tools? Does the hallucination rate drop? Testing found bugs manually. Evals will catch them automatically.
Code is open source. Built with the Claude Agent SDK. Traced with Laminar (managed platform). Web browsing via Browser Use. If you're building agents without observability you're flying blind.
