
Someone asked us last week: "so how are you different from Langfuse?"
We get that question a lot. The honest answer is that Langfuse and Laminar started from different places. Langfuse built a prompt-management and evaluation product and added tracing. Laminar built a trace-first debugger for long-running agents and layered evals, datasets, and analytics on top. Both are open source. Both capture LLM calls. The day-to-day shape of using them diverges as soon as your agents start spawning subagents, calling tools, and running for minutes.
This post is biased toward Laminar. It is also concrete: every section maps to a surface you can click on right now, with a link to the docs page that describes it. If you're deciding between the two today, treat it as our side of the argument.
Transcript view is the default, not a span tree
A ten-minute Claude Agent SDK run produces a trace with hundreds to thousands of spans: the outer agent, its planning turns, every tool call, and each subagent's own tree of LLM turns and tool calls. Opening that in a span tree gives every row equal visual weight. You scroll an outline to reconstruct what the agent actually did.
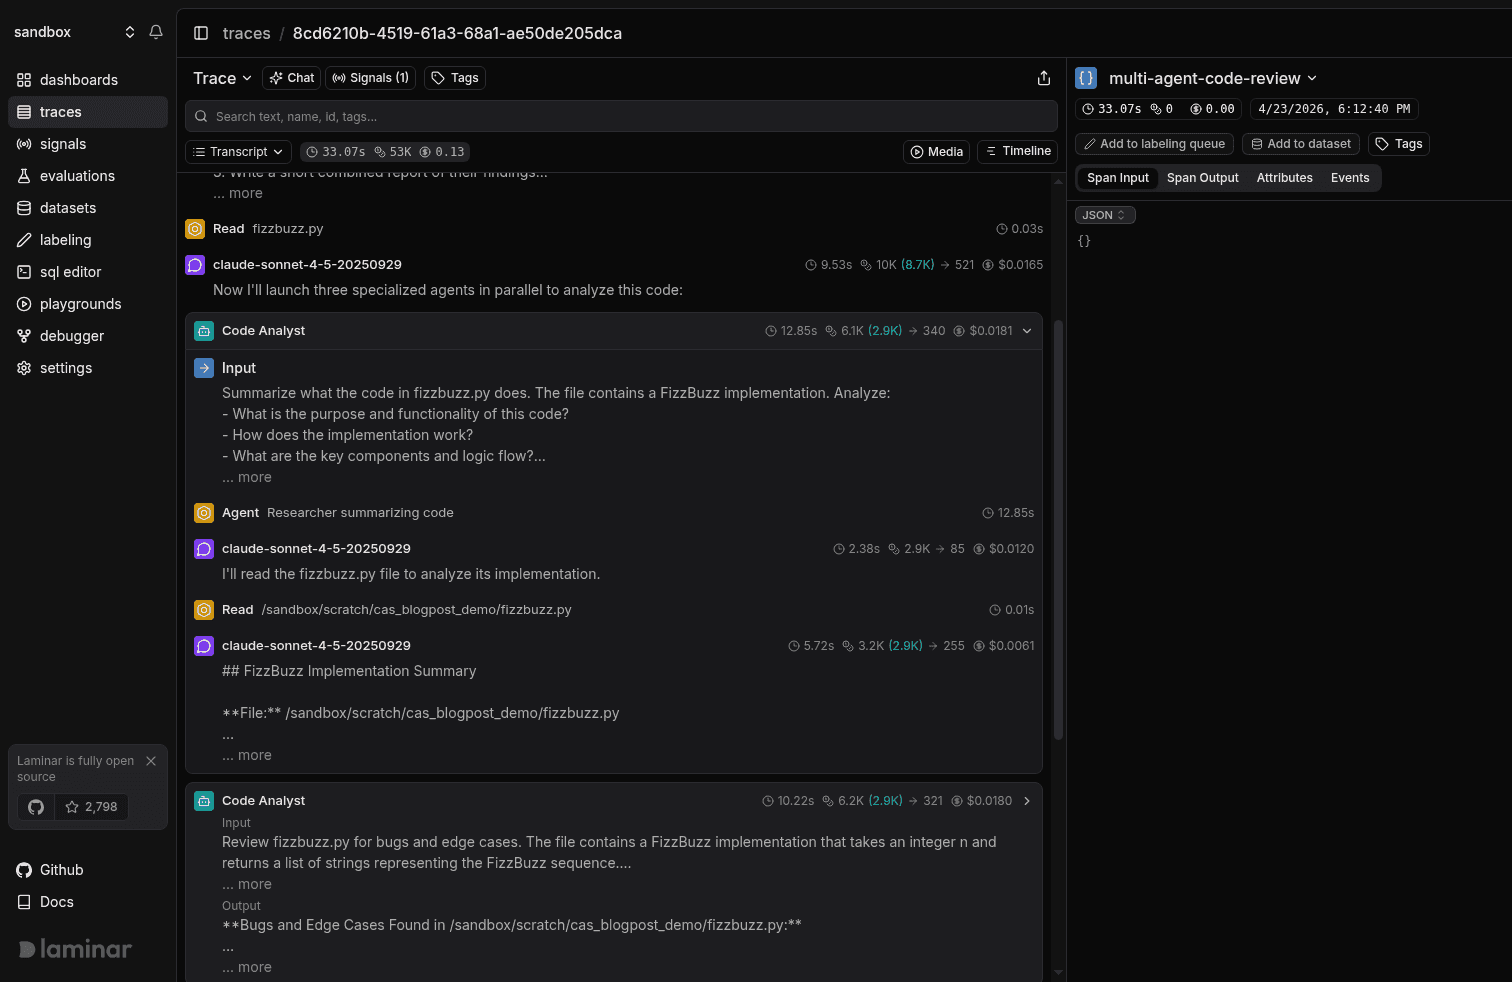
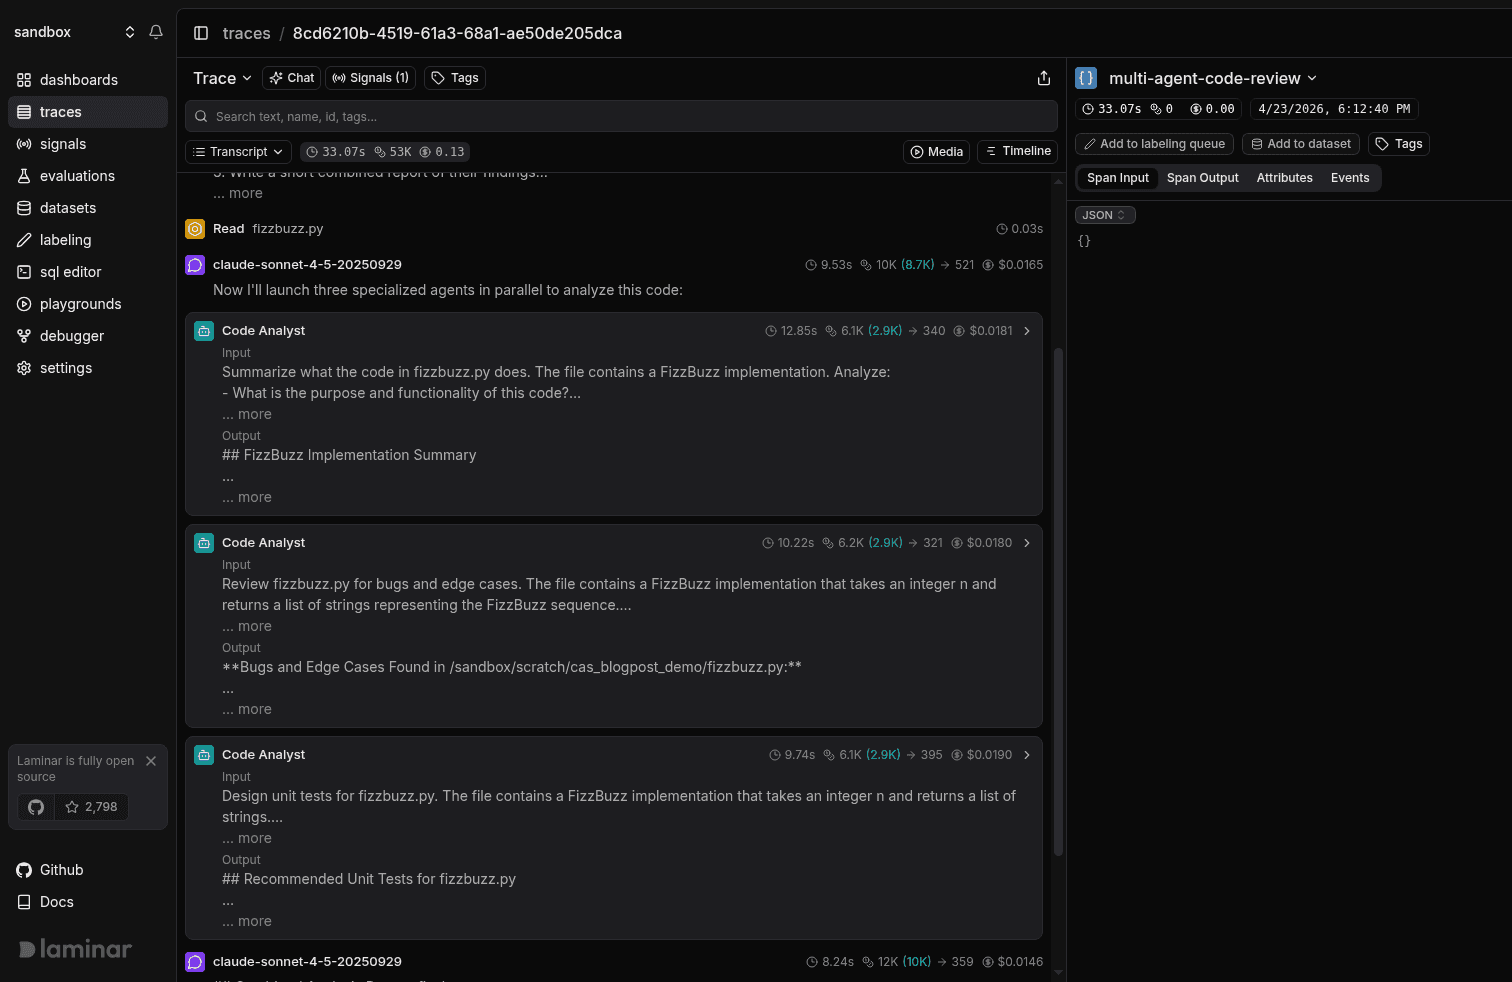
Laminar's default Transcript view reads the trace as a conversation instead. The root agent input, each LLM turn, each tool call, and each subagent are laid out top-to-bottom in reading order. Three things are surfaced for free:
- Input on every agent and subagent. Parsed from the system and user messages of the underlying chat completion. No instrumentation required; works with OpenAI- and Anthropic-style calls.
- Subagents as collapsed cards. A Claude Agent SDK run with six Code Analyst subagents renders as six cards with per-agent Input, Output preview, duration, tokens, and cost. Click one to expand it in place. The rest stay collapsed.
- Inline previews on every row. One-line preview of each LLM response and each tool call (Read fizzbuzz.py, Bash ls /sandbox) so you can scan without expanding.
Tree and Timeline views are one click away in the view dropdown when you want them. Tree is useful for debugging a custom integration or confirming parent/child nesting. Timeline is the view to reach for when you're looking at latency gaps and overlaps. But for "what did the agent do and where did it break", transcript is where you start.
Langfuse's trace UI is structured around observations (nested generations, spans, and events). It's a solid fit for prompt-centric telemetry. It is not optimized for the "read the agent's transcript" workflow that defines multi-agent debugging.
Signals: the cross-trace layer
One trace tells you what happened on that run. Signals tell you how often, when, and which runs across your entire history.
A Signal pairs a plain-language prompt ("the agent looped on the same tool call without making progress") with a JSON output schema. Laminar reads every trace that matches the Signal's triggers, runs your prompt against it, and writes a structured event to the signal_events table when the pattern matches. Triggers run the Signal live on new traces; Jobs run it against a historical slice so you can backfill months of traffic against a new hypothesis.
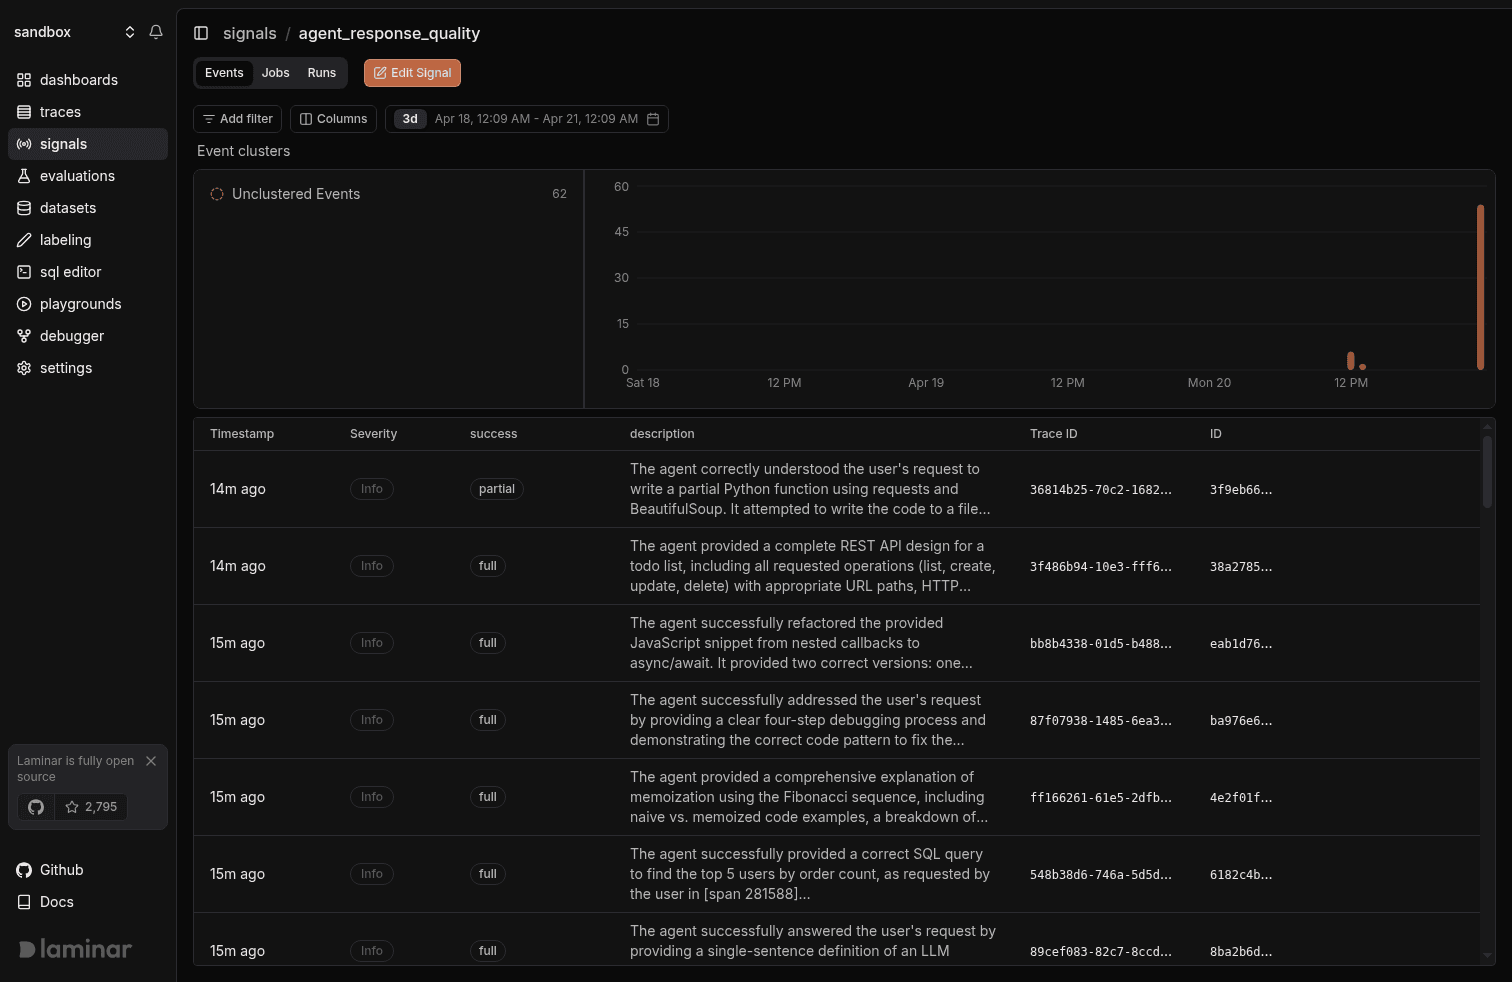
The events are not a dead log. You can:
- Cluster them automatically. Clusters group semantically similar events so a week of 4,000 agent_failure events becomes five or six distinct failure modes in a sidebar.
- Query them in SQL alongside your traces and spans. Every event is linked to the trace that produced it, and the payload JSON is a fully queryable column.
- Alert on new events or new clusters. Slack, email, or in-app. Every new Signal auto-creates a Critical-severity alert for matching events out of the box.
Langfuse's equivalent is closest to its evaluators and session-level scoring. Useful, but the abstraction is different: evaluators score each trace individually, where Signals are designed to produce a queryable stream you can slice across traces, cluster, and alert on.
SQL over every trace, span, event, and eval
Laminar exposes a SQL editor that reads the same ClickHouse analytics tables the product queries internally: traces, spans, signal_events, signal_runs, logs, dataset_datapoints, evaluation_datapoints. Full schemas are documented in the SQL Editor reference.
A few things this changes in practice:
- You can answer "what's the p95 cost of the planner span across the last week's production runs, grouped by response model" without waiting for a UI feature.
- You can build an evaluation dataset straight from production by selecting the spans you want and exporting to a dataset.
- You can query from outside the UI via the SQL API at /v1/sql/query, or let Claude or Cursor drive it over the Laminar MCP server.
Langfuse ships a strong SDK and API, and its data is accessible programmatically. The tradeoff is that the common debugging loop (open a failing trace, write a one-off aggregation, save it as a dataset) happens outside the product in code.
Debugger: rerun agents from the span you care about
The bottleneck on long-running agent debugging isn't the first run, it's the next twenty. You change a system prompt, wait ten minutes for the agent to reach the branch you care about, then find it took a different path and never hit the event you were trying to reproduce.
The Debugger sets a checkpoint on any span inside a trace, reuses the cached outputs from earlier in the run, and reruns from there with whatever config change you just made. Works for AI SDK (stopWhen: stepCountIs(N) loops), Browser Use Agent loops, and any general Python loop that calls LLM + tools repeatedly. Wrap the entrypoint with observe({ rolloutEntrypoint: true }) (or @observe(rollout_entrypoint=True) in Python), run npx lmnr-cli@latest dev path/to/entry.ts, and every subsequent rerun happens in the trace pane without leaving Laminar.
Langfuse ships a prompt playground for iterating on single prompts. There's no equivalent to rerunning a multi-step agent from a specific span with the prior steps cached.
Full-text search and live tracing
Two smaller surfaces worth calling out, because they change the debugging loop on real traffic:
- Full-text search across span inputs, outputs, and flattened attributes, backed by a dedicated Quickwit inverted index, time-aware by the current filter. A string like a user's ID, a prompt phrase, or an attribute value jumps you straight to the trace.
- Live tracing: spans appear in the trace view as they finish, so you can watch a long-running agent fill in in real time instead of waiting for the root span to close.
These are the kinds of features that show up when debugging is the first-class workflow the product is designed around.
When Langfuse is the right call
We're honest about this: if your workload is prompt-centric (single LLM calls, short chains, templates you iterate on), Langfuse's prompt management, versioning, and playground are mature and tightly integrated with their eval framework. Teams whose day-to-day is "which prompt version performed best on this eval set" will find Langfuse a better fit than Laminar. If your bottleneck is organizing prompts across a team, start there.
When Laminar is the right call
If your agents:
- Spawn subagents, call tools in loops, and produce traces in the hundreds-to-thousands of spans
- Run in production and need real-time visibility while they execute
- Benefit from structured cross-trace analysis (how often does this failure mode happen, across what traffic)
- Need reproducibility of the exact checkpoint where something went wrong
Then Laminar's bias matches yours. Transcript view, Signals, SQL, and Debugger compose into a single loop: see what the agent did, characterize the failure, find every other occurrence, reproduce it from the offending span.
Try it
Start by tracing a single agent workflow: five minutes with the SDK quickstart, open the trace, and you'll see the transcript view on your own run. The difference from a span tree is obvious once you're reading the agent's conversation instead of its structure. If you want a walkthrough on your own production traffic, reach out and we'll do a joint debugging session on real data.