Reading traces, scanning for patterns, searching for the one run where things went wrong. When you're debugging agents in production, this is the work. You know something broke and you have the data, but extracting meaning from thousands of traces means writing custom scripts, eyeballing logs, or hoping you stumble on the right example.
Until now.
Today we're introducing Signals: a way to define what you're looking for once, then extract it from any trace, past or present.
What is a signal?
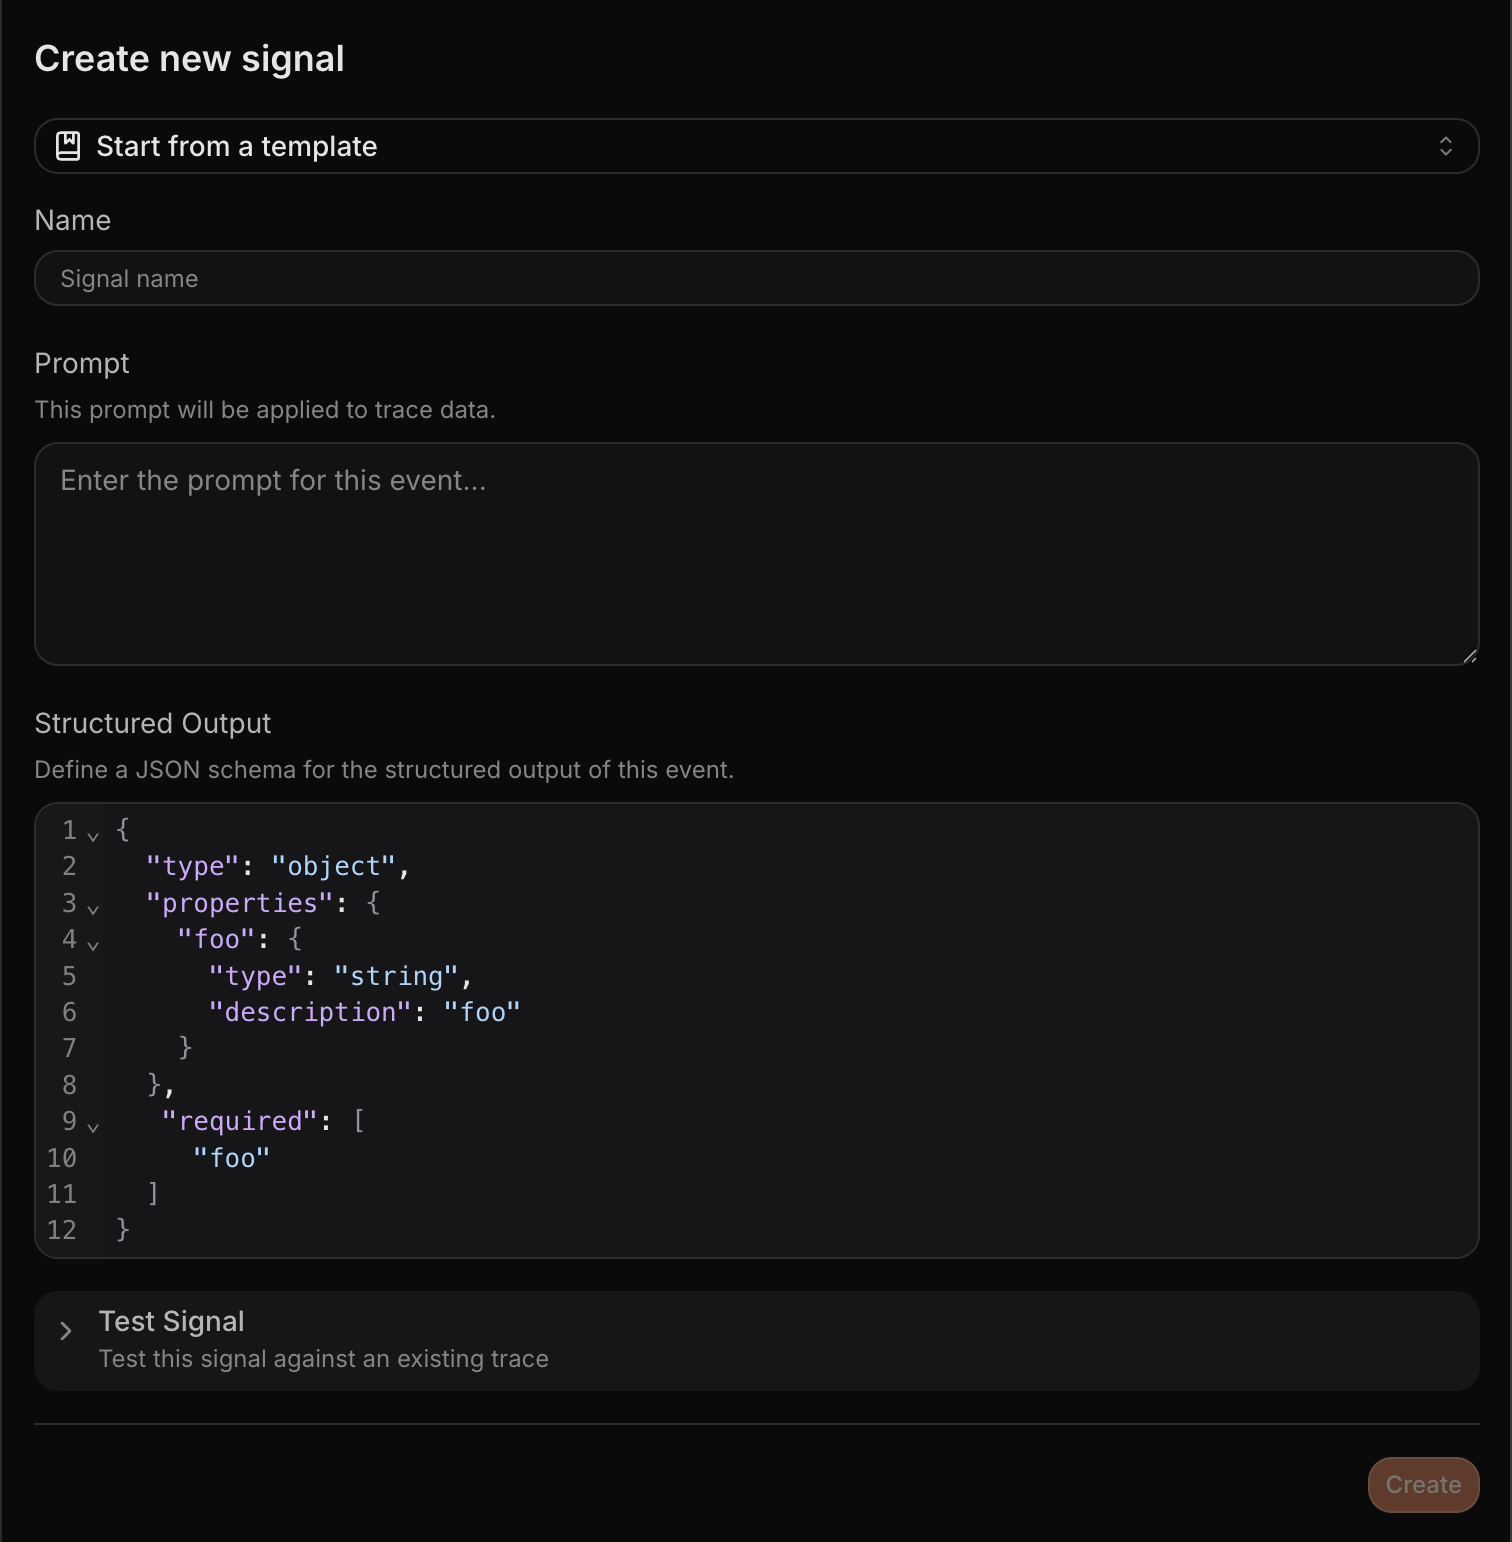
A signal is a definition: a name, a prompt, and a structured output schema. Once defined, it runs against trace context and returns structured data.
Signals are LLM-extracted. You define the question, point it at your traces, and get structured answers back without code changes.
Case study: a coding agent in production
You've built a software engineering agent that takes a GitHub issue, reads the codebase, writes a fix, and opens a PR. It's in production and users depend on it.
Phase 1: Catch critical failures
Your first priority is visibility into what's breaking. You define signals for the failures you care about most:
tool_call_failure - Did any tool call fail during this trace? Return the tool name and error message.
stuck_loop - Did the agent repeat the same action more than three times without progress?
empty_patch - Did the agent open a PR with no code changes?
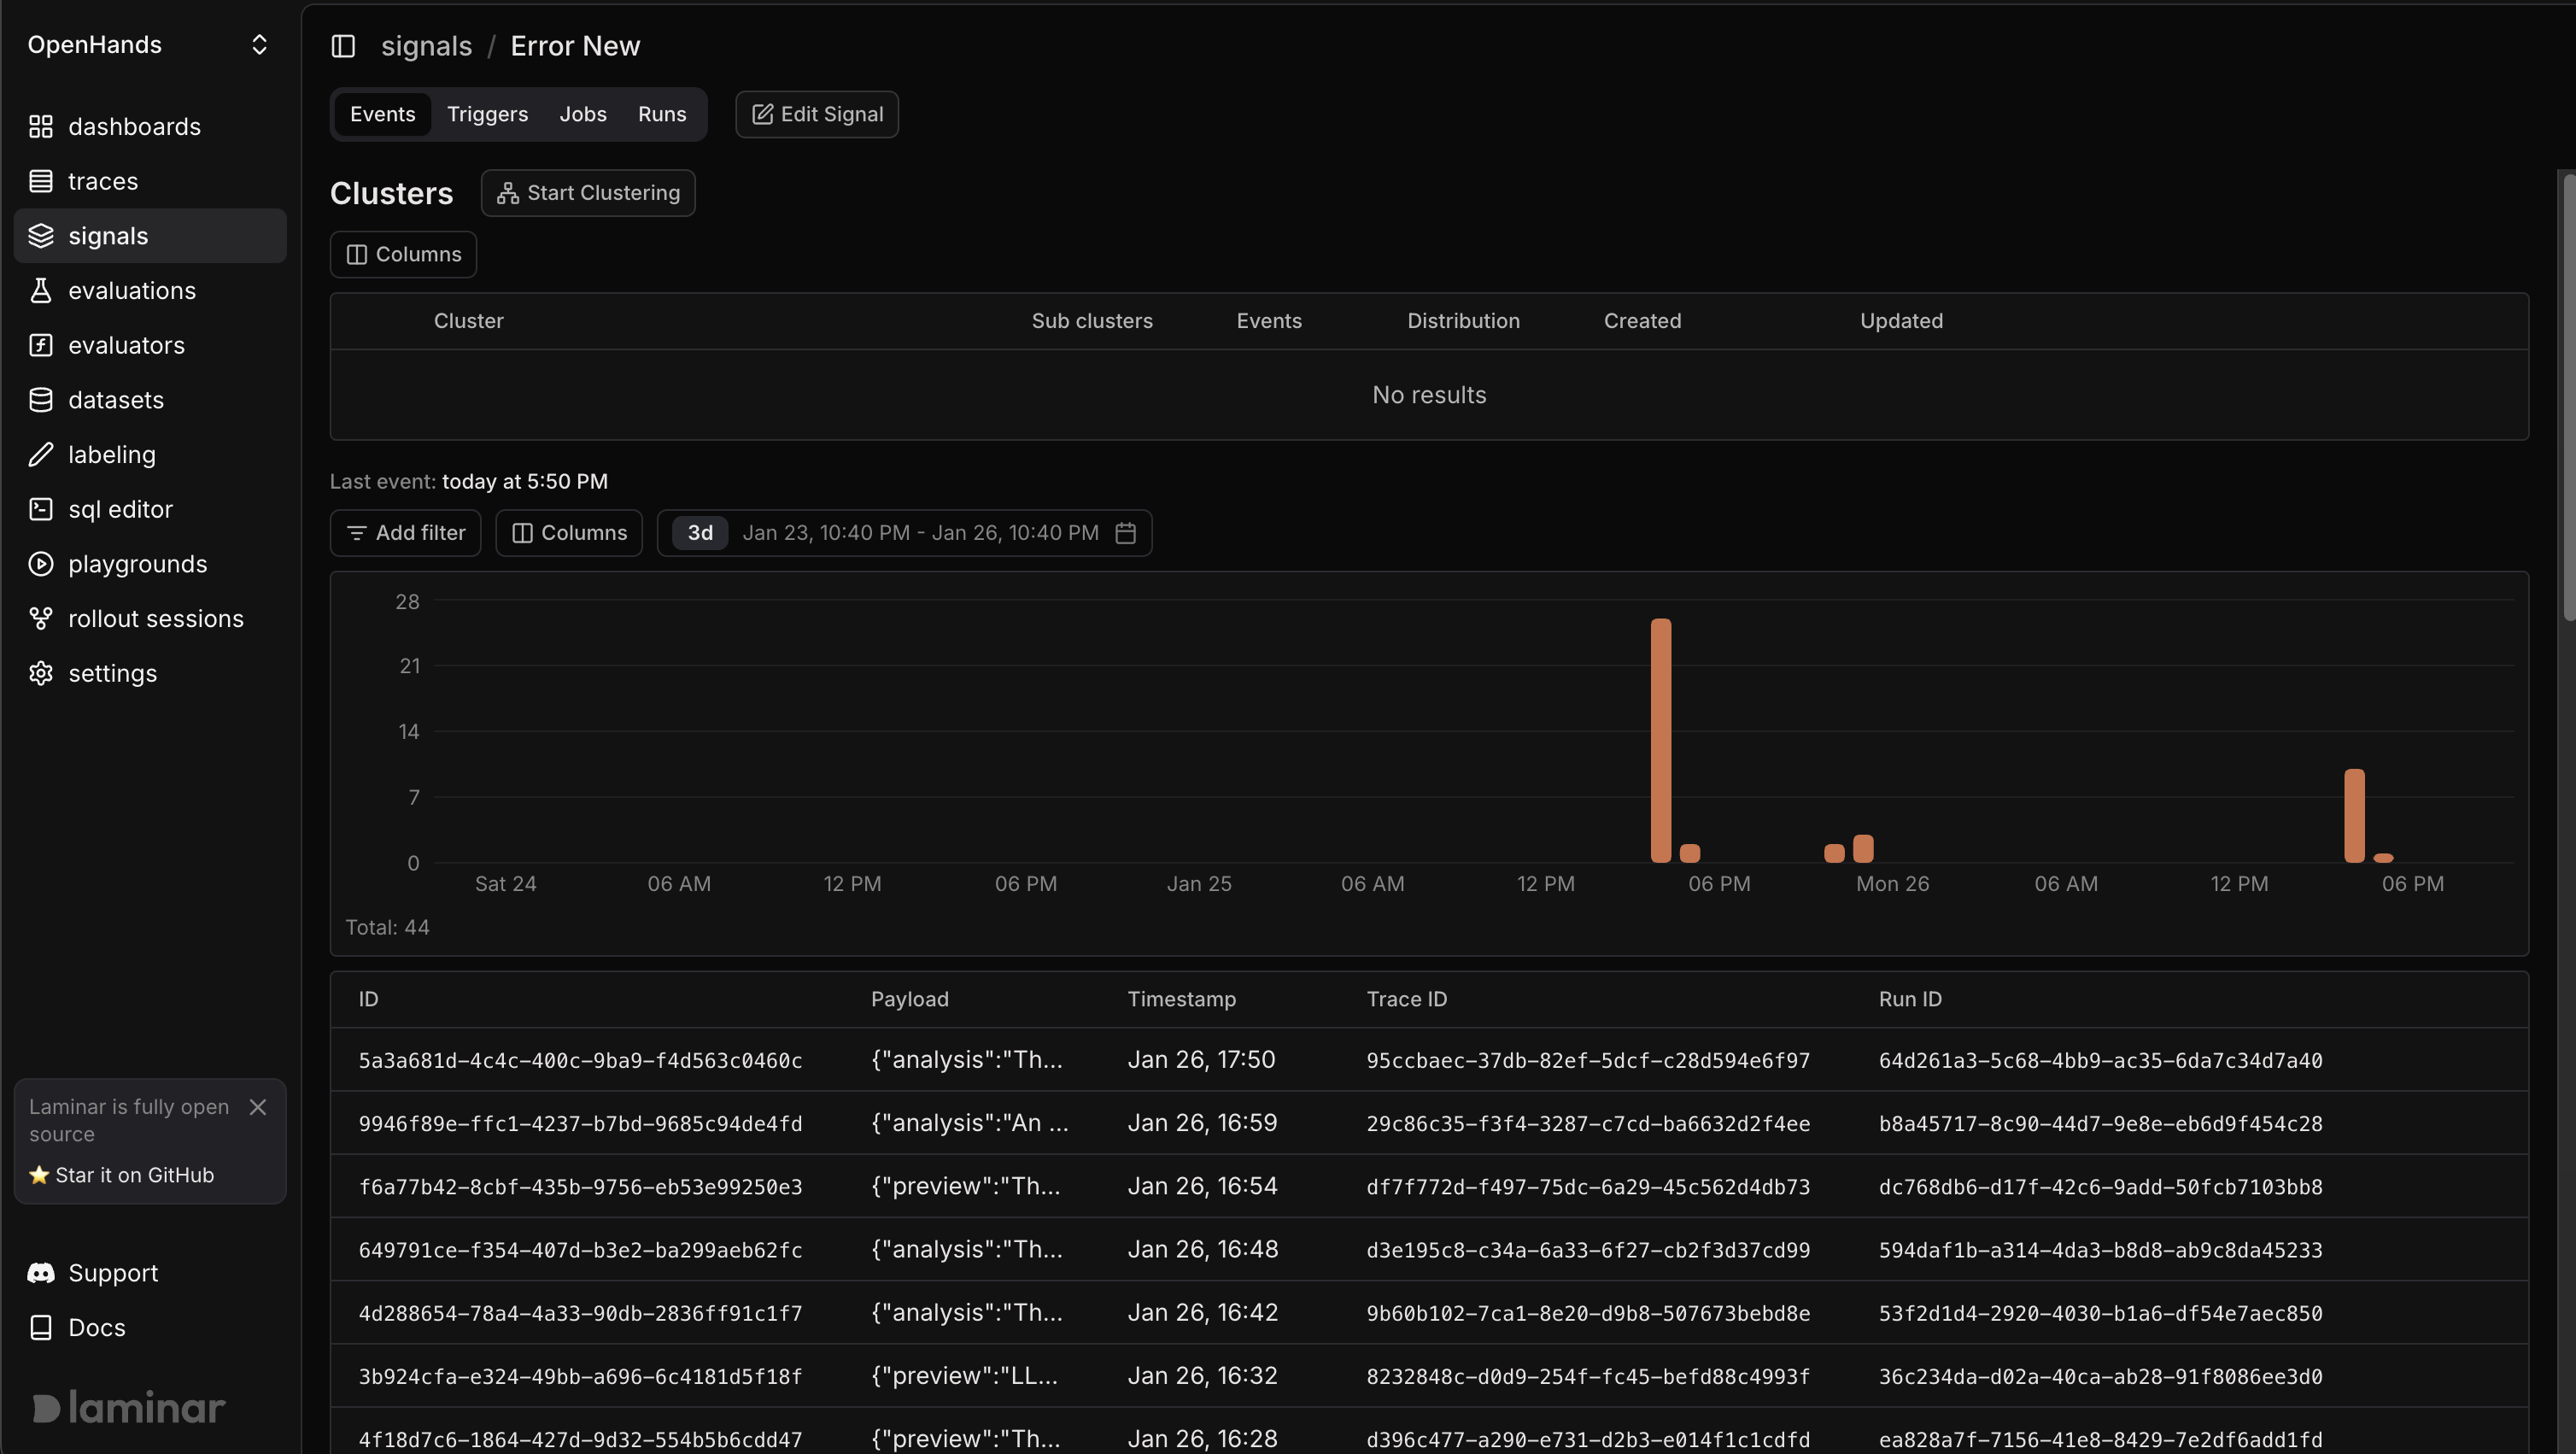
You set these signals to trigger on every new trace. When something goes wrong, you don't find out from users - you see it in your dashboard, clustered by failure type, with full trace context one click away. You can also connect Slack to get real-time notifications for signal events.
A week passes and the signals are firing. You're catching tool failures before users report them, and you fix a flaky API integration that was causing 12% of runs to fail silently. This is forward-looking observability: define what matters and catch it as it happens.
Phase 2: Optimize with historical analysis
The agent is stable now, but it's slow. Some runs take 10 minutes when they should take 2, and you want to understand why.
You need to analyze patterns across hundreds of traces you've already collected, so you define a new signal:
retrieval_efficiency - How many files did the agent retrieve before writing the patch? How many of those files were actually referenced in the final diff?
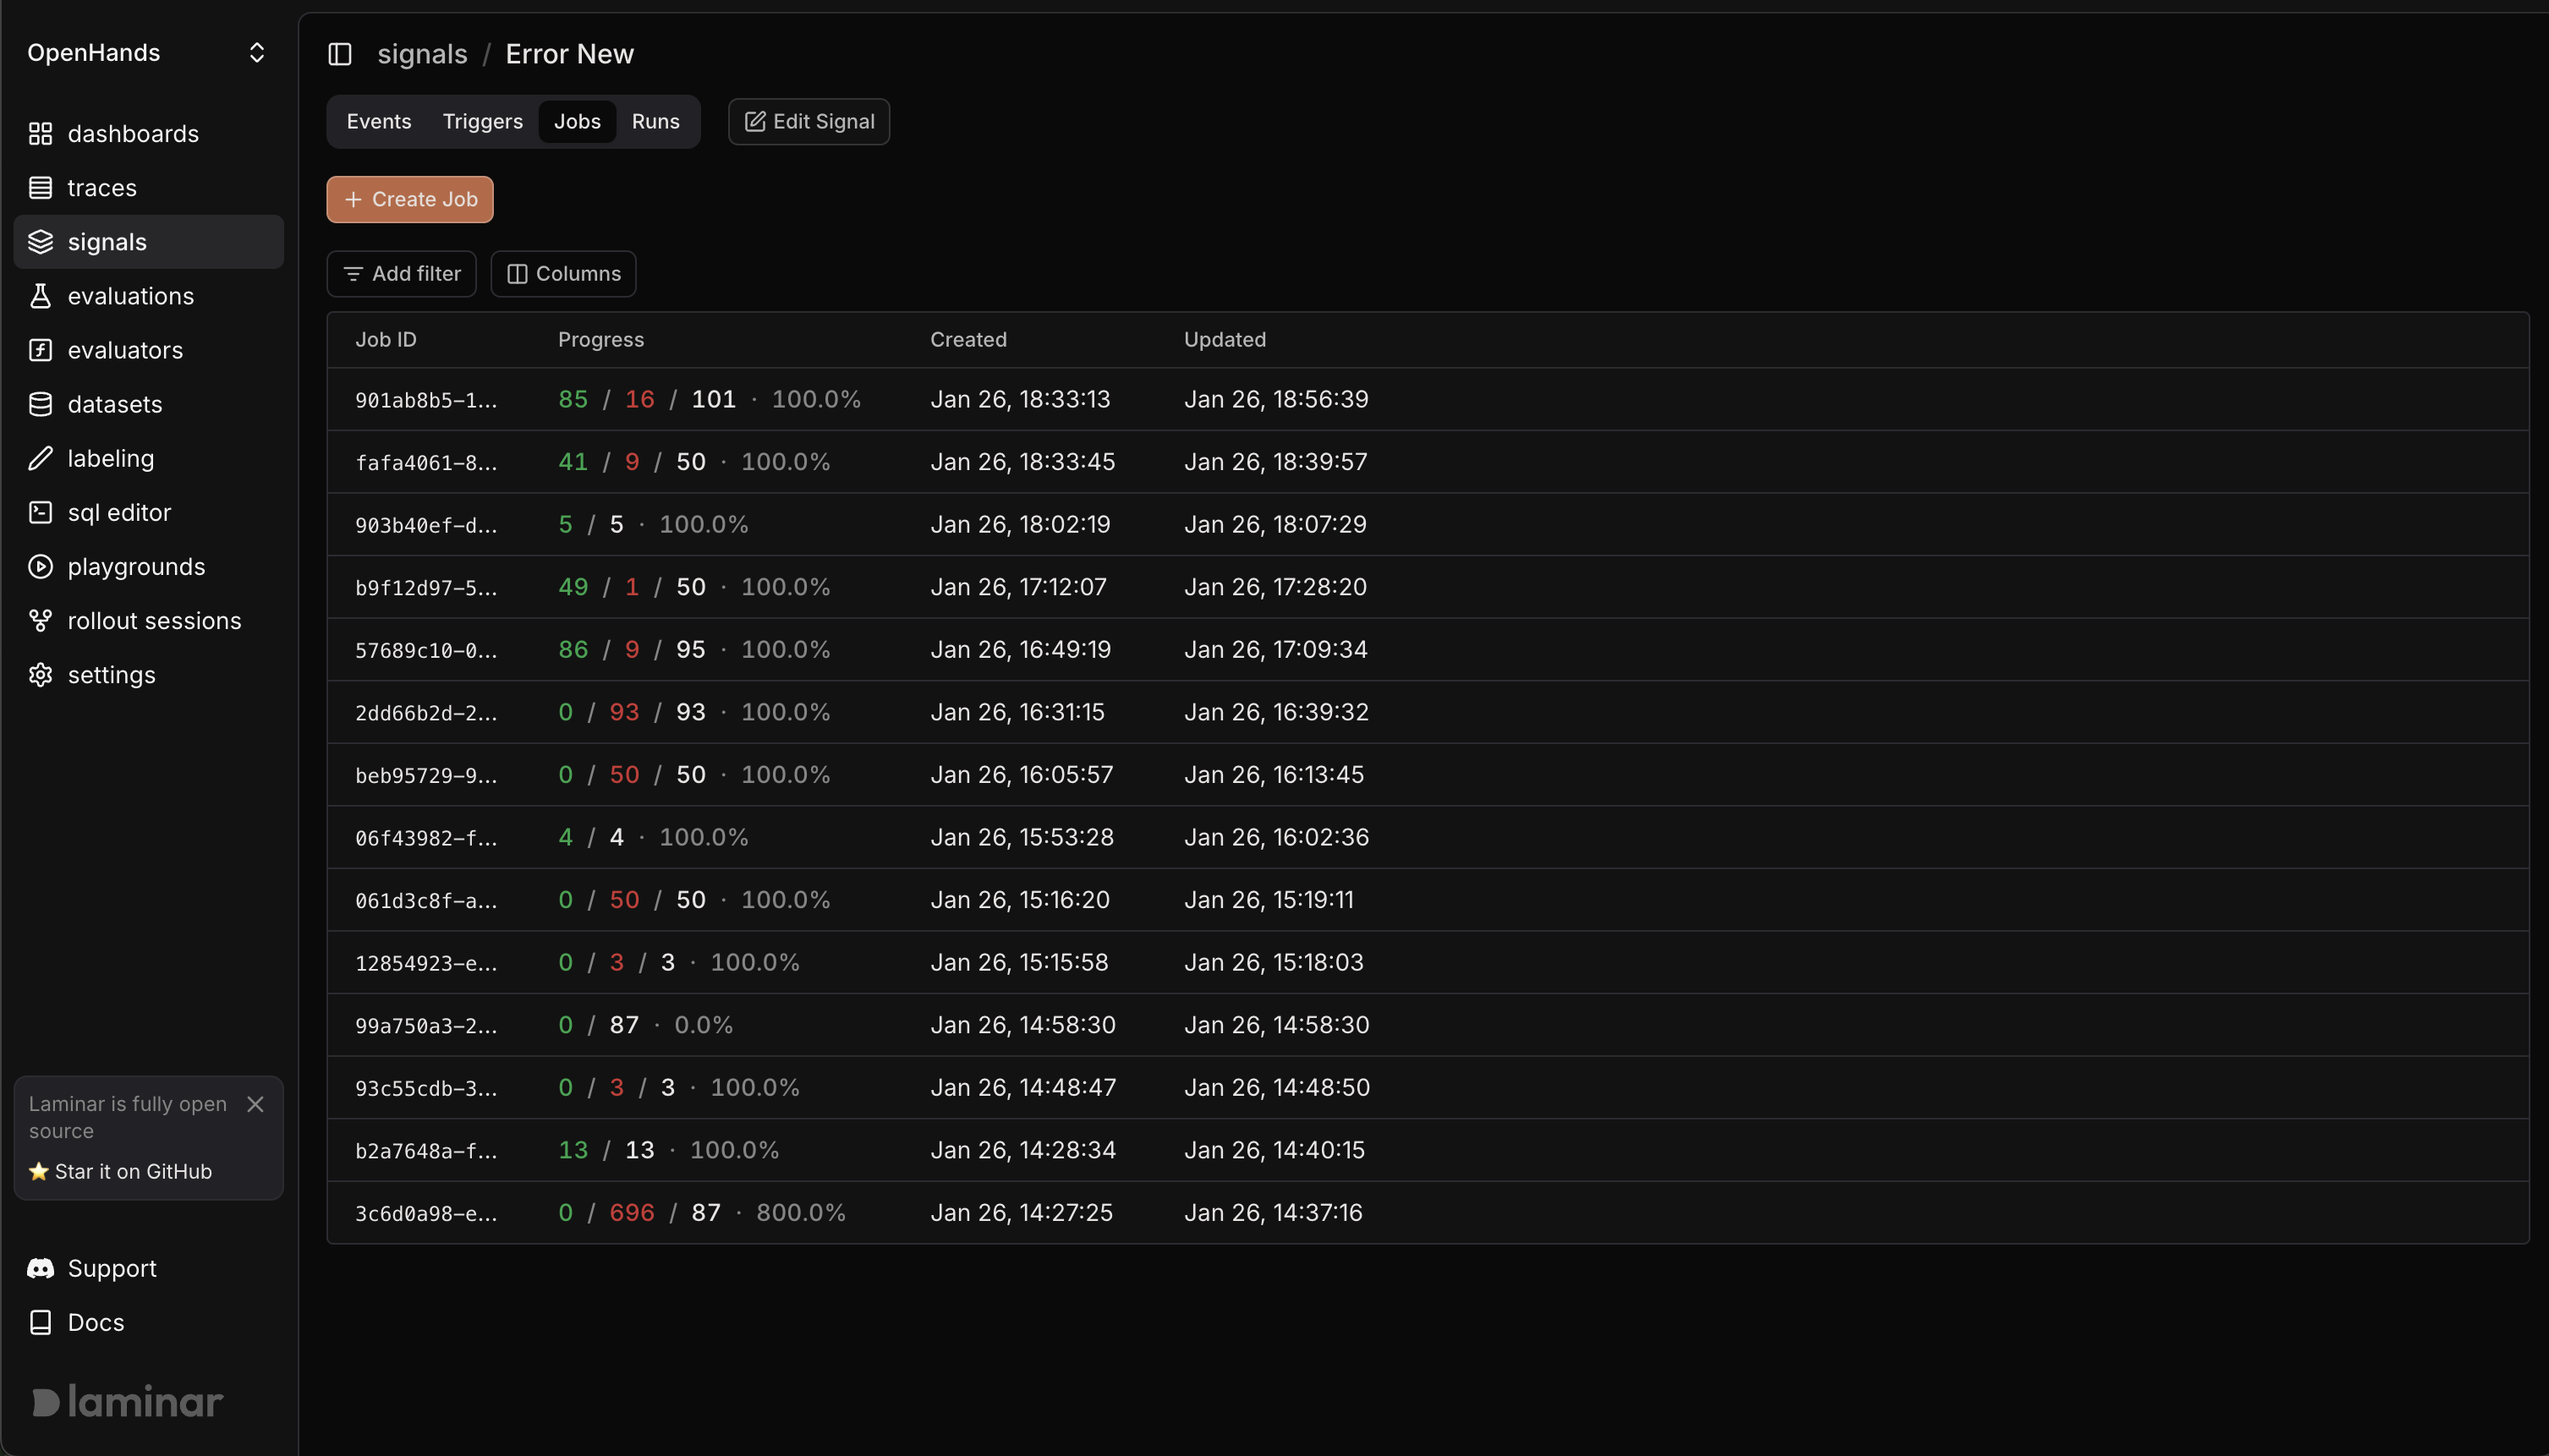
You run a backfill job across the last month of traces, selecting by time range and filtering to completed PR workflows. We built dedicated infrastructure for this, using Gemini's batch API for large-scale processing.
The results come back and you cluster by efficiency ratio. A clear pattern emerges: over-retrieval correlates with extra noise and longer generation times.
You adjust the retrieval prompt to be more selective, re-run the backfill on a sample, confirm that efficiency improves, and ship the change. This is retrospective analysis: asking new questions of traces you've already collected.
The full workflow
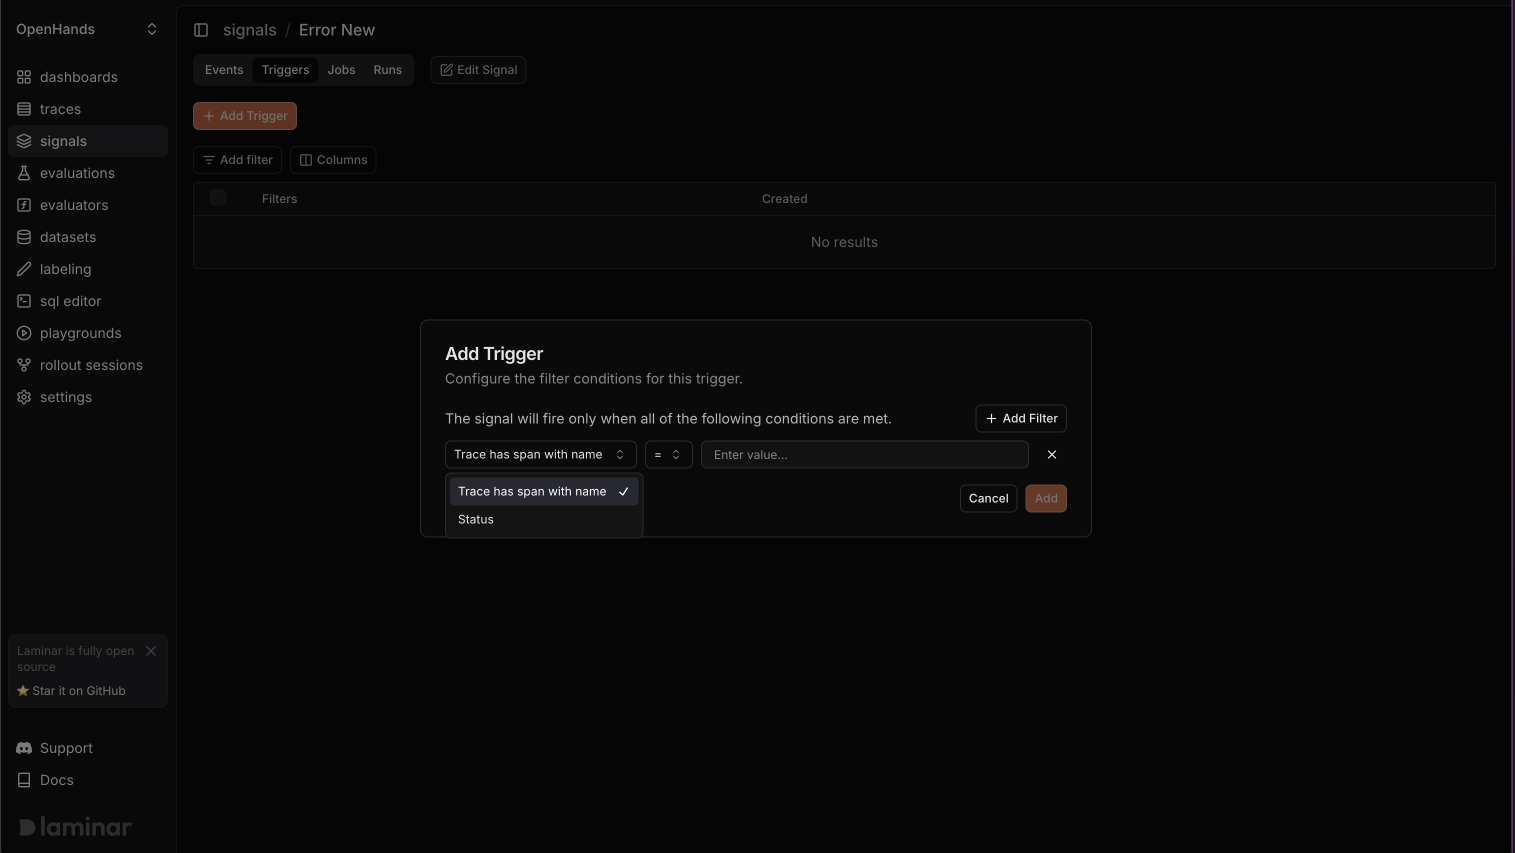
Signals support both modes. You can trigger on new traces for real-time monitoring to catch errors, track behaviors, and alert on anomalies. You can also backfill existing traces for historical analysis to investigate patterns, validate hypotheses, and measure improvements.
Every signal run is logged, so you see exactly which traces produced events and which didn't. Events can be clustered to surface patterns, exported to datasets for evaluation, or tracked over time to catch regressions.
Why this matters
You went from "the agent is in production" to "I catch every tool failure in real time" to "I identified a retrieval inefficiency that was slowing down 30% of runs." Same system, two modes, no custom scripts.
Signals make agent behavior searchable and actionable. Define the question once, then run it forward, backward, or both. Spend less time reading traces and more time improving what's inside them.
Get started
Signals is available now. Try it today and let us know what you think.
