
Your agent ran for 40 minutes and failed. You spend 20 minutes digging through logs, but still have no clue what went wrong. Now multiply that by a thousand runs in production, and you have a second problem: you don't even know which runs are failing, or what patterns are emerging across them.
We built Laminar to fix this. Today we're announcing our $3M seed round led by Atlantic.vc, with participation from Y Combinator, AAL.vc, and angels including Ben Sigelman (co-creator of OpenTelemetry) and Ant Wilson (CTO of Supabase).
Where existing tools fall short
Most observability platforms are, at their core, data collectors. They ingest traces and metrics, store them, and then leave it entirely up to you to figure out what's going on. You get a tree of spans. You click into one, read it, go back, click the next one, try to hold the context in your head. For an agent that ran for 30 minutes and made 200 decisions, this simply doesn't work.
What Laminar does
Instead of just collecting data and leaving you to make sense of it, Laminar actively helps you understand what happened in a single run, reproduce and fix it, and detect what's going wrong across thousands of runs in production.
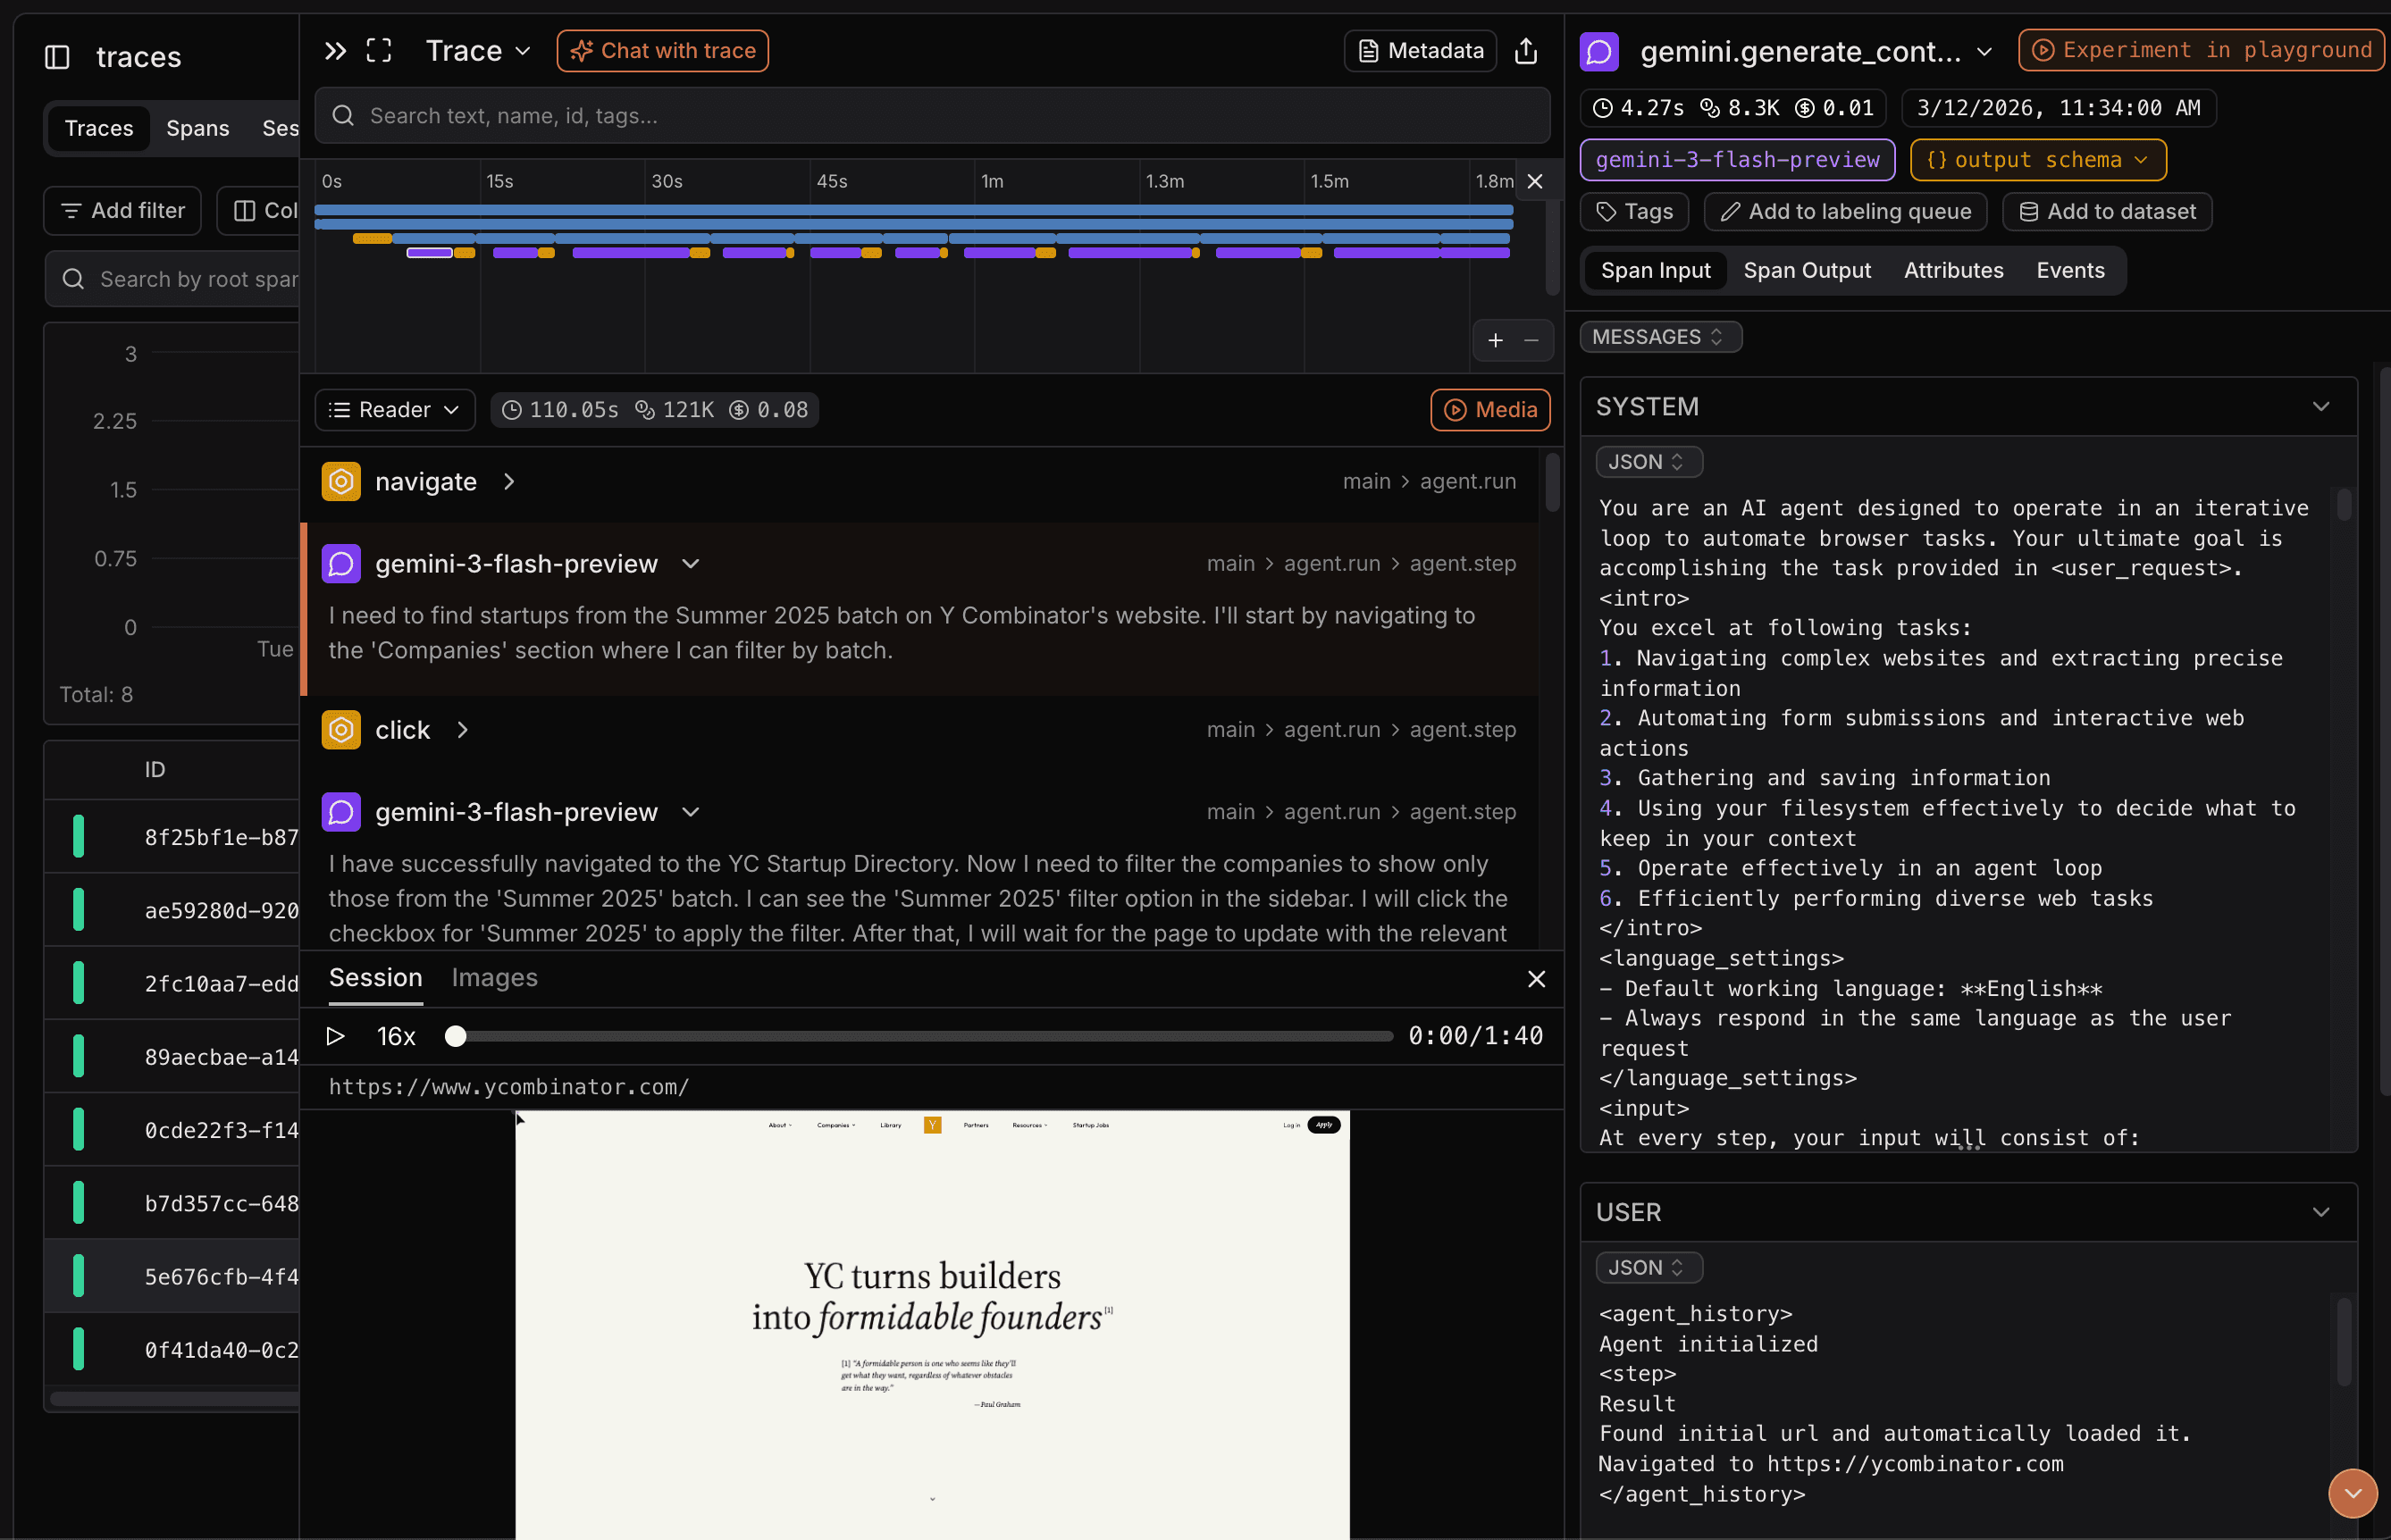
Tracing that actually helps you understand what happened.
With a single line of code, Laminar SDK auto-instruments the vast majority of AI frameworks and SDKs, including Claude Agent SDK, AI SDK, LiteLLM, Browser Use, Stagehand, OpenHands SDK, and more.
Laminar's tracing UI gives you as much information as quickly as possible. Our trace timeline and reader mode lay out the agent's reasoning and actions as a clean, readable feed, instead of tree of spans. For browser agents, we record full browser sessions synced with traces so you can see exactly what the agent saw at every step. If a trace is too complex to parse visually, you can chat with it in natural language instead of manually digging through hundreds of steps.
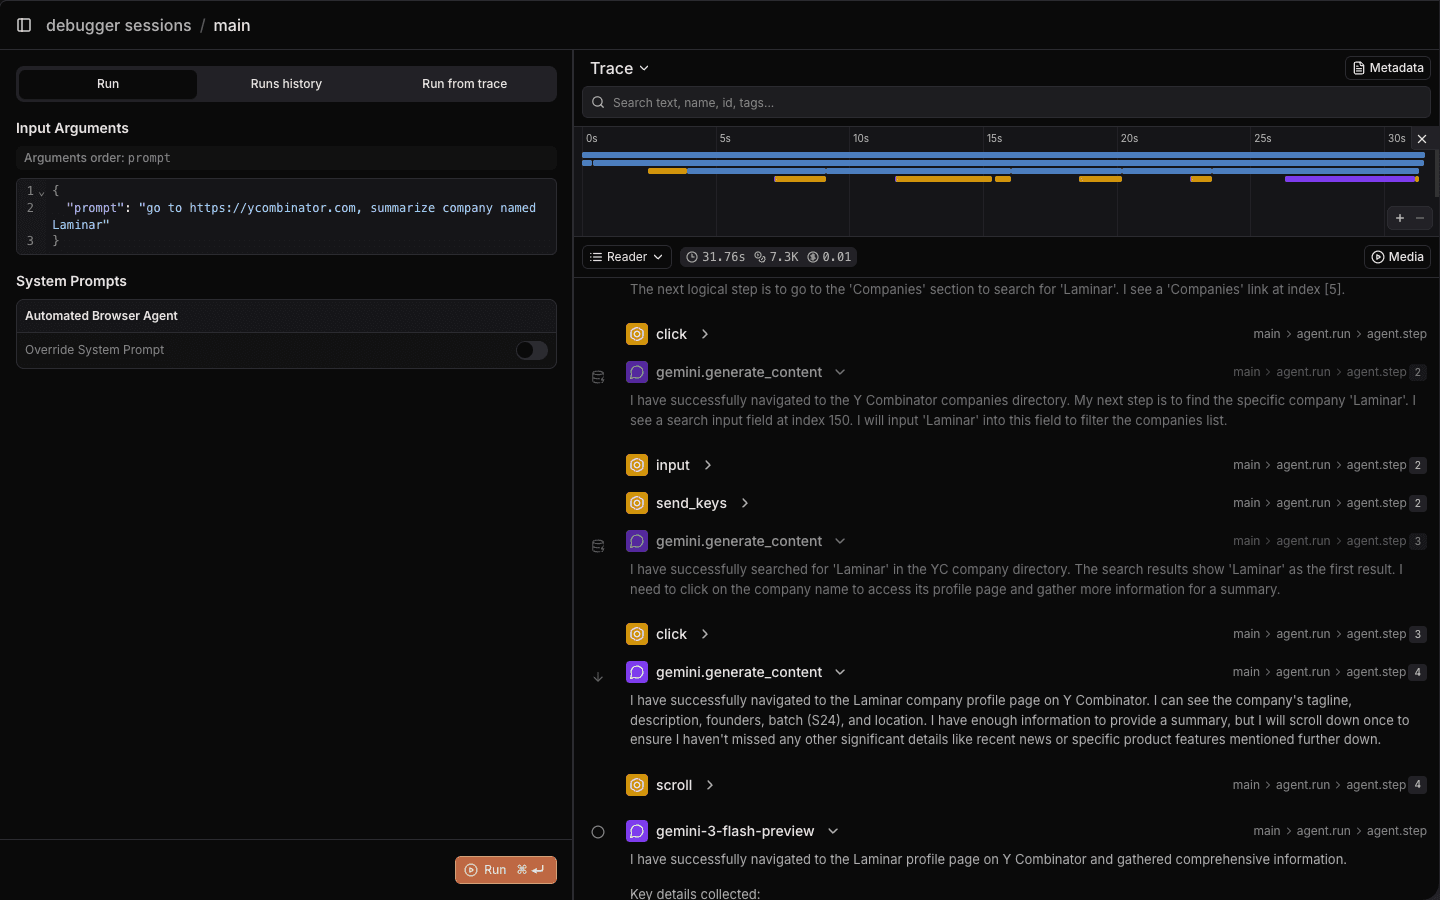
A debugger that doesn't make you start from scratch.
When your agent fails 15 minutes into a run, the normal workflow is: restart from scratch, wait for it to reach the same state, hope it reproduces the failure. Laminar's debugger lets you go to the exact step where things went wrong, tweak your prompt or tool definitions, and rerun from that step with full context preserved.
Under the hood, when you rerun from a step, we mock all prior LLM calls by replaying their original responses. The agent walks through its prior steps instantly without spending any tokens, and external state (browser DOM, sandbox environment, conversation history) is fully restored. By the time execution reaches your breakpoint, everything is exactly as it was.
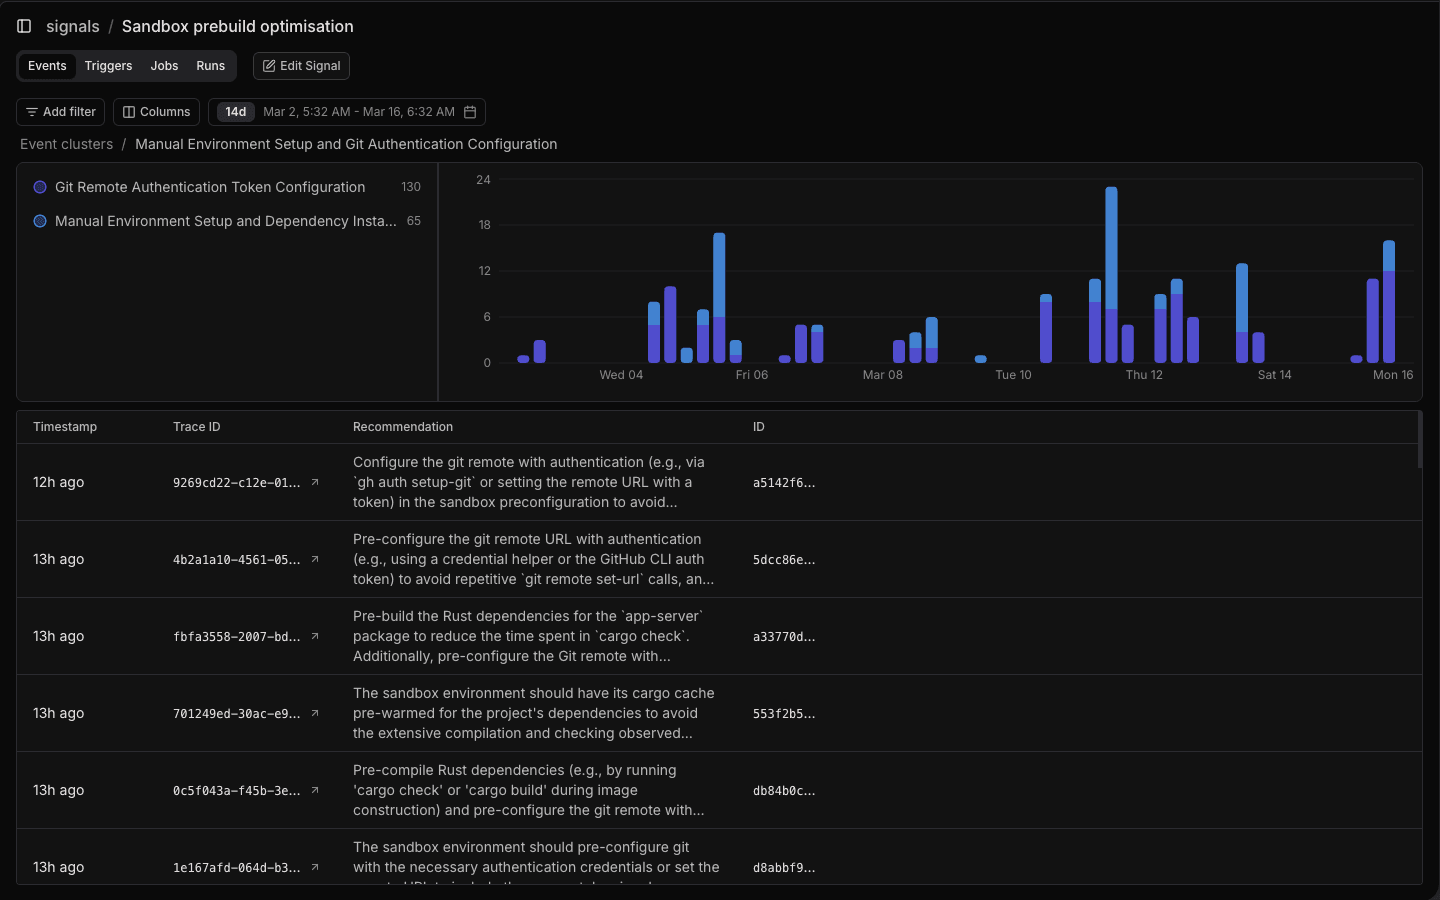
Signals
In production you have thousands of runs and the question is no longer "why did this run fail" but "what's going wrong across all my runs." With Signals, you can describe what you want to detect in natural language ("agent gets stuck in a retry loop," "user rephrases out of frustration") and Laminar extracts matching events from every trace, then clusters them into patterns.
All of your data is accessible through a built-in SQL editor, both in the UI and via API. Run arbitrary queries against your traces, spans, and events. Build custom dashboards, do ad-hoc analysis, or bulk-create datasets from production traces. Those datasets plug directly into our evals pipeline, so you can run evaluations on real production data.
Who's using it
Teams building some of the most complex agents in production rely on Laminar today, including Browser Use, OpenHands, Rye.com, Alai, LegionIntel, and many more.
Try it
Laminar is fully open source and extremely fast (written in Rust). Self-host it anywhere:
git clone https://github.com/lmnr-ai/lmnr
cd lmnr
docker compose up -d
Or sign up on our managed platform and start tracing in under a minute.