
Agents are just LLM calls in a loop. Each step appends the model's response (typically JSON with tool calls) and the resulting tool outputs to the message history array. On the next iteration, the entire accumulated array goes back to the LLM API as input. The model is stateless. The array is the state. (OpenAI's Responses API moves this server-side, but the shape is the same.)
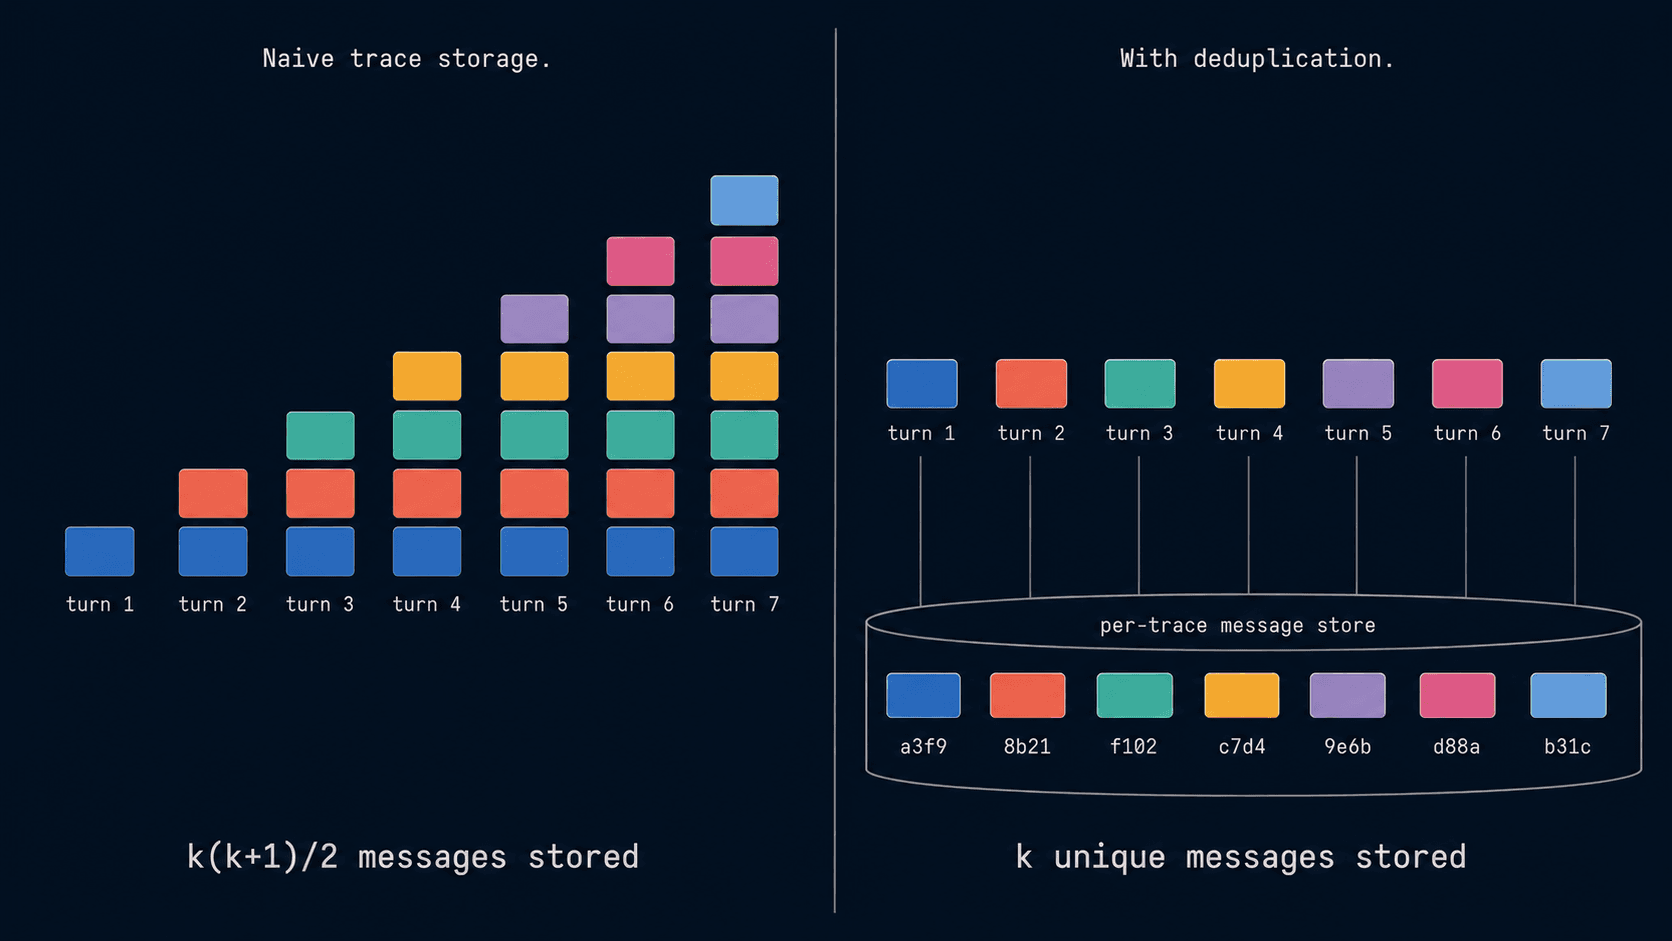
This means every LLM call carries every prior message. On turn k you send k messages. Observability platforms built for LLMs capture the input to every LLM call, so every span stores the full history up to that point. Across a k-turn run, you've stored 1 + 2 + 3 + … + k = k(k+1)/2 messages where only k are unique. Storage and bill both scale as k²! So, the explosion in agent traces size actually comes primarily from storage of duplicate data.
The fix is trivial: don't store the duplicate messages, reconstruct full message history at query time. This is exactly what we did at Laminar. It took us some time to figure out how to do it elegantly, but now our trace storage scales linearly with unique content per trace. It saved 20x in storage (for customers with very long running agents like OpenHands it reduced data usage by 50x!) on average for our customers and significantly improved our ingestion speeds.
The cost at realistic k
If turns are roughly balanced in size:
total_bytes ≈ message_size × k × (k + 1) / 2
A 10-turn agent writes 55 messages for 10 unique. A 30-turn agent writes 465 for 30. A 50-turn agent writes 1,275. Doubling the run quadruples the storage.
100+ turn runs are routine now: research agents, coding agents, multi-hop browser use. These are the runs where debugging matters most. They're also where naive storage hurts most.
The bound
One LLM call has a bounded input. Three pieces:
- System and user messages. Whatever the developer wrote. Usually small.
- Assistant messages. Capped by max output tokens, around 128k today, so ~500 KB at the limit. Reasoning models with long thinking actually approach it.
- Tool results. Unbounded in principle, clipped in practice because a 200 KB tool result eats 50k tokens from every subsequent turn's context.
The whole array fits in the model's context window. Frontier is 1M tokens today. Once running context crosses ~80%, many agent frameworks compress history: summarize older turns, drop noisy tool outputs, hand off to a subagent, so the practical ceiling on one LLM span's input is 0.8 × context_window, about 3.2 MB of JSON.
Without dedup, a 50-turn trace approaching that ceiling writes around 160 MB; 98% of those bytes are the same bytes logged 50 times. With dedup, the trace can't exceed one span's ceiling. Unique content can't exceed what fits in one span.
Dedup turns O(k²) into O(context_window).
Agent trace compression
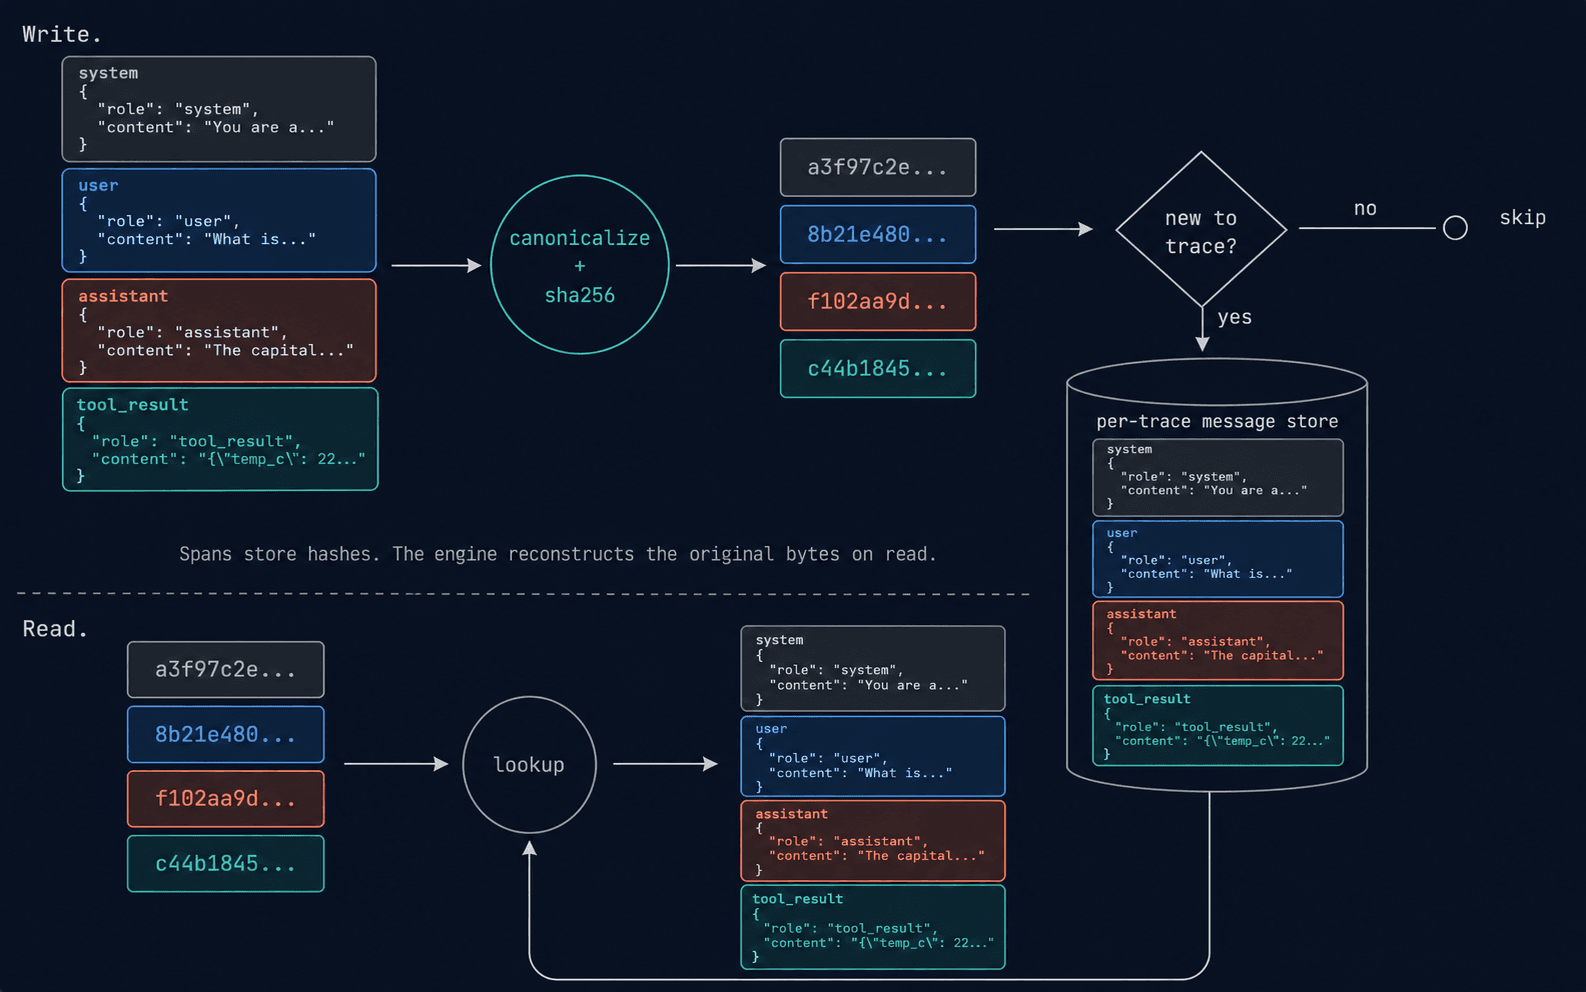
Messages in an LLM trace have two properties that make content addressing fit cleanly: they're immutable once written, and they recur identically across spans. Our approach is to hash every message (canonical JSON, so two payloads differing only in object field order collapse to the same hash) and store each unique message once per trace. The span instead stores a compact array of 32-byte hashes.
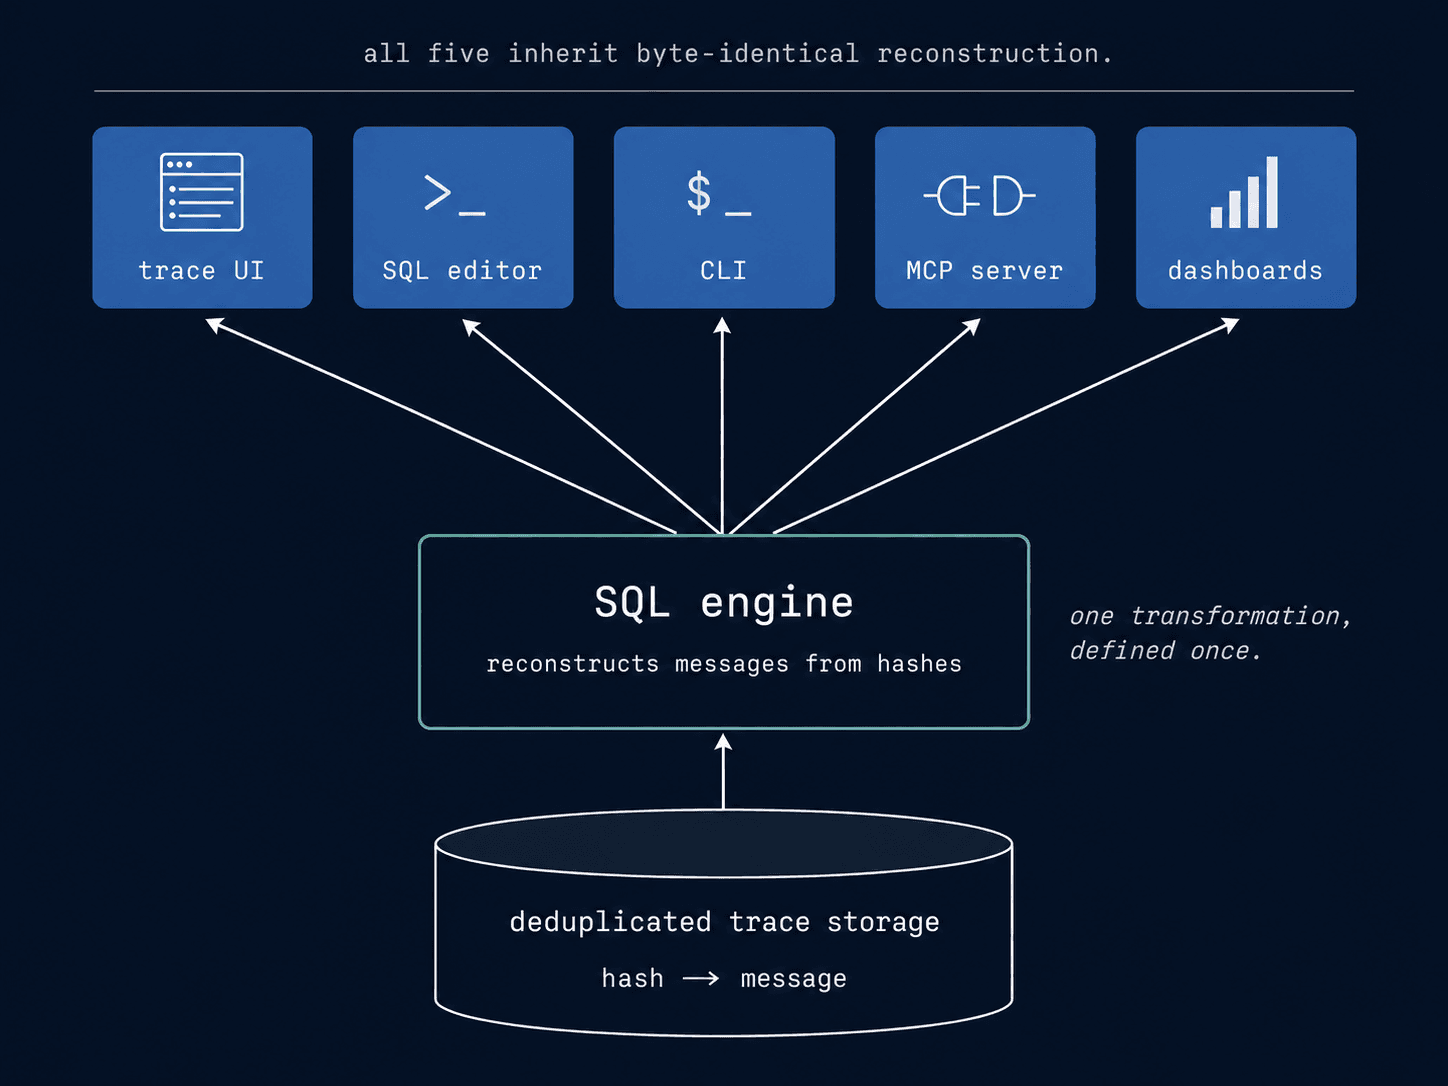
On read, Laminar reconstructs the original input array byte-identical to what the non-deduped path would have returned. It happens at the level of our SQL engine, which is the key why our reconstruction works seamlessly. Downstream consumers: UI, API, MPC, CLI all get data via this engine.
On realistic long-running agents we see data reduction ratio of 5-10x. On a 50-turn coding agent with a stable system prompt and long tool outputs, it approaches 50x.
The edges
Identity vs. representation. {"role": "user", "content": "hi"} and {"content": "hi", "role": "user"} are the same message and have to hash the same. The JSON you hand back on read has to be byte-identical to what instrumentation sent: field order, escaping, whitespace. We hash a sorted canonical form and store the original-order form. Two cheap walks of the JSON, one invariant each.
Trace-scoped, not project-scoped. A system prompt appearing in 10,000 traces is still stored once per trace. A project-scoped dictionary on a busy tenant gets big fast, and the hot query pattern is "fetch one trace," not "scan everything." Trace-scope gets 95%+ of the value (agents loop within a trace) without cross-trace coordination. It also makes query for the reconstruction significantly faster. However, we're working on a solution to make message deduplication project-wide.
One read path, every surface
Every developer surface on Laminar goes through our SQL engine: transcript view, SQL editor, CLI, Dashboards, MCP server. Landing dedup meant writing one reconstruction layer, not five.
Without going too much into details, at the very core, we achieved very fast reconstructing by utilizing Dictionary primitive of Clickhouse, which allowed for extremely fast joins in Clickhouse views. So combining our unified data access approach with this idea, we achieved full reconstruction and almost zero additional latency cost and 0 need to modify downstream code. The whole architecture can be described in 2 sentences, but it took us many months to consolidate everything properly.
This matters more next year
Three things are growing at once.
Context windows grew from 200k to 1M in the last 12 months. 2M+ is on public roadmaps. Every doubling doubles the per-span ceiling.
Output tokens grew with reasoning models. Long thinking traces produce tens of thousands of assistant tokens, replayed on every subsequent turn until compression.
Loop length grew. Coding agents at 100+ turns are normal. Browser agents do 80 actions across 40 pages. Research agents fan out to 10 subagents and synthesize for hours.
Doubling the context window and doubling loop length is a 4x storage hit before anything else changes. Both are happening.
Every agent tracing product on the market pays this tax today, in full, on every long-running trace. Open one of your longest traces, check the size of the messages array on the last LLM span, multiply by the number of turns. That's the bill.
Trace size isn't a back-office concern. It's the reason your debugger is slow, your bill keeps climbing, and your retention window is 7 days instead of 90.
Laminar's storage scales with unique content per trace. You don't configure anything. You don't opt in. You send traces, and they scale linearly, instead of quadratically as your agent runs.
Try it
If you're running long running agents in production and your current observability provider bill has grown out of proportion, try Laminar! It is open source and easy to self-host: github.com/lmnr-ai/lmnr. And It takes one line of code to start sending traces on all modern agent frameworks and provider SDKs, read more in our docs.