
Everyone in AI agent Twitter tells you to look at your traces. Nobody really tells you how.
The default answer is "open the span tree." That works for backend traces, where requests are linear and you mostly care about latency, error rate, and payloads. An agent run is a conversation with side effects: plan, call a tool, react, spawn a subagent, synthesize, plan again. The content is mostly text: model reasoning, subagent prompts, tool outputs. Reading that as a flame graph indexed by latency is most of the reason people sit down with a two-thousand-span trace and feel like they're getting nothing out of it.
So we built Laminar's trace viewer around how you actually read agent traces, instead of around how the spans happen to be stored.
Transcript view
At the core, an agent is a simple while loop: LLM call, tool call, LLM call, tool call, until a final answer. Complexity shows up when a tool call spawns another agent, but the spine of any trace is that loop, in order.
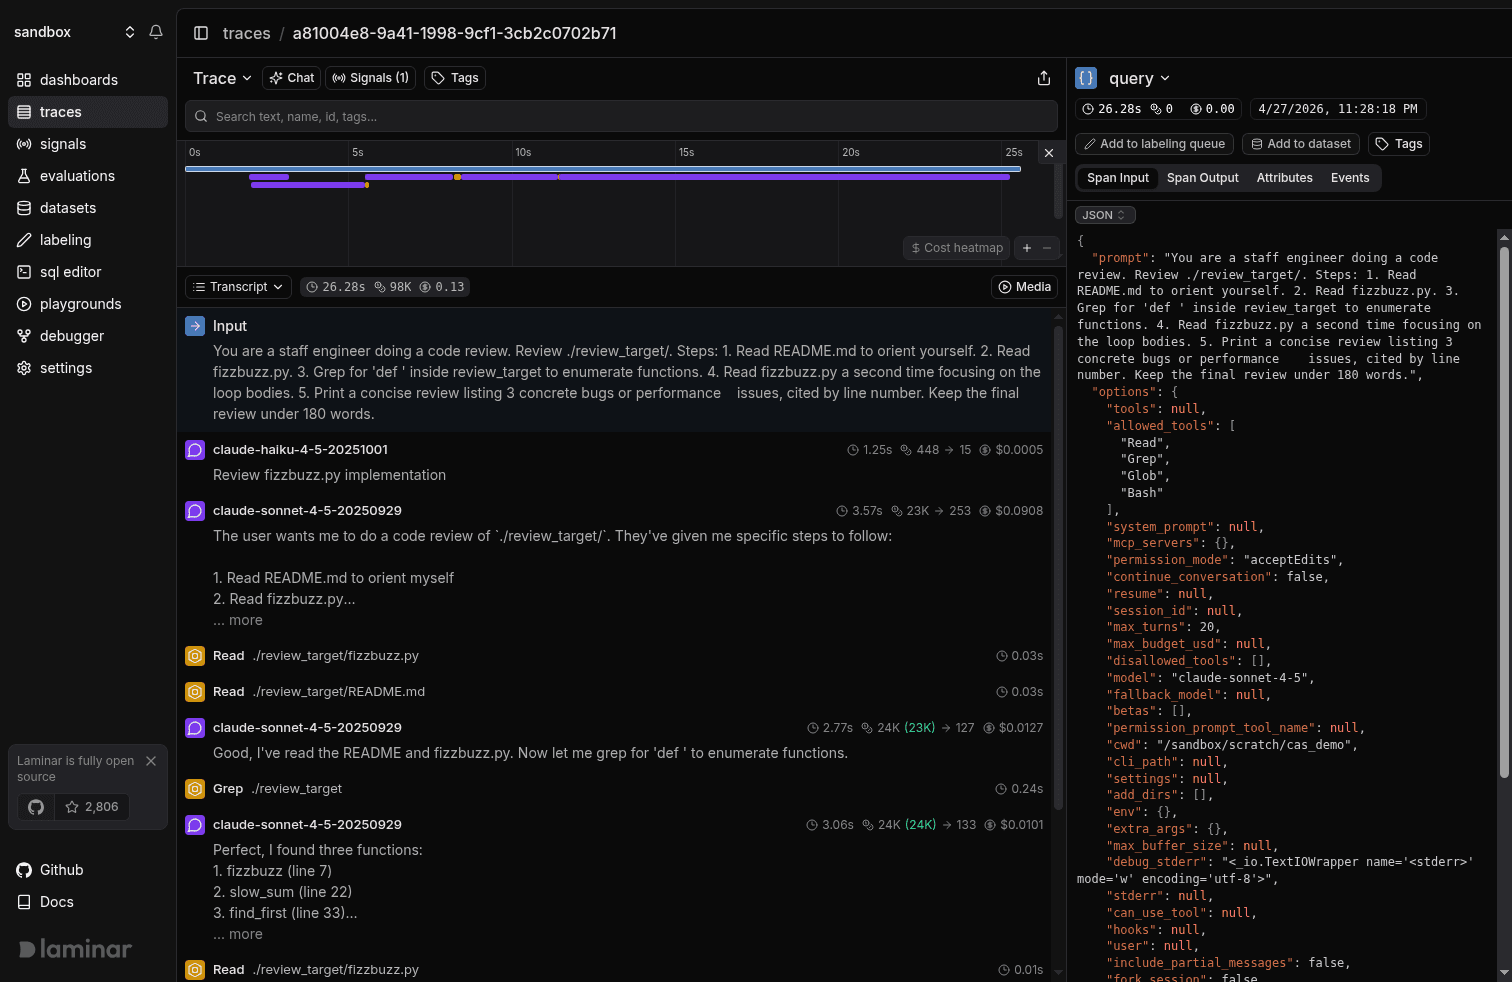
That sequence is what we mean by transcript. The view exposes the loop directly, with the model's reasoning surfaced right next to the tool call it produced. When you're debugging an agent, the question is almost always "why did it call this tool here," and the answer lives in the model's thinking on the LLM turn that came just before. In a span tree view, that thinking is buried inside an attribute on the LLM span. By the time you've clicked through a few spans to reconstruct what the agent was thinking across turns, you've lost track of where you were in the trace. In the transcript, the thought sits right above the tool call, and you read the loop straight through.
Every tool call also gets a one-line preview rendered next to it from its arguments. "Read /sandbox/scratch/cas_demo/data/events.csv." "Edit fizzbuzz.py." "Grep def .*." On a 200-tool-call trace you can skim the loop like a log file.
The tree view is still in the dropdown and still the right thing sometimes, mostly when you're debugging span nesting itself: a custom observe wrapping a server-side turn, a custom MCP tool with its own child spans, a specific attribute on a middleware span. For everything else, the loop and the reasoning that drives it are what you're actually trying to read, and that's what the transcript is for.
A timeline strip sits above all of this, and it gives you the shape of the run before you've read anything.
It renders the whole run as colored bars on a single time axis. Summing three subagents' wall times tells you nothing about whether they ran in parallel or one after another, and a tree view can't show you parallelism without a lot of branch expansion and arithmetic. The timeline shows it directly: a Promise.all-style fan-out of subagents starts as three bars at the same x-coordinate, while a serialization bug stair-steps. The longest bar on the page is your tall pole, and clicking it jumps you to the span. Erroring spans are color-coded, so you can see which ones failed without reading anything and click straight to them. A long gap between a tool returning and the next LLM turn is usually a framework hop you didn't expect: a retry, a queue, middleware.
The strip is synced with the transcript in both directions. As you scroll, a gray rectangle on the timeline tracks the spans currently in your viewport, so you always know where you are in the run. Drag on the timeline to filter the transcript to a range. Cmd+scroll zooms on the cursor. The viewing traces docs have the rest.
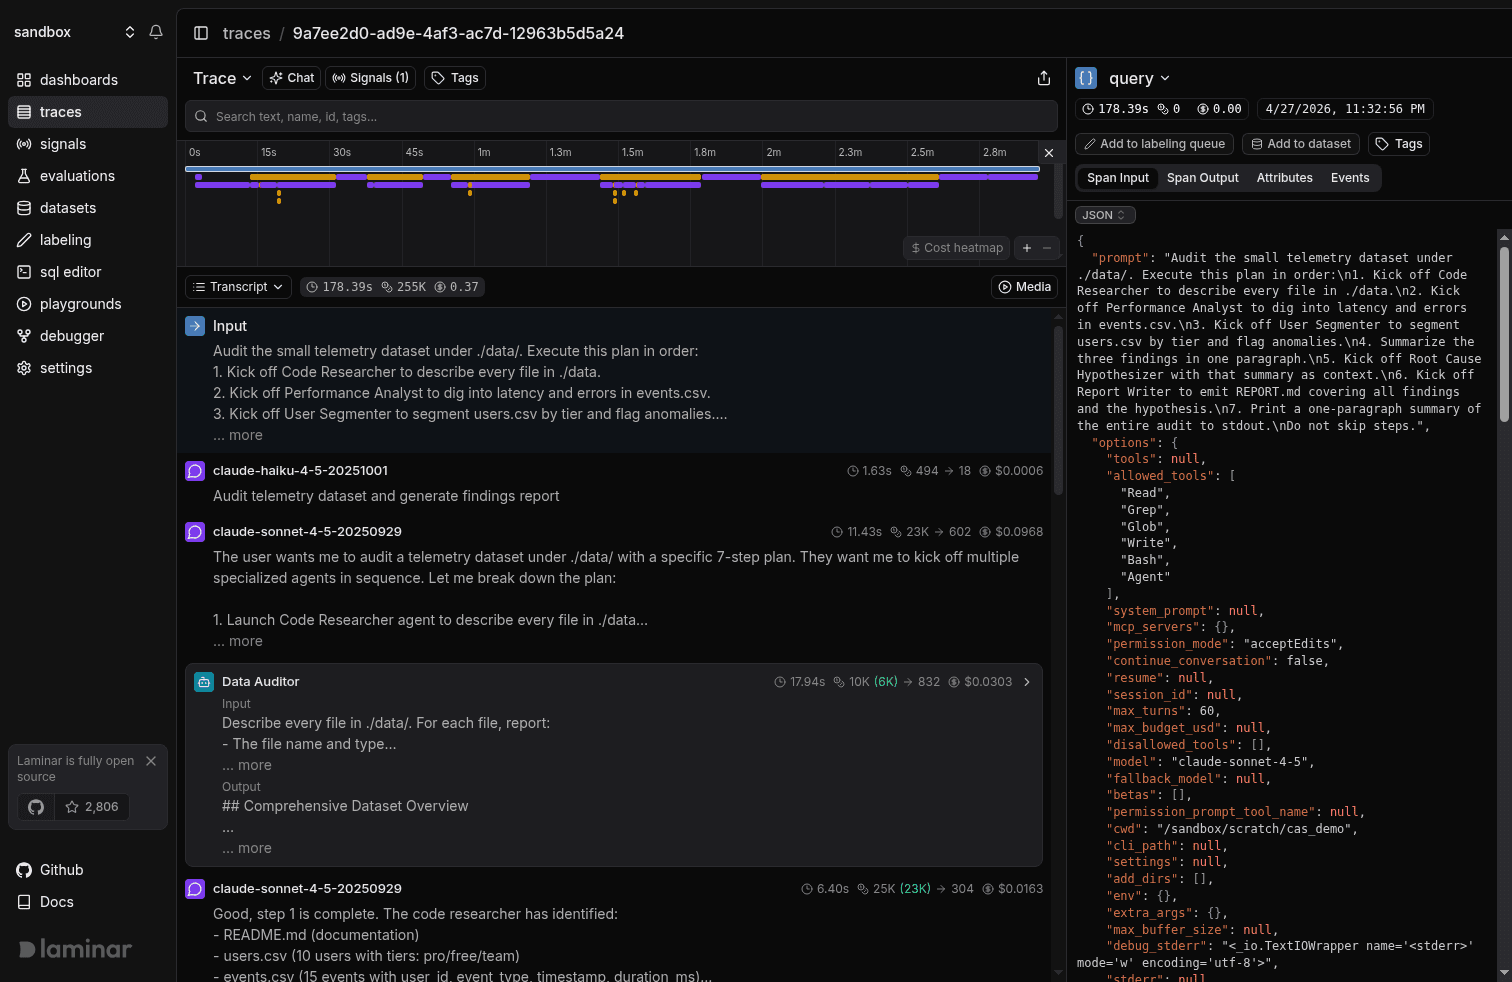
Subagents are cards
Once a tool call spawns another agent, the trace gets considerably busier. A six-subagent run rendered as a tree is a wall: orchestrator's LLM turn, then the first subagent's turn, its tool call, a retry, the second subagent's turn, and on. Everything indented at roughly the same depth, everything the same color, with the thing you actually want somewhere in the middle.

Laminar recognizes each subagent invocation, collapses its entire subtree into one card, and pulls the card's name from the invocation's intent. Six fan-outs render as six cards. You scan the cards, click into the one that looks wrong, read its inner loop the same way you read the outer one, close it, and keep going. Nothing else in the trace moves while you're inside a card, and the orchestrator's scroll position holds.
Once your agents fan out to six or ten subagents per run, which is normal in real codebases, this is the only layout that scales to skim-and-dig reading.
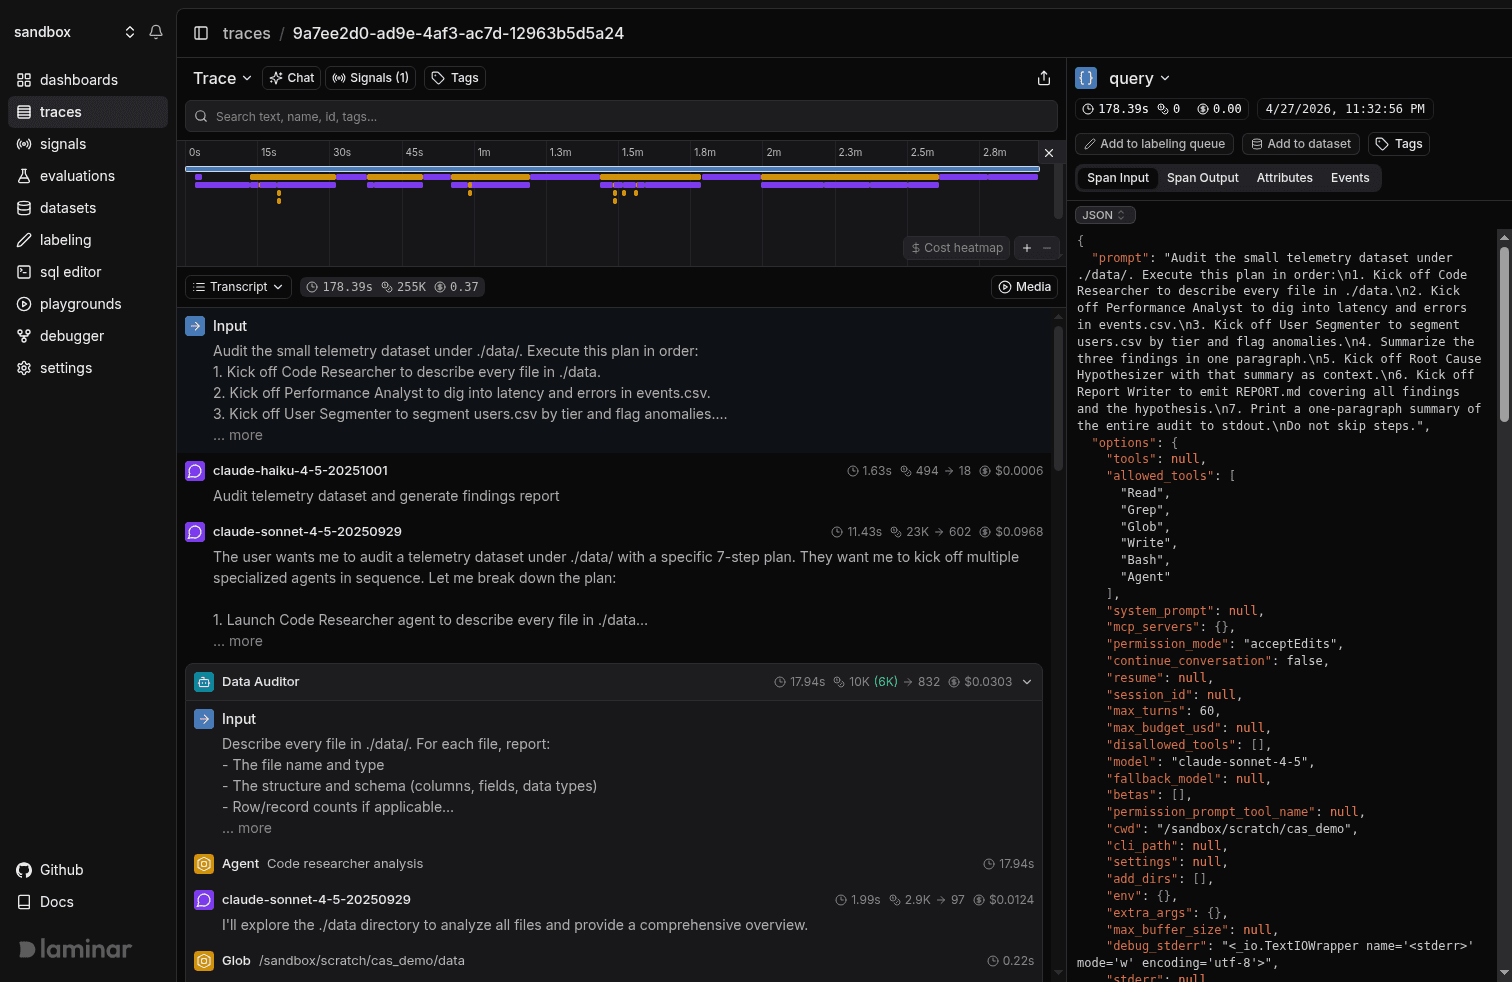
Inputs to every agent and subagent are surfaced for free
The other thing that matters about transcript view is that you don't have to do anything to make it useful.
Laminar parses the span tree and pulls out the input to the root call and the input to each subagent automatically. There's no extra attribute to set, no wrapper span you forgot to add, no "prompt" field you meant to record and didn't. You send OpenTelemetry spans from the Claude Agent SDK (or any other framework we cover) and the transcript already knows what the human asked the orchestrator and what the orchestrator asked each subagent. In a tree view that input is buried inside an attribute on the invoking LLM call, three expansions deep. In the transcript it's the first line of the subagent's card.
That sounds minor until you come back to a trace a week later and try to remember where you stuffed the prompt.
Chat with trace
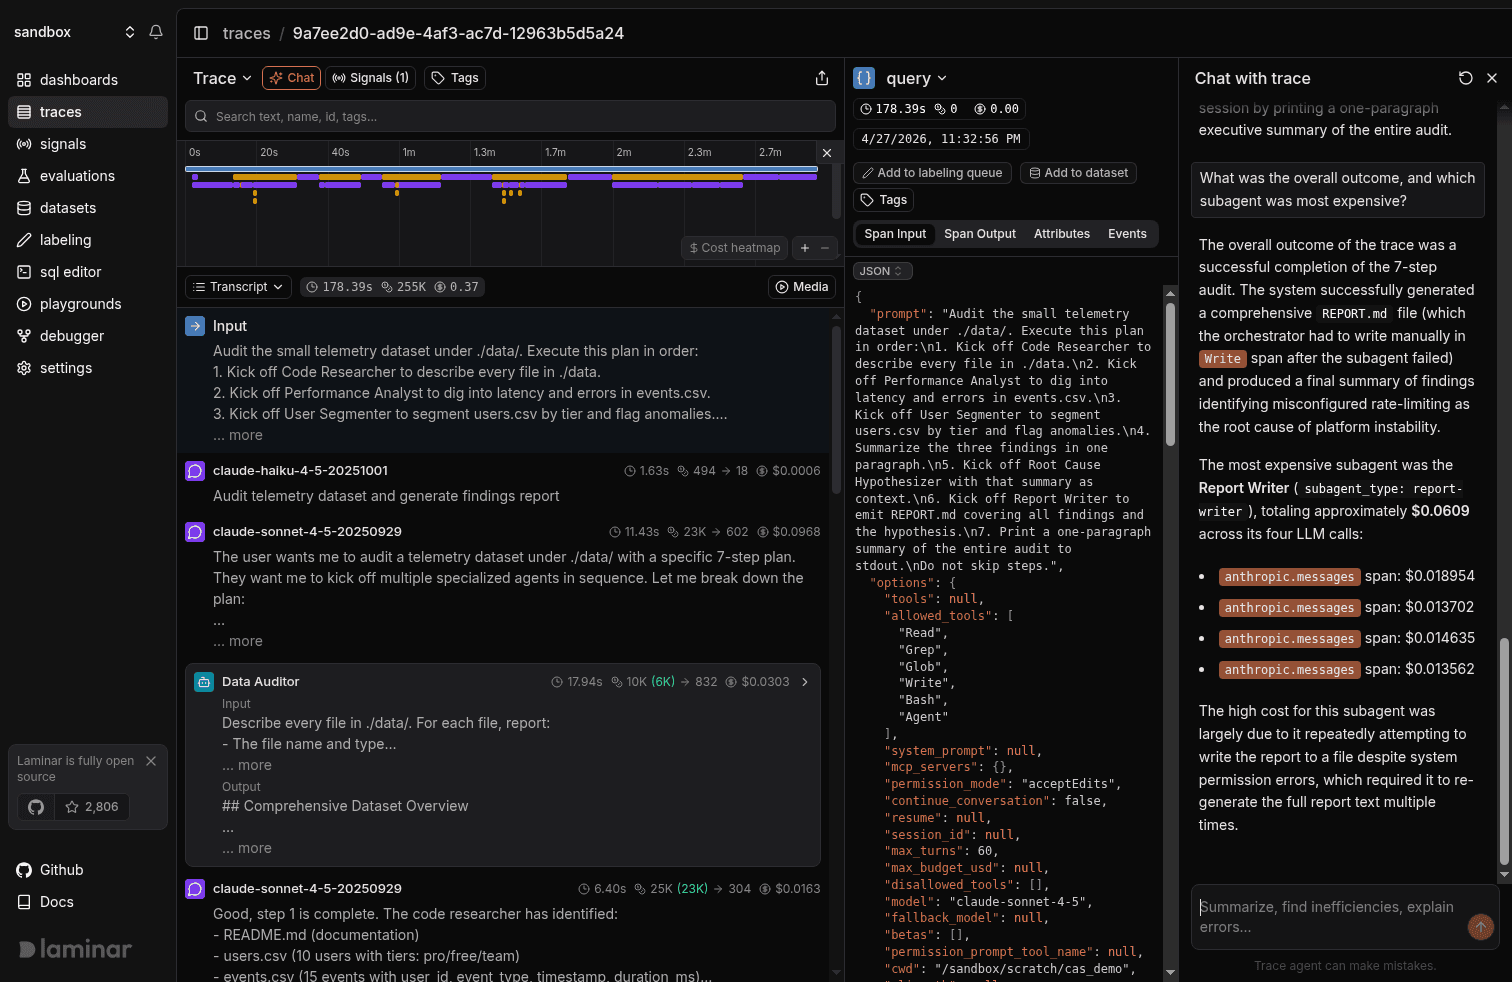
That gets you through most traces. When you have a specific question that scanning won't answer, click the Chat button in the trace view header and a pane slides in on the right. It auto-summarizes the run, then waits for a question in plain English.
Which subagent was slowest and why?
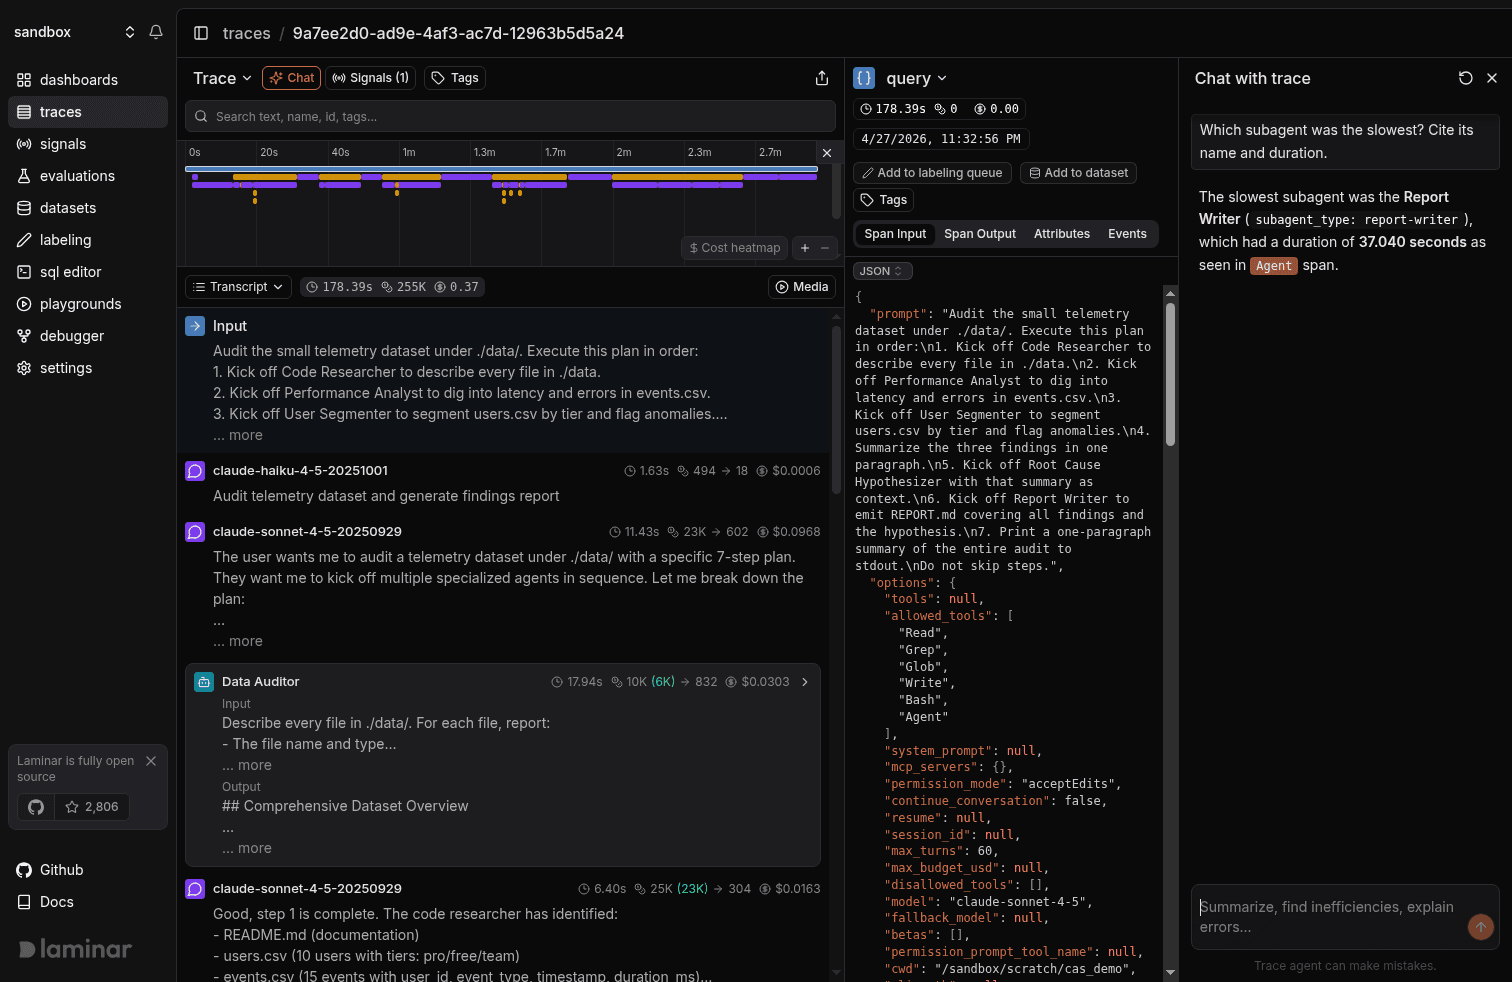
The response reads the actual trace and cites specific spans as inline pills. The orange Agent and anthropic.messages chips in the screenshot are clickable; click anthropic.messages and you land on the exact LLM call that dominated the subagent run. When the answer is structured, like a comparison across subagents, it renders a table.
Span citation is what separates this from pasting a trace into ChatGPT. Every load-bearing claim the trace agent makes is anchored to a span you can click into, so when it gets something wrong you can see immediately that it's wrong, and the spans you'd need to correct it with are right there.
The questions that have saved us the most time:
- "Summarize this run." Usually tells you whether it succeeded, failed, or partially succeeded without you reading a single span.
- "Which subagent was slowest and why?" Tall pole, plus the reason it was tall.
- "Did the agent ever retry a tool call? If so, why?" Catches silent retry storms a tree view buries three levels deep.
- "What did Report Writer actually return?" Faster than opening the span output pane and scrolling raw JSON.
- "At what turn did the plan change?" The most useful question for debugging an agent that did the wrong thing. The answer is a span pill you can click.
Try it
Laminar is open source and easily self-hostable: github.com/lmnr-ai/lmnr. Integration is 1 line of code and you can start sending traces within 1 minute. Here're the docs for the Claude Agent SDK integration, and you can explore all integrations here.