
Overview
Laminar is OpenTelemetry-native, so it captures full traces of every Vercel AI SDK call:generateText, streamText, embed, tool calls, and provider-level request and response payloads.
What Laminar captures:
- Prompts, messages, and system instructions sent to the model.
- Model output, reasoning, and structured object results.
- Tool calls, arguments, and tool results.
- Token counts, latency, and cost per call.
- Provider identity (OpenAI, Anthropic, Google, Mistral, and others) and model name.
ai version.
Getting Started
- AI SDK v7
- AI SDK v5 and v6
Install
@ai-sdk/openai for any provider adapter you use (full list).Set environment variables
Laminar initialization. If not specified,
Laminar will look for the key in the LMNR_PROJECT_API_KEY environment variable.Register Laminar telemetry
new LaminarAiSdkTelemetry() initializes Laminar for you (it calls Laminar.initialize() internally if Laminar isn’t already initialized), so you don’t need a separate Laminar.initialize() call. Pass options to the constructor to configure it: see Configure the integration.@lmnr-ai/lmnr also exports registerAiSdkTelemetry(), a one-line equivalent that registers the same integration without importing registerTelemetry from ai:LaminarAiSdkTelemetry (including laminarOptions). Reach for it when you want to register telemetry before the AI SDK is loaded, or to keep the import surface to a single package.Use the AI SDK as usual
generate* and stream* call is traced automatically.streamText and embed.Turn telemetry off for one call
WithregisterTelemetry, tracing is on for every call by default. To disable it for a single call site, pass a telemetry block with isEnabled: false. This overrides the global registration for that call only.
telemetry block also takes functionId, which names the call’s span:
experimental_telemetry block: omit it (or set isEnabled: false) to skip tracing for a call, and pass functionId / metadata there.Attach metadata, sessions, user IDs, and tags
On AI SDK v7, per-call context goes inruntimeContext. The AI SDK only sends a runtimeContext key to telemetry when you opt it in with telemetry.includeRuntimeContext, so list every key you want in Laminar there.
includeRuntimeContext stay in your application and never reach Laminar, so you can keep request-scoped values in runtimeContext without exporting them.
runtimeContext requires @lmnr-ai/lmnr 0.8.49 or later.Configure the integration
LaminarAiSdkTelemetry takes an options object. All options are optional.
laminarOptions: configure the Laminar SDK
laminarOptions: configure the Laminar SDK
laminarOptions accepts exactly what you would pass to Laminar.initialize(). Use it to set the project API key, base URL, or any other init option in one place, so you don’t need a separate Laminar.initialize() call.laminarOptions is ignored.recordInputs and recordOutputs: control payload capture
recordInputs and recordOutputs: control payload capture
true. Set either to false to keep prompt or response content off your spans (for sensitive data or to reduce payload size). Token counts, finish reasons, latency, and cost are always recorded, regardless of these flags.createStepSpan: add a span per step
createStepSpan: add a span per step
false. Set it to true to emit an extra span for each step of a multi-step generation, so the trace shows the step boundaries explicitly in addition to the LLM and tool spans.Flush spans before exit
In short-lived scripts and serverless runtimes, the process can exit before Laminar finishes sending its last batch of spans. CallLaminar.shutdown() at the end of a script, or Laminar.flush() at a checkpoint you want to force out, to make sure the final spans land.
Next.js setup
In Next.js, Laminar lives ininstrumentation.ts, which Next.js auto-loads before any route or server component runs.
Install
Set environment variables
Update next.config.ts
Initialize in instrumentation.ts
instrumentation.ts at the project root.- AI SDK v7
- AI SDK v5 and v6
nodejs runtime. The guard skips Edge runtime routes automatically.@vercel/otel or @sentry/nextjs, initialize them first, then Laminar. See Coexisting with @vercel/otel below.Use the AI SDK in a route handler
- AI SDK v7
- AI SDK v5 and v6
Tracing a multi-step agent
The AI SDK runs the tool-calling loop for you: the model calls a tool, the AI SDK runs the tool’sexecute, feeds the result back, and repeats until the model stops calling tools or a stop condition trips. Laminar records every step as a span under one trace, so the transcript shows each tool call and its result in order.
Two shapes are common. generateText with tools and stopWhen is the workhorse. ToolLoopAgent is a thin wrapper if you want to reuse the same tools and instructions across many calls.
generateText with tools
stopWhen: stepCountIs(5) caps the loop at five model-and-tool rounds. You can combine conditions (stopWhen: [stepCountIs(20), hasToolCall('finalize')]) or pass a custom predicate.
runtimeContext and telemetry blocks with experimental_telemetry: { isEnabled: true, tracer: getTracer(), functionId: 'travel-assistant', metadata: { env: 'production' } }.ToolLoopAgent
Reuse the same configuration across calls by constructing aToolLoopAgent once:
Decisions with experimental_decide
experimental_decide answers typed questions (choice, boolean, score) about a piece of state in one call, using openai.decisionModel('gpt-6-luna'). With @lmnr-ai/lmnr 0.8.50 or later, each call becomes an ai.decide LLM span with the state as input, the questions in the span’s output schema, and the answers as output. See Decisions API for a full example.
Debugging with the replay debugger
The Laminar debugger records a run, lets you edit your code, and replays from a cached checkpoint so unchanged LLM calls are served from cache. For the AI SDK, caching needs one extra step: wrap each model withwrapLanguageModel, which hashes the call’s input and asks the Laminar backend for a cached response. The telemetry wiring above is unchanged.
See what happened in a trace
Open the trace in Laminar and you get the transcript view: system prompt, user messages, model output, tool calls, and tool results laid out as a conversation. Sub-agents collapse to their input and final output so you read what mattered, not a tree of span names.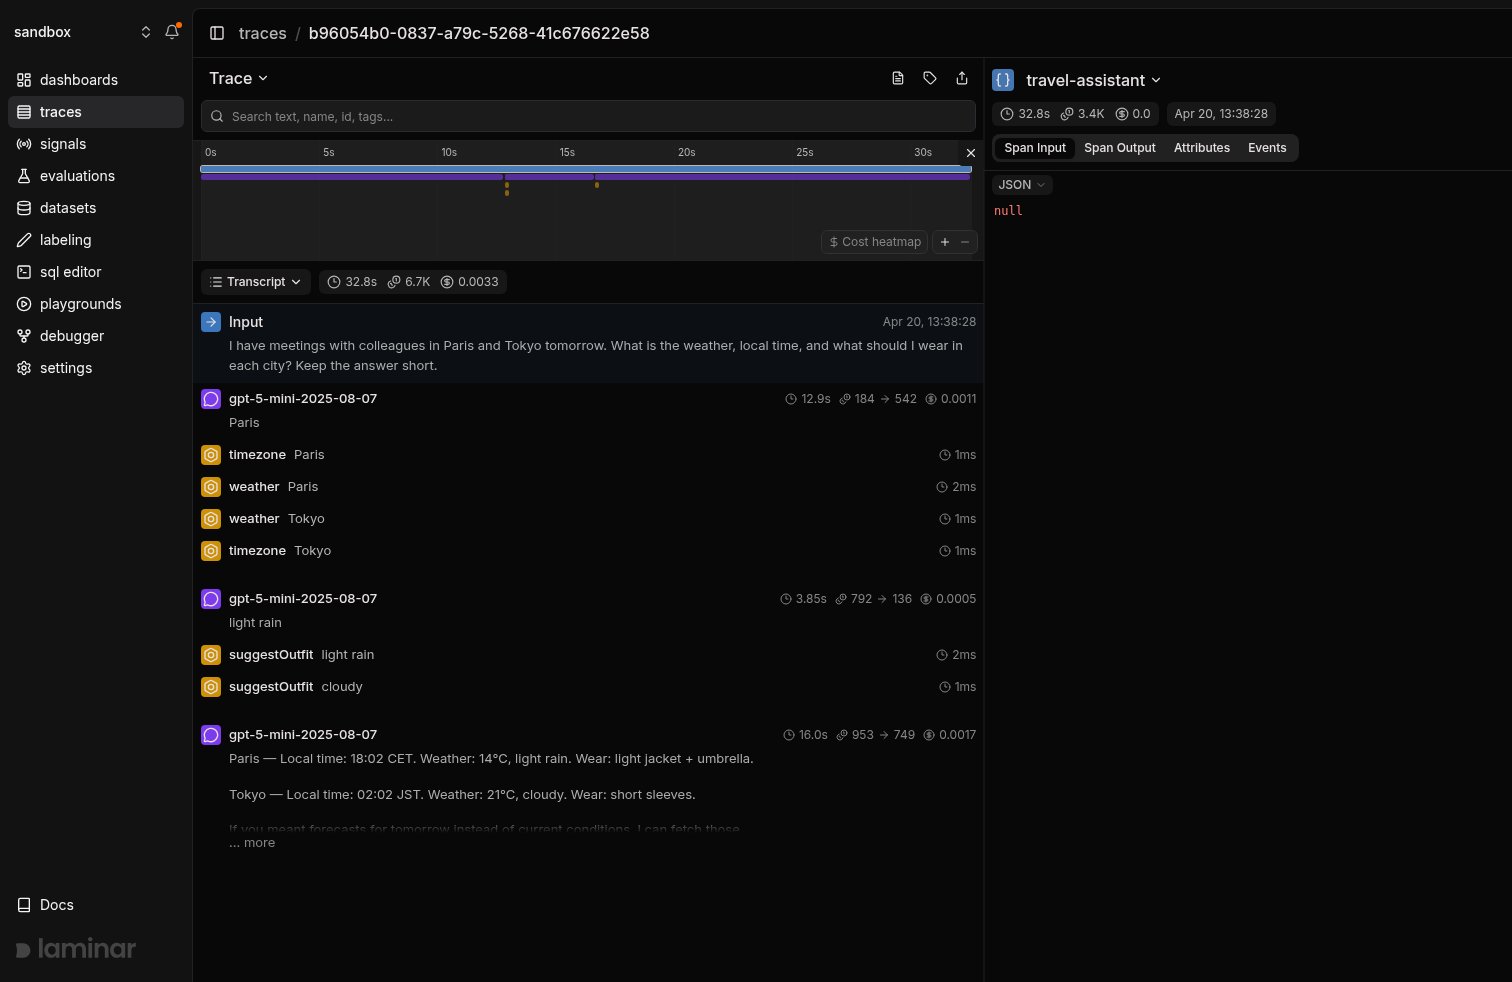
Vercel AI SDK trace in Laminar: the generateText call with tool invocations, the model response, and each step shown as a transcript entry.
Track outcomes with Signals
Traces answer what happened on this run. Signals answer the cross-trace question: how often does the agent recommend a product that wasn’t in stock, when does a tool call return an empty result, which generateText calls fan out into more steps than expected. A Signal pairs a plain-language prompt with a JSON output schema. Laminar runs it live on new traces (Triggers) or backfills it across history (Jobs) and records a structured event every time it matches. From there you query, cluster, and alert on events across every trace.Query across traces
- SQL editor for ad-hoc queries across traces, spans, signals, and evals.
- SQL API for programmatic access from scripts and pipelines.
- CLI (
lmnr-cli sql query) for terminal-driven queries and piping JSON into shell tools or coding agents. - MCP server to query Laminar from Claude Code, Cursor, or Codex.
Grouping calls inside one route
If a single route makes multiple LLM calls, wrap them inobserve to group them under one parent span.
@vercel/otel or @sentry/nextjs) is already wrapping your handler.
See the full observe reference for session IDs, user IDs, metadata, and tags on the parent span. For per-call context on AI SDK v7, use runtimeContext.
Coexisting with @vercel/otel
If you already register a tracer provider with@vercel/otel, do not call Laminar.initialize() (that would register a second provider). Plug Laminar’s span processor into the existing one instead:
getTracer() per call.
Migrating from v5 or v6 to v7
If you already trace the AI SDK with theexperimental_telemetry + getTracer() pattern, here is how to move to the v7 style. The trace shapes are nearly identical, so your existing traces, Signals, and dashboards keep working.
Upgrade the AI SDK
ai, @lmnr-ai/lmnr, and every @ai-sdk/* provider package you use to the latest version.Register Laminar once instead of initializing
Laminar.initialize() call at your entry point with a single registerTelemetry call. The integration initializes Laminar for you, so move any Laminar.initialize() options into laminarOptions.Drop experimental_telemetry from your call sites
experimental_telemetry block.Move any per-call settings to the telemetry block
functionId through experimental_telemetry, or you want to turn tracing off for it, use the telemetry block instead. Metadata moves to runtimeContext, with each key opted in through telemetry.includeRuntimeContext (see Attach metadata, sessions, user IDs, and tags).Keep wrapLanguageModel for the debugger
wrapLanguageModel around each model for caching. That step is unchanged across versions.Keep flushing at exit
await Laminar.shutdown() (or Laminar.flush()) is still required at the end of short-lived scripts and serverless runtimes so the last spans are sent.Troubleshooting
I don't see any traces in Laminar
I don't see any traces in Laminar
- Confirm
LMNR_PROJECT_API_KEYis set in the runtime environment, not just your shell. - Laminar must be registered (v7:
registerTelemetry(new LaminarAiSdkTelemetry())) or initialized (v5/v6:Laminar.initialize()) before the first AI SDK call. In Next.js, that means it lives ininstrumentation.ts. - On v5 and v6,
experimental_telemetryis opt-in per call. If you forget to pass{ isEnabled: true, tracer: getTracer() }, the call is not traced. On v7, check you didn’t passtelemetry: { isEnabled: false }. - Short-lived scripts can exit before spans flush. Call
await Laminar.shutdown()at the end. - Edge runtime is not supported. Make sure your route runs in
nodejs.
Build fails with OpenTelemetry / require errors
Build fails with OpenTelemetry / require errors
@lmnr-ai/lmnr to serverExternalPackages in next.config.ts. OpenTelemetry uses Node-specific APIs that Next.js cannot bundle.Using Next.js < 15
Using Next.js < 15
instrumentation.ts is experimental before Next.js 15. Enable it in next.config.js:Mixing the AI SDK with a direct OpenAI or Anthropic client
Mixing the AI SDK with a direct OpenAI or Anthropic client
Laminar.initialize() in Node.js. In Next.js, imports inside instrumentation.ts are not visible to the rest of the app, so auto-instrumentation may miss them. Call Laminar.patch({ OpenAI, anthropic }) where you construct the client: