
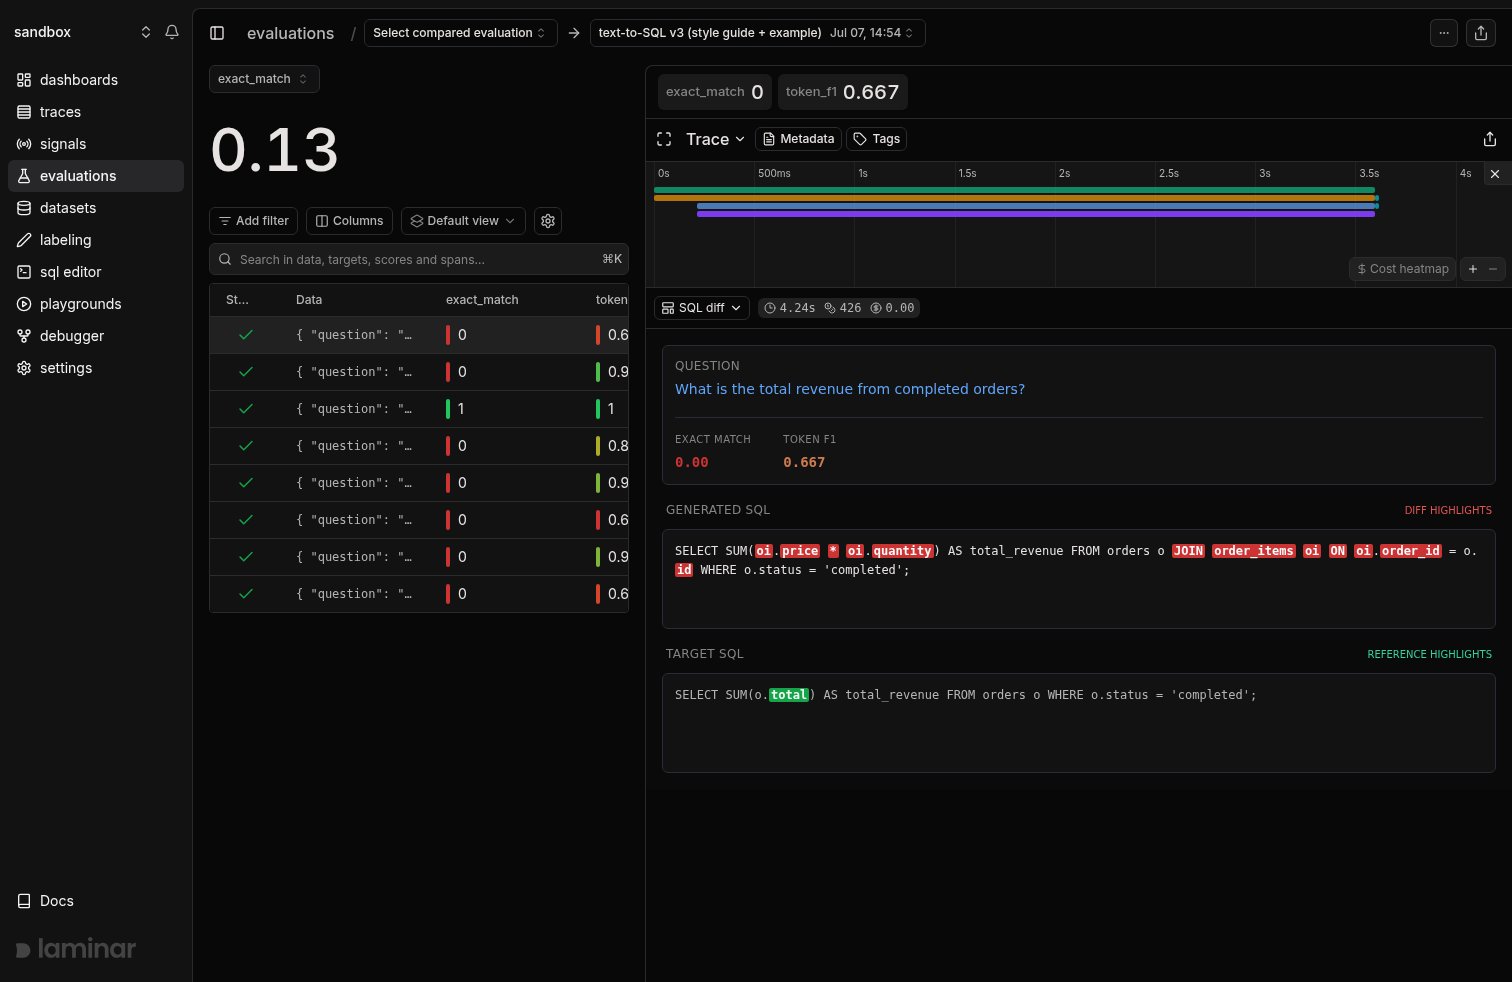
A text-to-SQL eval datapoint rendered through a custom template: the question, both scores, and a word diff between the model's SQL and the target
What an eval trace gives you
Every datapoint becomes one trace with a predictable structure:- An
EVALUATIONroot span. - An
EXECUTORspan: itsinputis the datapoint’sdata, itsoutputis whatever your executor returned. - Any auto-instrumented LLM or tool spans nested under the executor.
- One
EVALUATORspan per scoring function: itsinputis[output, target], itsoutputis the score.
Create a template from an eval trace
- Open any datapoint of the run: its trace shows in the right-hand panel.
- Click the view dropdown in the trace pane (where Transcript and Tree live) and pick + New template.
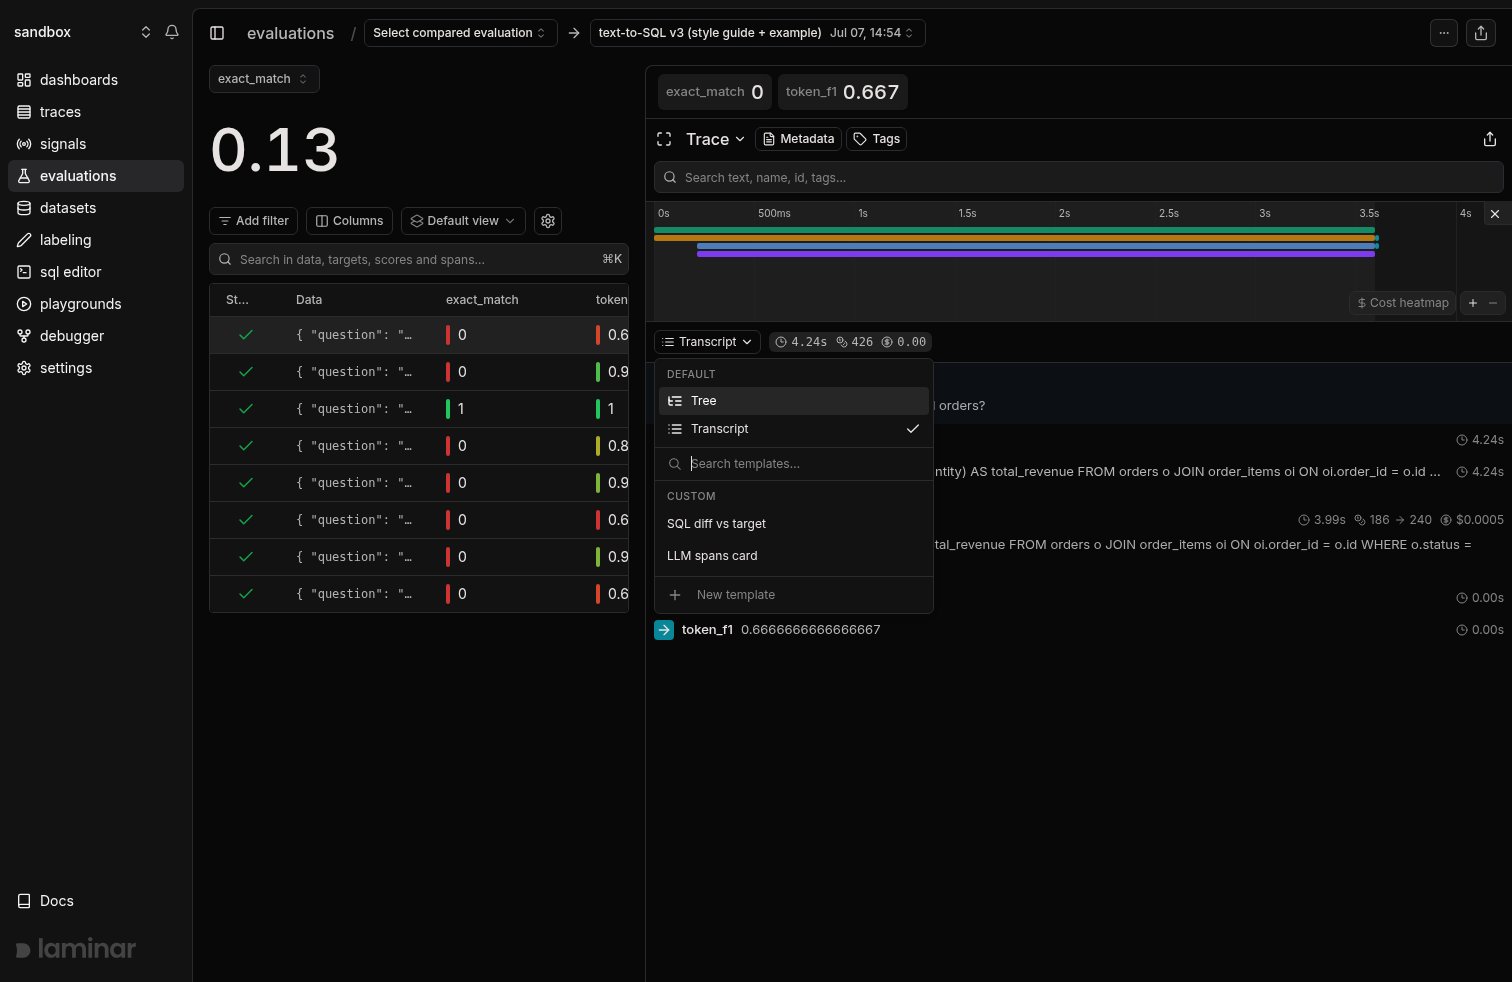
The trace view dropdown on an eval trace: Tree and Transcript on top, existing templates under Custom, and + New template at the bottom.
- Name the template and describe what you want to see, like “show the question, both scores, and a word diff between the model’s SQL and the target”.
- Click Generate. Laminar reads an outline of the eval trace and writes both the span filter and the JSX: for a template like this it filters to
span_type IN ('EXECUTOR', 'EVALUATOR'), pulls the real spans, and renders the preview against them. If the view isn’t right, describe the change and click Request changes. - Click Save.
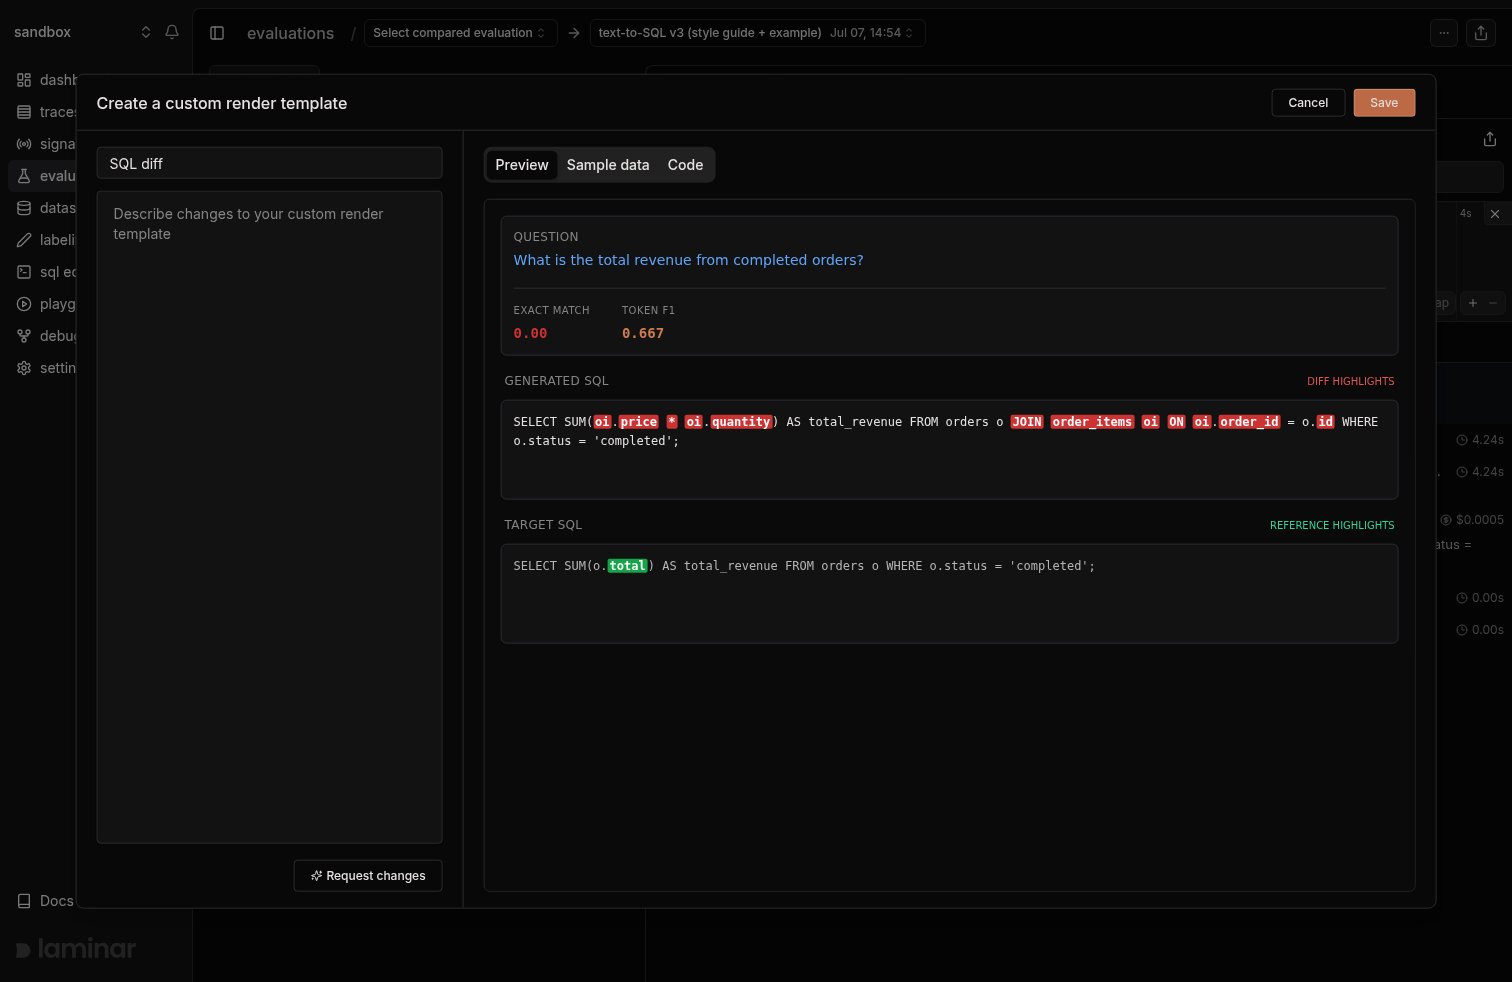
The template editor on an eval trace after generating. The description produced the span filter and the JSX, and the preview renders against the trace's real executor and evaluator spans.
Example: diff the output against the target
The screenshot at the top comes from a text-to-SQL eval: the executor generates SQL from an analytics question, andexact_match / token_f1 evaluators score it against a target query. token_f1 tells you how far the output is from the target, but not where it differs. The template below shows exactly where: it pulls the question from the executor’s input, the generated SQL from its output, and the target from the evaluator’s input, then renders a word-level diff.
{ spans, truncated }: the spans matched by your filter (with spanType, input, output, and more, JSON-parsed when possible), and a flag that’s true when the trace had more than 256 matching spans. See Trace templates for the full payload contract.
The same pattern covers any eval where output and target are comparable text or structure: extraction pipelines (render both JSON objects side by side), translation (sentence diff), classification (predicted vs expected label with the model’s reasoning underneath).
Where this pays off
- Reviewing a fresh run: click through rows and read the rendered view instead of expanding executor and evaluator spans on each trace.
- Debugging a regression: after comparing two runs, open the rows whose scores dropped and the template shows what changed in the output. See the regression workflow.
- Sharing a run: anyone on the project gets the same template from the same dropdown; no local setup.
Next steps
Render templates
The full mechanism: span templates, trace templates, payload contract, and the AI-assisted editor.
Compare runs
Progression charts, side-by-side deltas, and where custom rendering fits the review loop.
Quickstart
Write and run your first evaluation.
Concepts
Datapoints, executors, evaluators, and how they map to trace spans.