
data and renders it however you want. Describe the view you want and Laminar generates the component for you, or write the JSX by hand. Use them when the default views don’t show your data the way you want to read it.
Templates come in two scopes:
- Span templates render one pane’s value: a span’s input or output. Use them to reshape a single payload, like a list of flights or a tool result.
- Trace templates render a whole trace. They receive every span matching a SQL filter you define, so they can combine data across spans: an executor’s output next to an evaluator’s target, an agent’s plan next to its final answer.
Where to find them
Every input/output viewer in Laminar has a mode picker in the top-left corner. Alongside the default LLM Messages, JSON, YAML, and TEXT modes, the picker lists every render template in the project under Custom. Pick one and the pane renders through that template.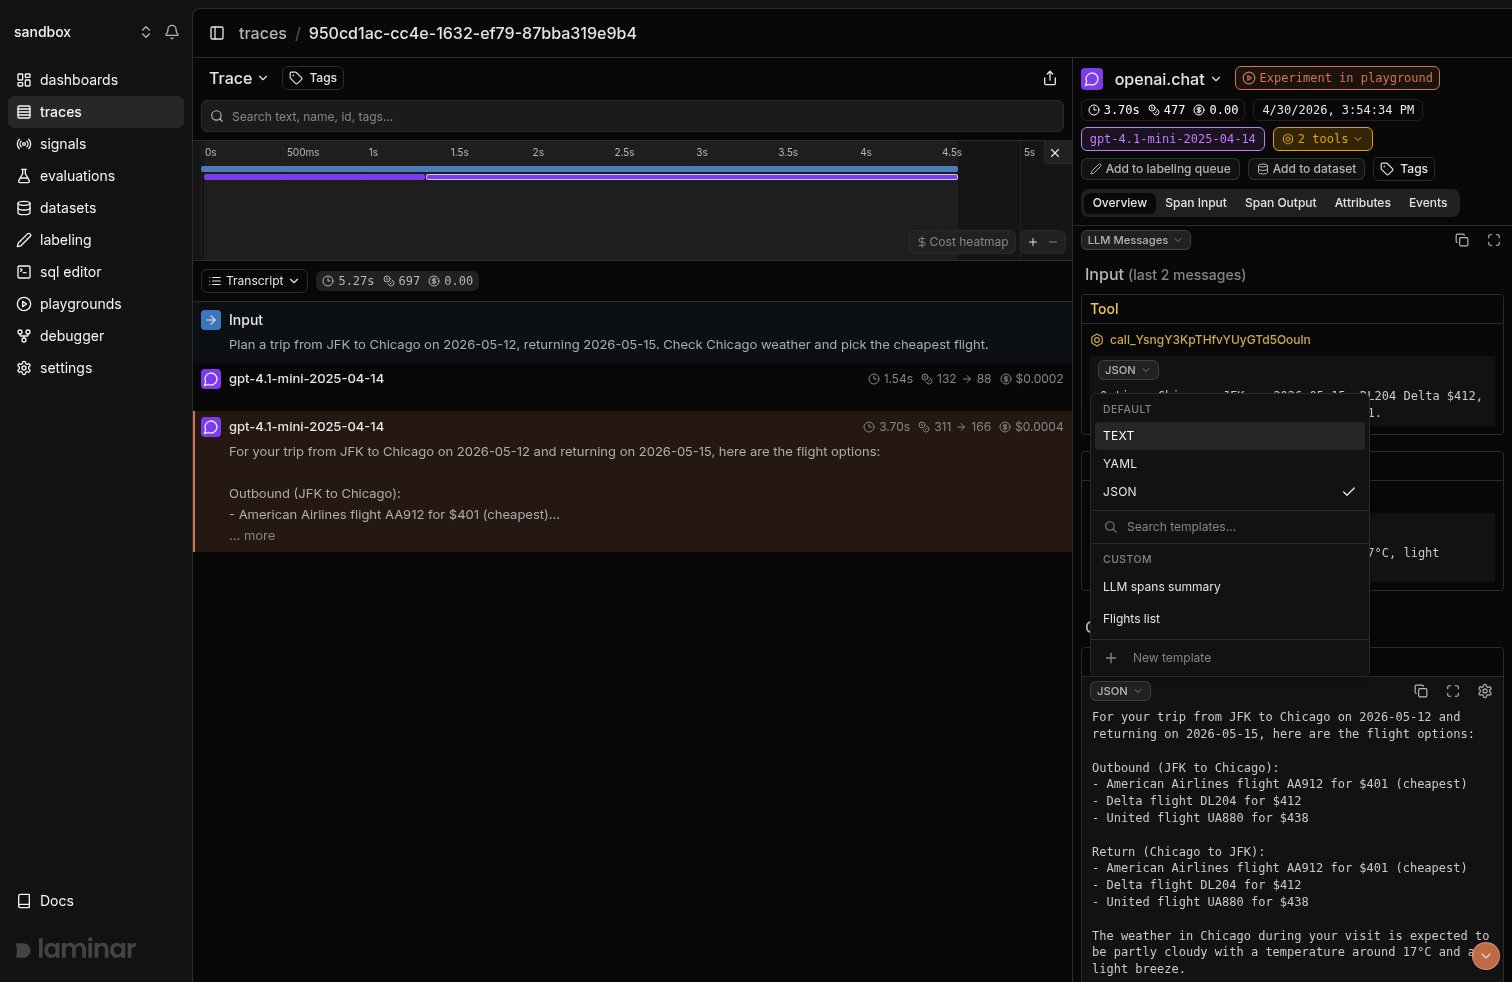
The mode picker on a span's output, with the default modes on top and the project's render templates under Custom.
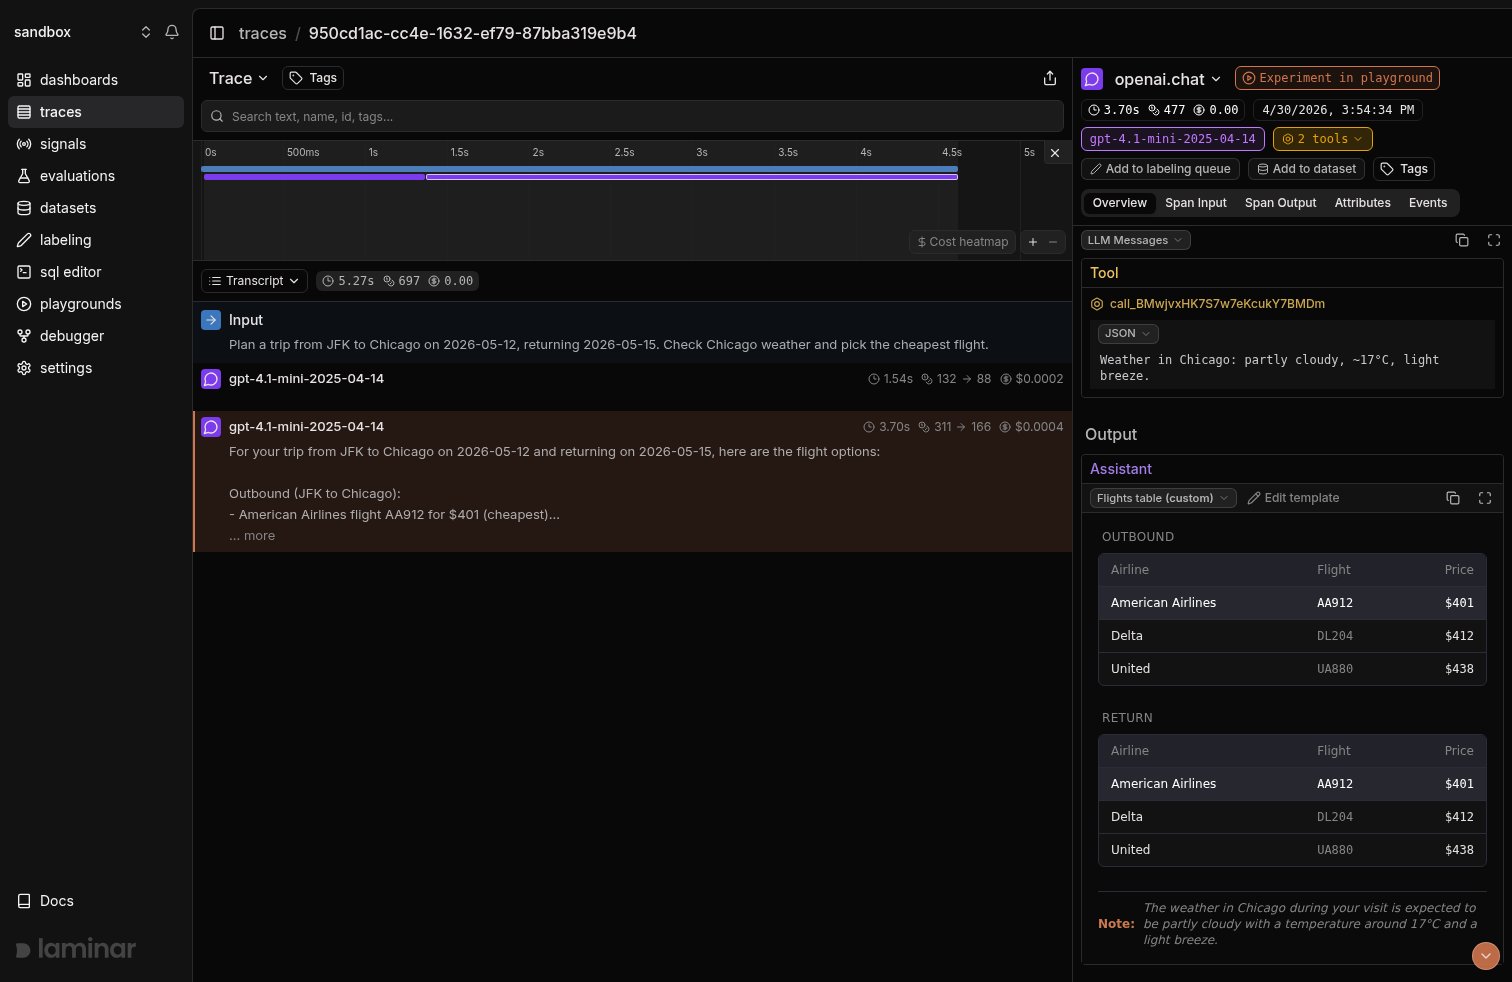
Same span, rendered through a Flights table template instead of raw JSON. The Edit template button next to the picker opens the editor without leaving the trace.
Generate a template
Open any I/O view, pick the mode dropdown, and click + New template. The dialog opens with the pane’s payload already loaded under the Sample data tab, so Laminar knows the shape of your data before you type anything. Then:- Name the template.
- Describe the view you want in the text field, like “a table of flights with price, airline, and departure time, cheapest first”.
- Click Generate. Laminar writes the JSX against your sample data and the Preview tab renders it live.
- Not quite right? Describe the change and click Request changes. Each iteration edits the existing template instead of starting over.
- Click Save.
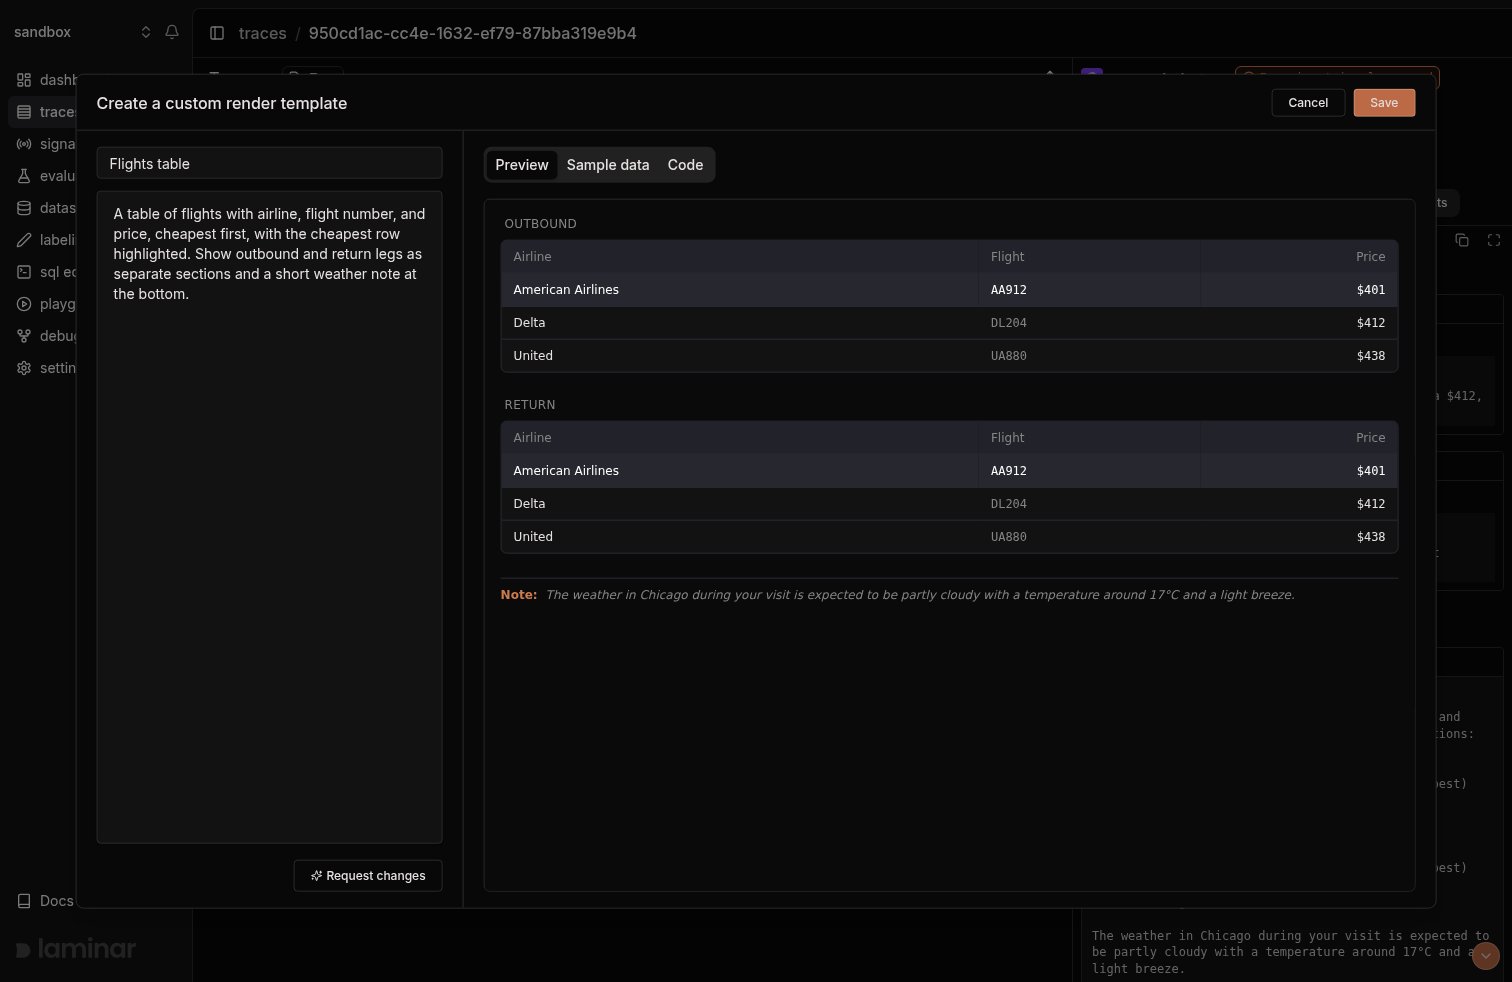
The template editor: name and description on the left, Preview / Sample data / Code tabs on the right. Generate writes the JSX and the preview renders it against the pane's real payload.
Manage templates
Open Project Settings → Render Templates to edit or delete any template in the project, span-scoped and trace-scoped alike.What a span template looks like
A template is one function that takes{ data } and returns JSX:
data can be anything the pane shows: an object, array, primitive, null, or undefined.
Trace templates
A trace template renders the whole trace instead of one span’s pane. It’s the same JSX function, butdata is a set of spans matched by a SQL filter you define, so one view can combine an executor’s output with an evaluator’s target, or show only the tool calls out of a long agent run.
Create one
Open any trace and click the view dropdown in the trace pane (where Tree and Transcript live). Your trace templates are listed under Custom; + New template opens the editor.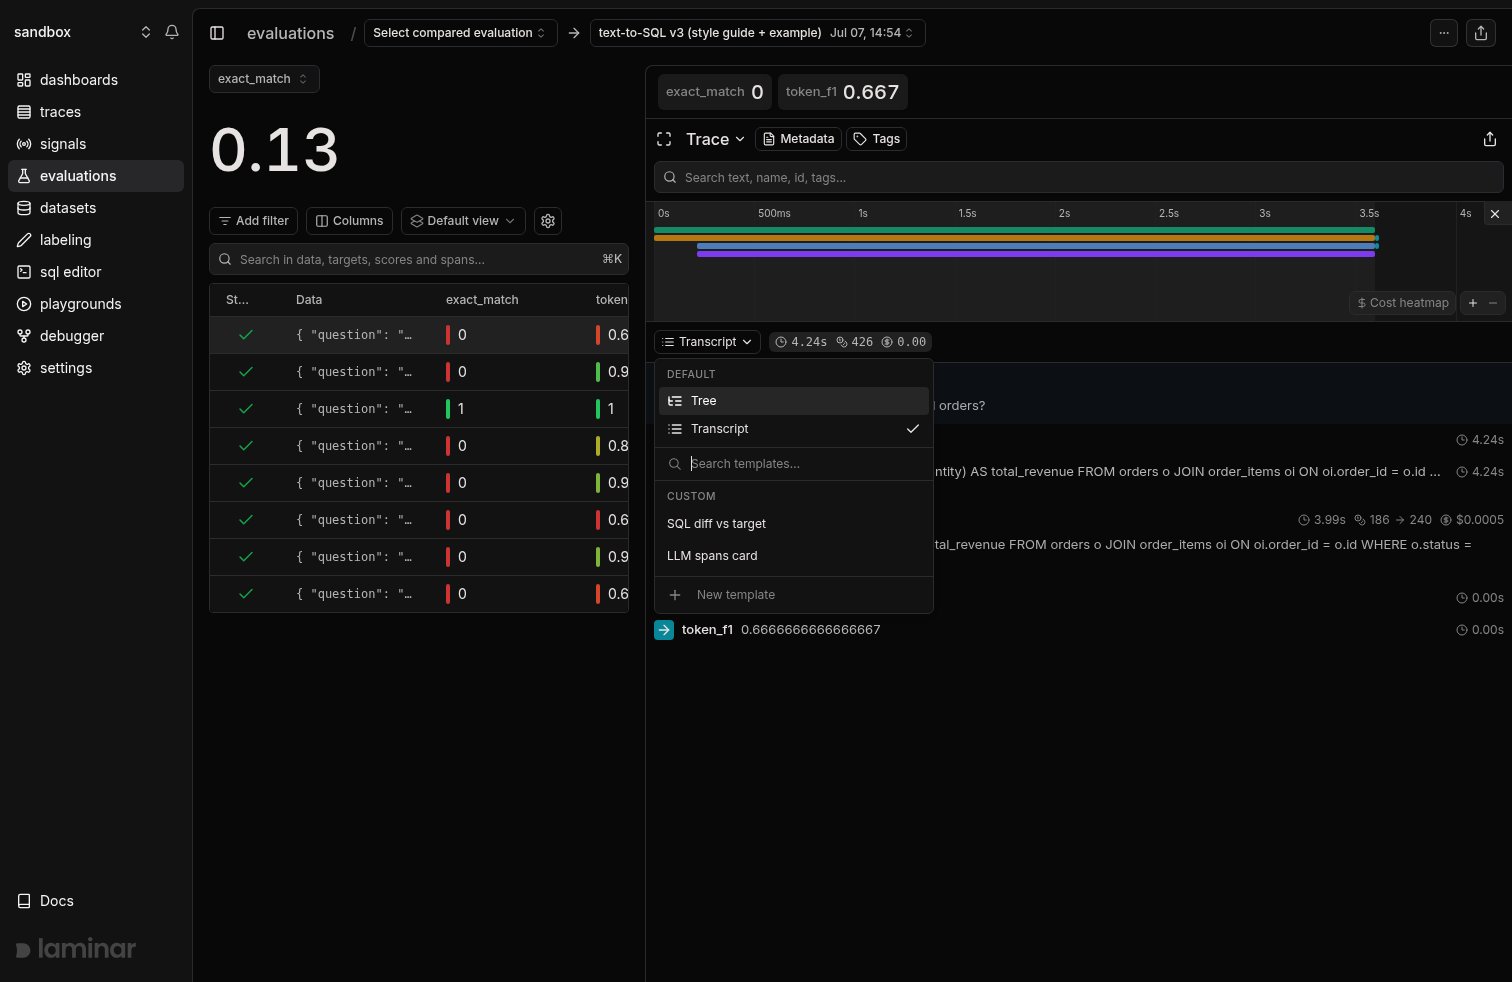
The trace view dropdown: Tree and Transcript on top, the project's trace templates under Custom, and + New template at the bottom.
SELECT * FROM spans WHERE trace_id = <trace> AND (...); empty means every span. When you click Generate, Laminar reads an outline of the trace you opened the editor from and writes both the filter and the JSX to match your description: ask for “executor output diffed against the evaluator’s target” and the filter comes back matching only those span types.
The filter lives under the Sample data tab. Edit it by hand there if you want, and click Test to run it against the current trace and reload the sample data and preview with the real result. After each generation, the sample data refreshes automatically against the new filter.
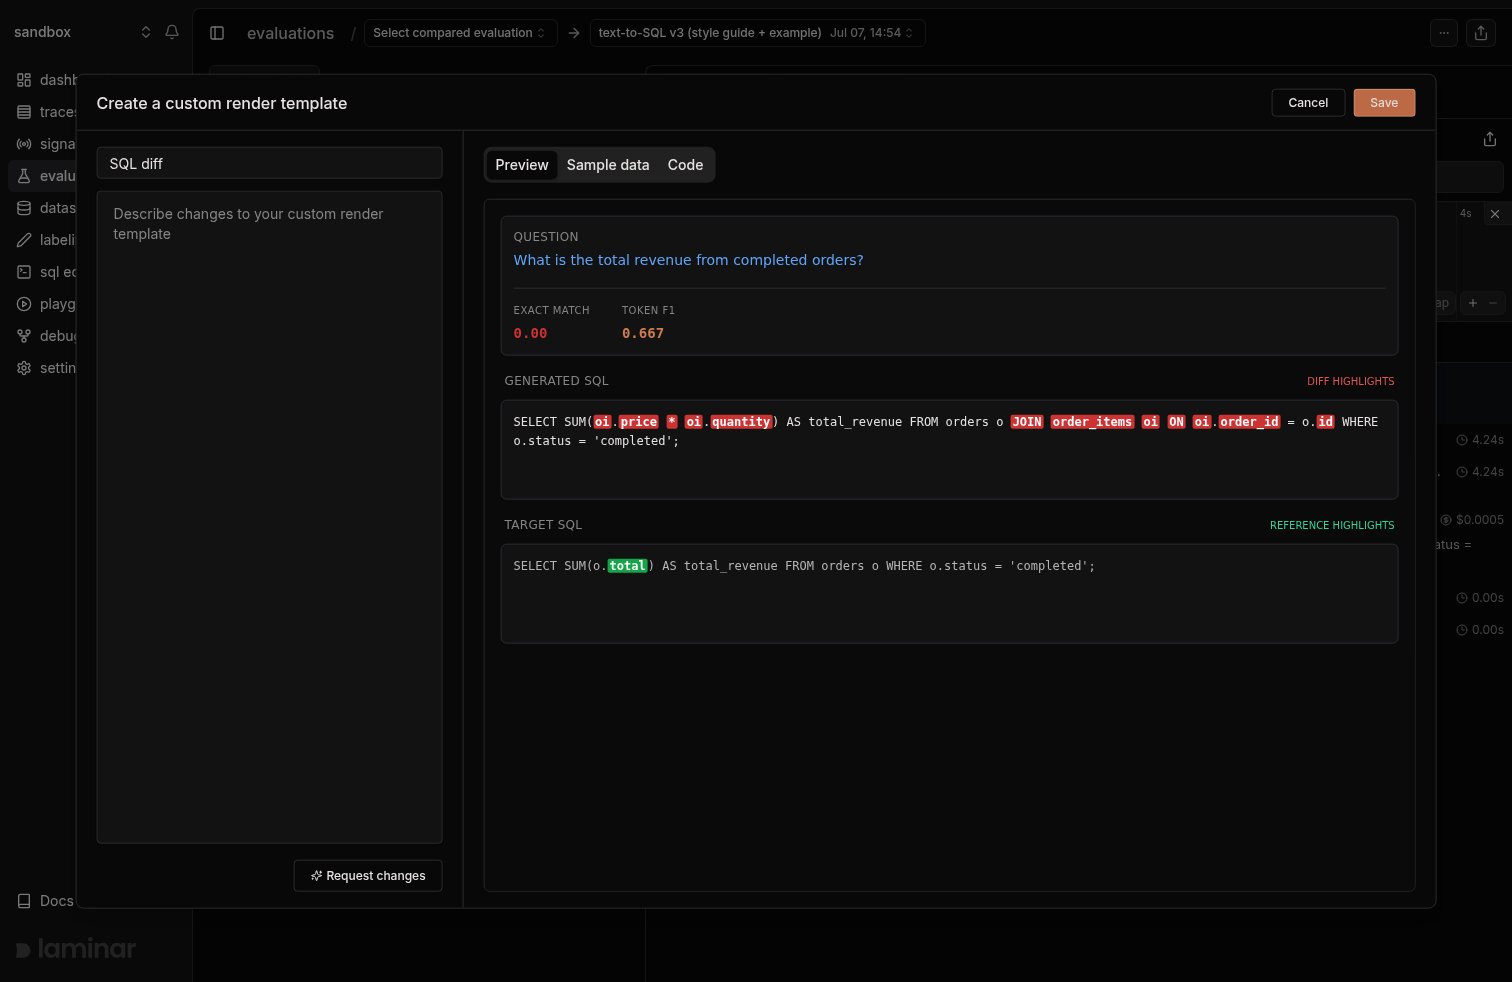
The trace template editor after generating: the description produced both the span filter and the JSX, and the preview renders the SQL diff against the real trace.
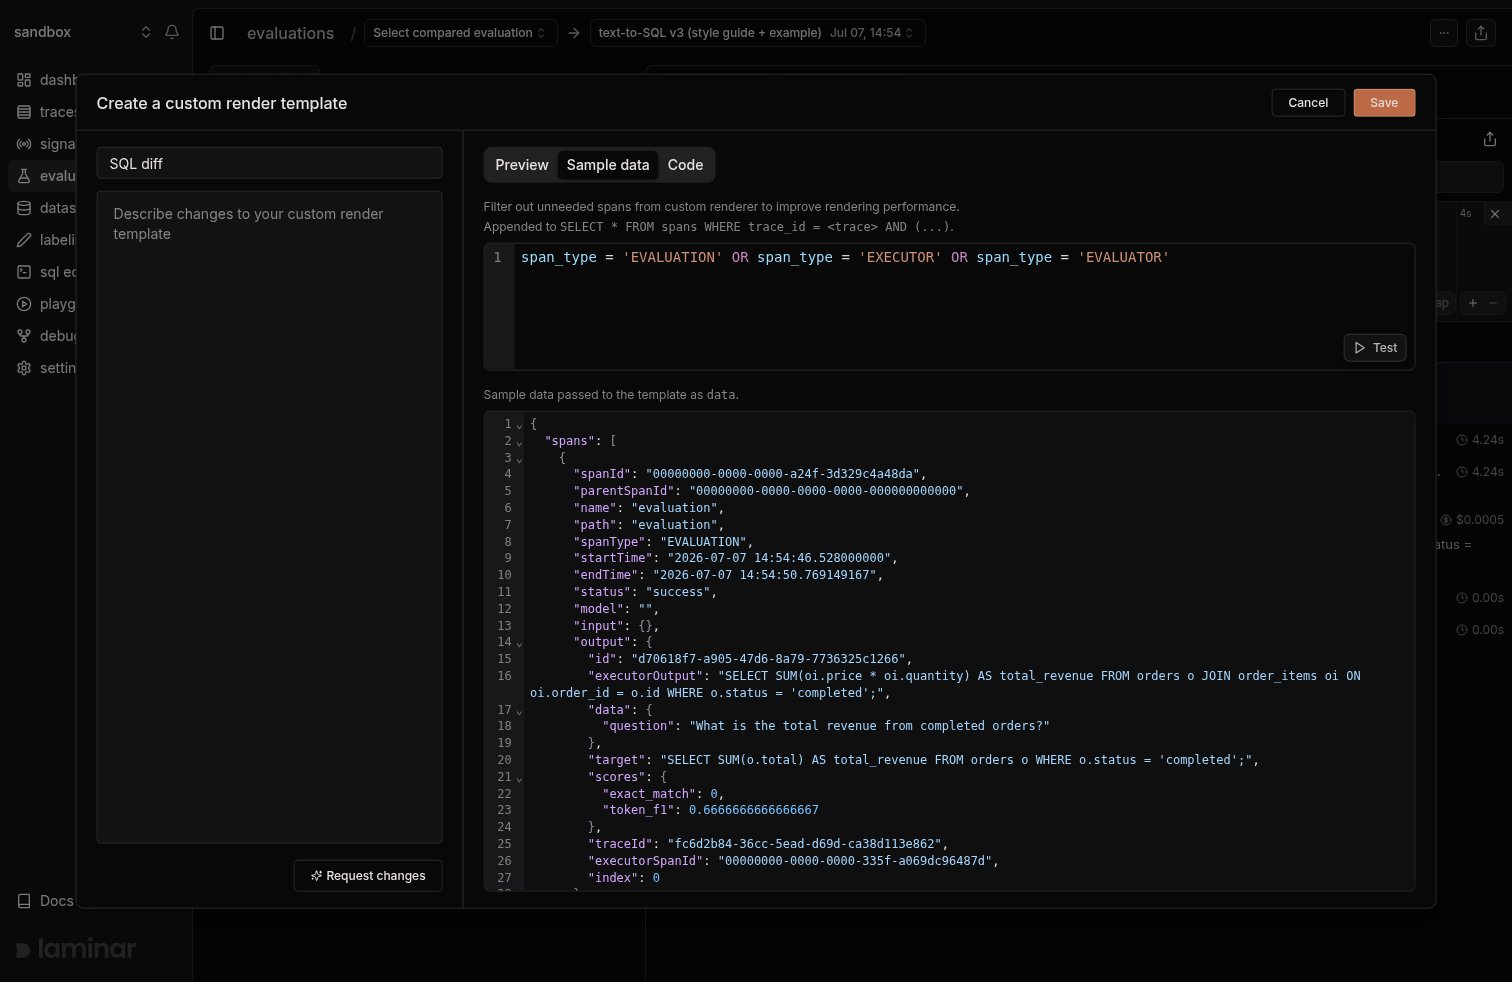
The Sample data tab of the same template: the generated span filter on top, the Test button to rerun it, and the real spans it returned below.
What the template receives
data is an object with two fields:
truncated is true, so render a notice when you expect long traces.
Example: diff an eval output against its target
The evaluation below generates SQL from analytics questions and scores it against a target query withexact_match and token_f1 evaluators:
token_f1 tells you how far the output is from the target, but not where it differs. A trace template can show that: on an eval trace, the executor span’s input holds the question and its output holds the generated SQL, and each evaluator span’s input is [output, target], so the target is right there in the trace. A description like “diff the executor’s SQL output against the evaluator’s target, word by word, with the scores on top” generates a template like the one below.
Span filter:
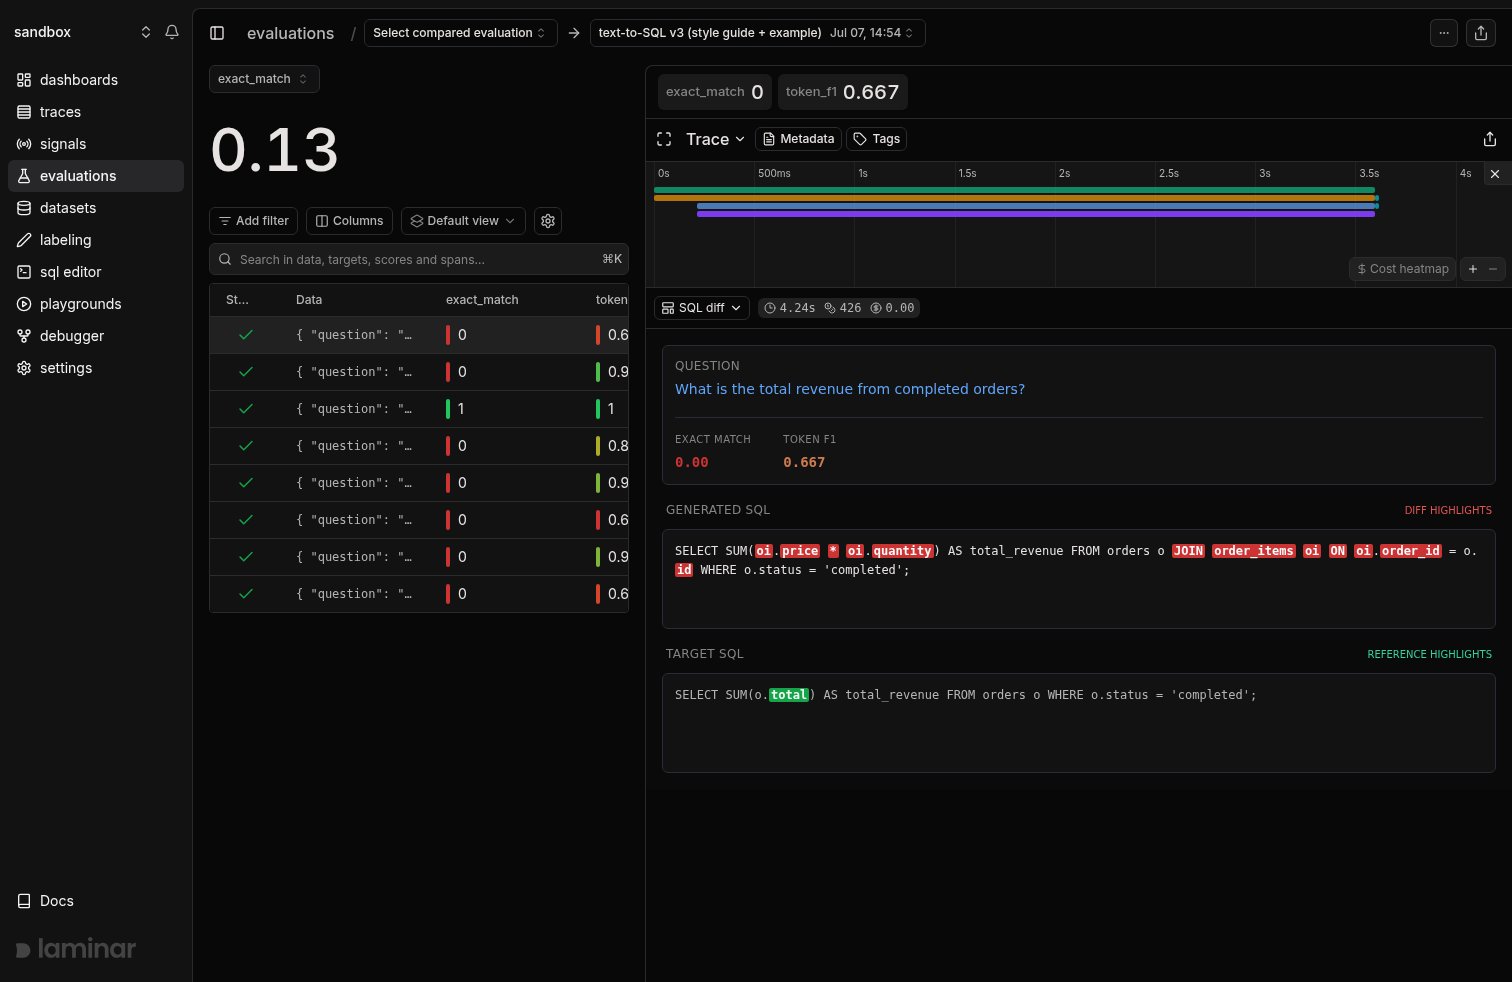
An eval trace rendered through the template: the question, both scores, and a word diff between the generated SQL and the target.