
Overview
This guide describes best practices for using Laminar Signals and walks you through the whole agent observability lifecycle from setting up your signal to extracting specific insights from it. We will start by defining a broad pattern of errors to look for in a trace. We will then look into clusters to get insights into the behavior patterns of the agent using that Signal. Finally, we will narrow the Signal down to the specific cases that are most important to your business use case. This guide answers the following questions:- How do you evaluate the performance of your agent in production?
- How do you set up and use Laminar Signals?
- What affects the quality of Laminar Signals analysis?
- How can you see how your AI agent fails at scale?
- How do you go from a broad catch-all error pattern to more narrow Signals that are great at finding specific issues?
Problem
Traditional LLM observability, i.e. a layer which writes all agent inputs and outputs to a data store, cannot answer hard questions about your agent behavior in production at scale. Moreover, it cannot even help you ask the right questions like “how does my agent fail?”, “what are the most common failure patterns?”, or “where should I invest my development effort, so that the next version is better?” This is where Laminar Signals come in.Getting started
Laminar Signals are instructions written in plain language that can be enabled inside your project to analyze your traces. A Signal can read every trace as it is produced and output a structured record when it finds something you described. Unlike most traditional online evaluations, Signals look at the entire trace content, can be defined much more high-level, and feature clustering of their outputs. This can perfectly suit both the cases when you know very well what you are looking for and the cases where you want Signals to help you find what to look for. To get started, head to the signals section, create a new signal, and click the “Failure” card to select the “Failure Detector” template. You can edit the prompt and the schema definition, but for our example, we’ll keep it at default settings.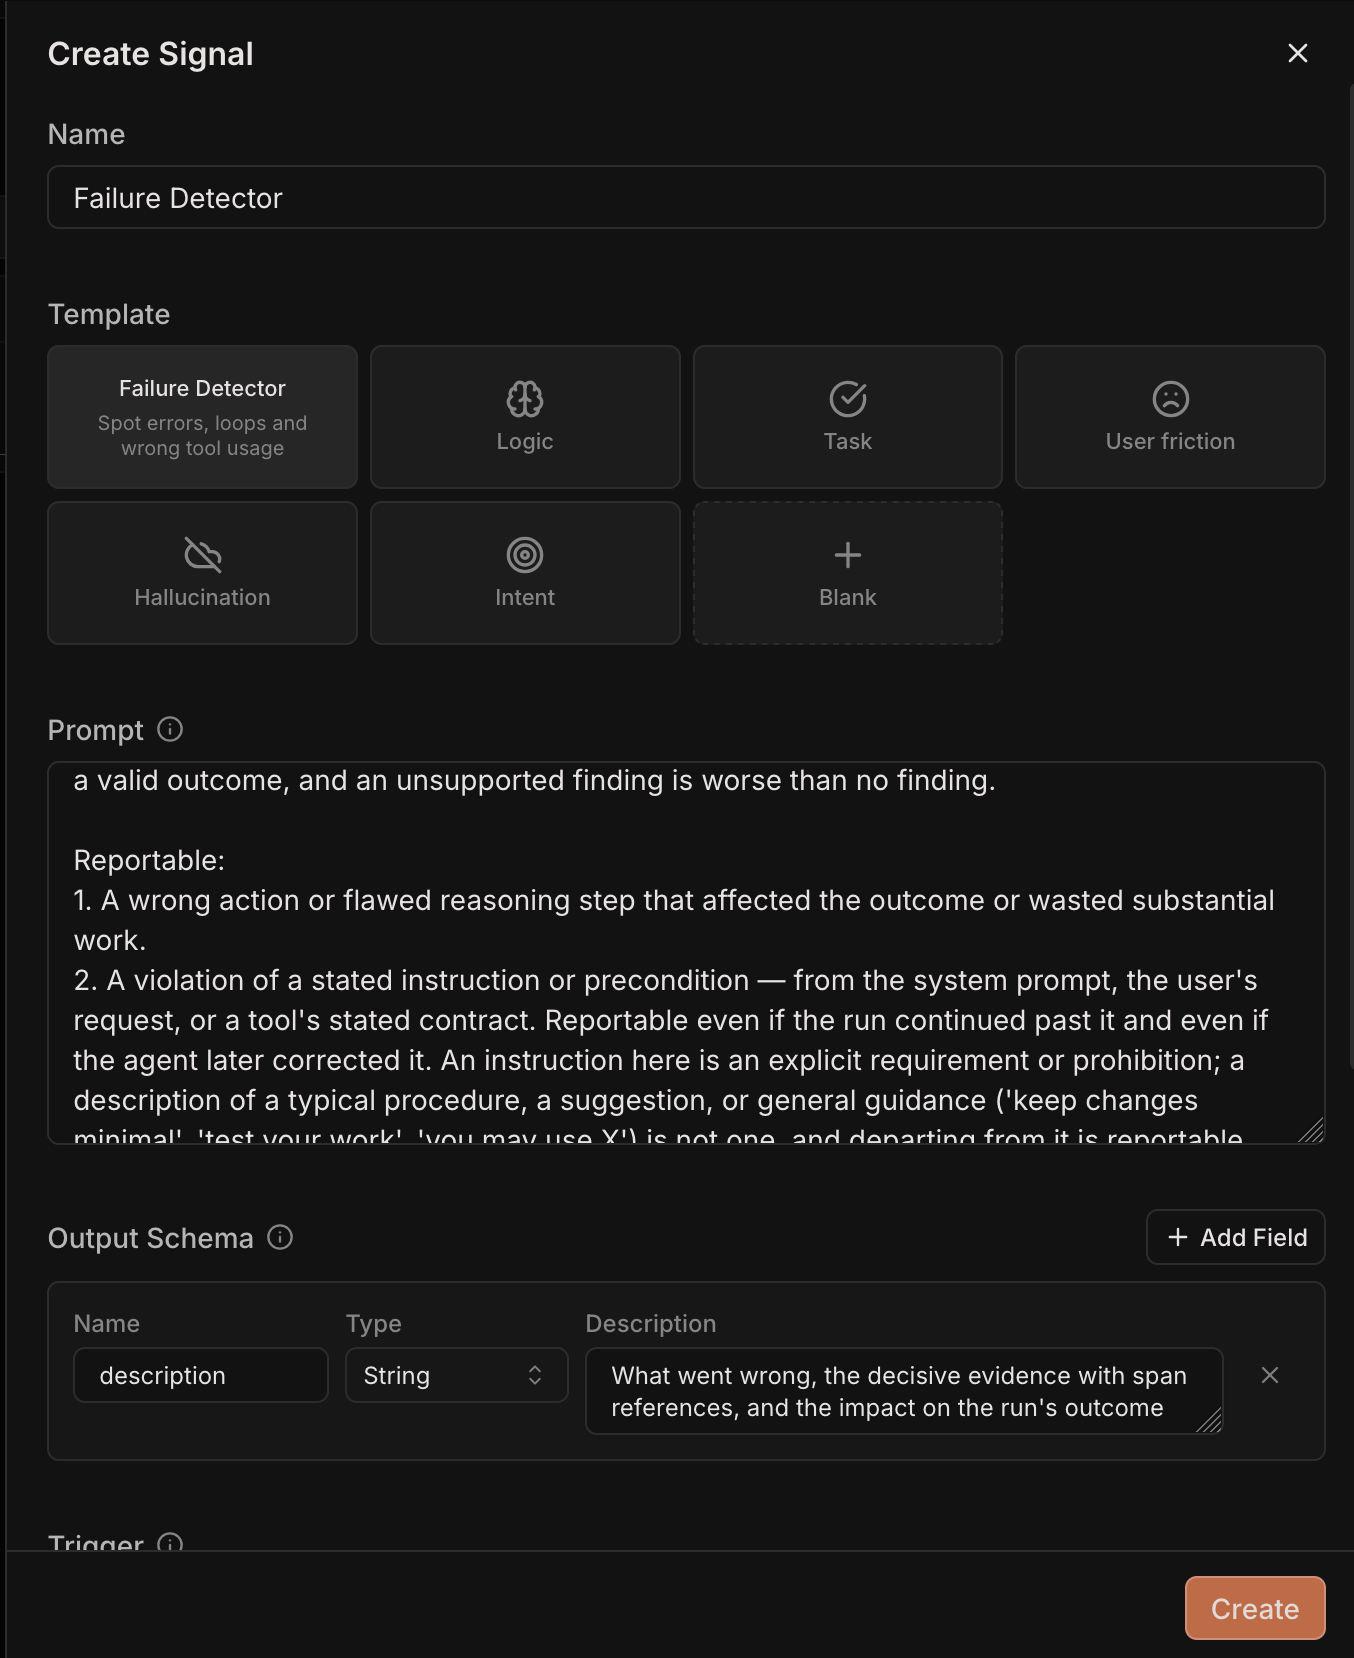
Default prompt and structured output schema for Failure Detector signal
description of type string, where Laminar Signals
agent can write the description for each failure it detects.
Prompt and schema configuration
Laminar’s default template prompts are tuned to work best for most of the usage scenarios. However, if you wish to tune the prompt or the structured output schema for the signal, you can:- Amend the prompt slightly, or completely change it;
- Add other fields to the structured output schema;
- Alter fields’ types. Each field can be one of string, number, boolean, or a predefined enum.
Signal configuration
Understanding triggers
Trigger defines the moment Laminar reads the trace. It answers the question: when the trace is ready for Laminar to start processing it for Signals. The default is when the root span finishes, which is often when the run is over. This is suitable for the vast majority of use cases. However, there are certain cases when you want to trigger on a different condition. Common examples include:- distributed tracing with fire-and-forget-style invocation, where you create a span inside the request handler, pass the context downstream, and close the span immediately, and
- setups where your trace may end abruptly because of mechanical errors (e.g. network timeout) and you are not interested in analyzing such traces with Signals.
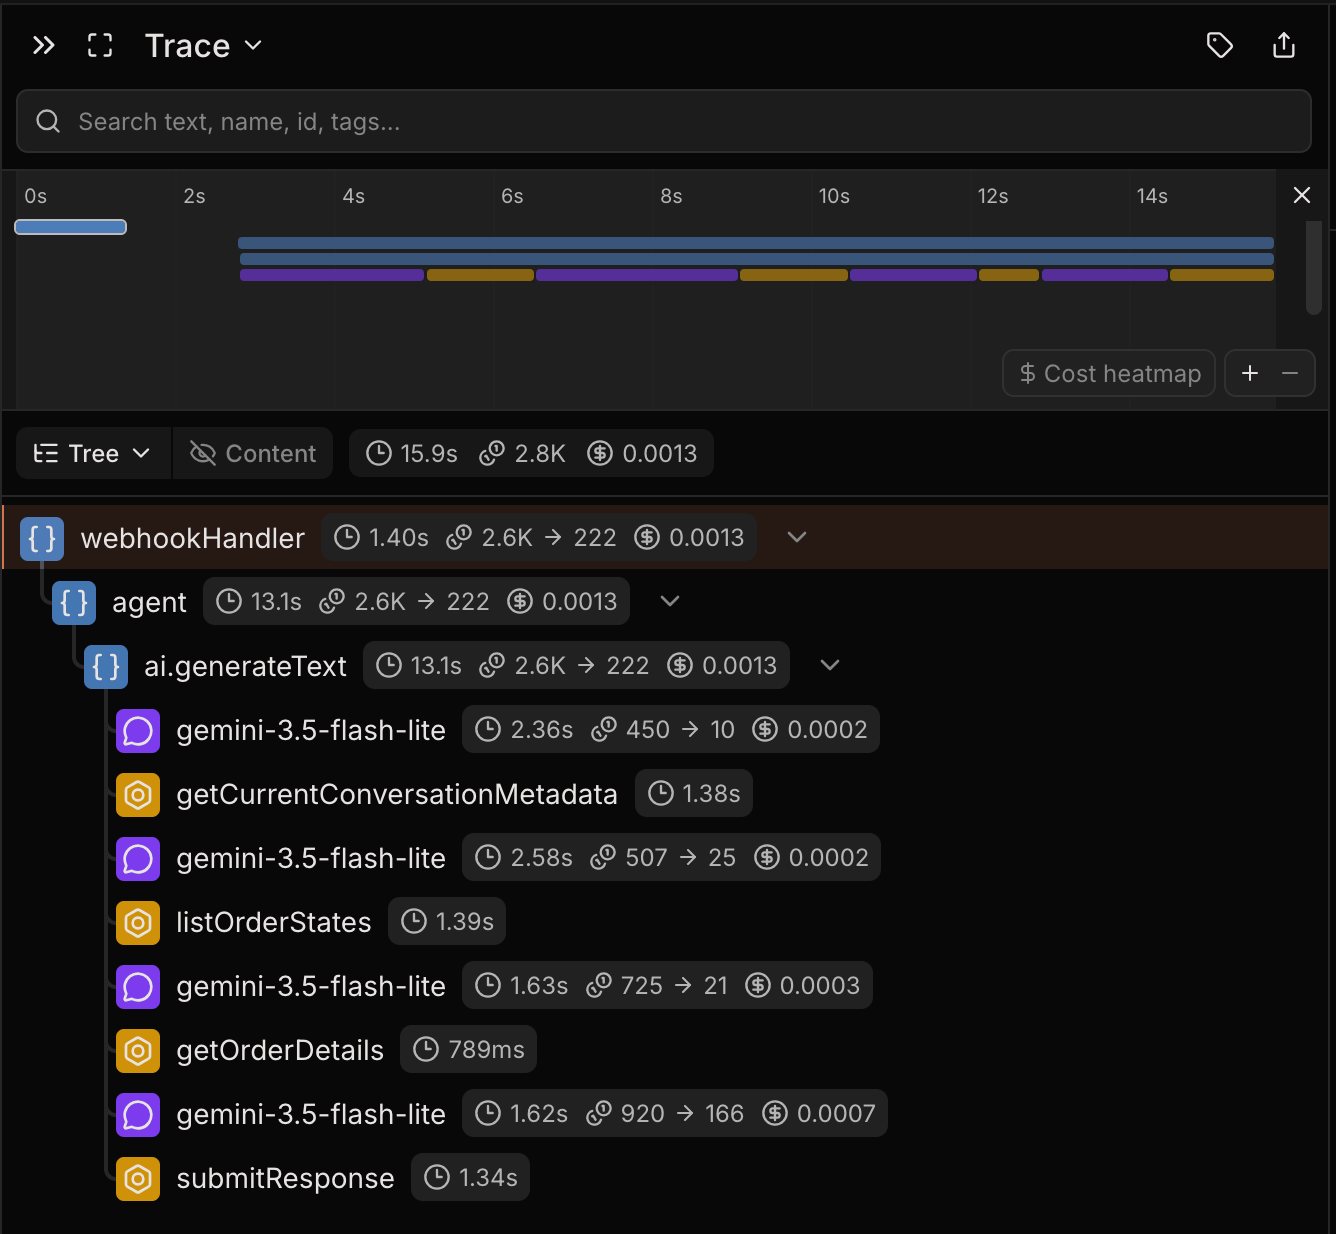
Trace where root span ends before the rest of the trace
agent span
are children of the webhookHandler span, they start and end way after their root has ended on the timeline.
Using the default trigger that evaluates the signal as soon as the root span finishes would not work
here: Laminar would start processing the trace before the agent starts and before any meaningful information
arrives at Laminar. A much more appropriate trigger for a signal on such trace would be “A span with name
submitResponse finishes.”
Understanding filters
Filters are checked against the trace once the trigger has fired. This is needed to further narrow down the analysis to only the traces you are interested in. From Laminar’s point of view, filters look like:I know the trigger fired, so this trace is ready for processing, but should I do it, or should I skip it?The default filter is
total tokens > 1000, which is a permissive filter that includes every
trace that had any real LLM processing.
Filters help you limit the analysis to only traces with certain features. These features could be
implicit (tokens, status), i.e. inherent properties of a trace, and explicit (span names, tags),
i.e. the ones that can be controlled from code, depending on the instrumentation.
Example use cases that filters support:
- I want to run signals only if my run consumed abnormally many tokens;
- I want to see how my agent recovers from application errors, so I want to run it only if there is an errored span in the trace;
- On the contrary, I don’t want signal runs to produce noise on application errors, so filter only for traces without error spans;
- I want to analyze only the traces tagged with “my_custom_tag”;
- I want to analyze only the traces that have a span named “flaky_context_operation”.
getOrderDetails, so that we can investigate why the agent did not
call the tool that it is required to call before it submits the final response.
Instrumentation affects the quality of your signal
Laminar Signals work best on traces that follow Laminar’s tracing best practices. Here’s a minimal requirements list for the trace to be analyzed well by Signals:- Most important: correct span types.
- Make sure your LLM spans get annotated with the LLM span type and a correct icon. This should pretty much happen by default provided you use Laminar’s SDK and integrations, but if you are using manual instrumentation, set
lmnr.span.type=LLMattribute. - Non-LLM spans should be marked correctly too. Tool calls are of span type
TOOL. Everything else is of span typeDEFAULT.
- Make sure your LLM spans get annotated with the LLM span type and a correct icon. This should pretty much happen by default provided you use Laminar’s SDK and integrations, but if you are using manual instrumentation, set
- Correct shape of input and output. There are many conventions on the formats of inputs and outputs. Good rule of thumb: as long as the input and output is correctly seen and prettified in the Laminar UI on an LLM span, it will be processed well in Signals.
- Payloads are not truncated. It could be that your agent saw the full payload, but for some reason the span’s recorded data is truncated. Laminar Signals are tuned not to pay too much attention to such issues, but obviously partial data will affect the quality negatively.
- Proper nesting. Ideally one top-level span per agent or subagent.
- A separate
TOOLspan for every tool call, including when tool calls are made in parallel. Even if you are not using the “tool calling” feature of your LLM API, and use some kind of structured output parsing, we still recommend that whatever action your agent performs is instrumented by a tool span.- You will rarely need more than a single span for a tool call. If you absolutely need to, you can mark children of tool spans as any type. Yet, if they are mechanical (i.e. not another LLM-powered subagent), we recommend using
DEFAULTtype.
- You will rarely need more than a single span for a tool call. If you absolutely need to, you can mark children of tool spans as any type. Yet, if they are mechanical (i.e. not another LLM-powered subagent), we recommend using
Getting insights from running signals in production
Clustering
When similar signal events accumulate creating groups of a certain size, we start clustering them together. This is the highest-level overview of what’s going on in traces inside your project. Clusters will depend a lot on the signal definition. For example, Failure Detector signal will classify / cluster different kinds of failures, while User Intent signal will show the distribution of usage patterns of your agent. Clustering is fully automatic, so no additional configuration is needed. You can also be alerted on new clusters.Alerts
When you create a new signal, by default, you get alerted on every new event that we believe is critical. This is the first place you will start getting information from. This is useful both in development, when you run your agent against a scoped set of possible inputs, and in production, where you want to get alerted on every critical error your customer may face because of inefficiencies in your agent. If your agent runs on tens of thousands of user inputs daily, it is infeasible to get alerted on every critical event, as there will still be hundreds. For those cases, we suggest getting alerted on new clusters, which is also enabled by default. As with new event alerts, you can set who on your team gets notified about new clusters. Alerts are sent to all members that are in the workspace at the time the signal was created. New users can sign up for alerts in the signal settings page. Each alert can be subscribed to by one or more destinations (email addresses or Slack channels), so you can have fine-grained control over who on your team gets notified about what. Learn more about alerts.Narrowing down your signal
Unless you already know how your agent will fail (and why would you release such an agent to production before fixing it?), the best practice is to start with a general signal, such as our predefined Failure Detector template, let it run for a few days or weeks in production, and then create more specialized signals based on the clusters and patterns you see in the general signal. The more complex your agent is, the more diverse and unpredictable the findings will be, and thus, the more value you will get from using this approach. It does not mean that this is not the right approach for simpler agents: all agents are powered by LLMs, and LLMs are non-deterministic by nature, so there is no way to foresee all the quirky ways in which your agent could fail. For example, Failure Detector cluster could split the clustering space into 2 high-level clusters:- API 400 and request shape errors
- Hallucinated final report details
End-to-end example. Travel Planner agent
For the purposes of this guide, we ran signals over traces of a travel planner agent application. We ran it over a thousand different tasks of planning and budgeting travel itineraries based on certain constraints. An example task to the agent:Could you devise a 7-day travel plan for two people, starting in Las Vegas and touring 3 cities in Idaho from March 4th to March 10th, 2022? Our budget is set at $5,100. We require accommodations that allow smoking and should ideally be entire rooms. We would prefer to avoid any flights for our transportation.All the information that the agent is supposed to use is loaded into its context and the final plan must adhere to a specific format.
Configuring and running a broad signal
At first, we did not anticipate any specific kind of error, so we created a general “Failure Detector” signal. The definition is intentionally broad, and set to catch any kinds of errors. Since we already had the traces handy, and this is not our real production traffic, we ran the backfill selecting all 1,304 traces in the project.Looking at the result clusters and individual events
Once the results are ready, let’s look at the clusters hierarchy.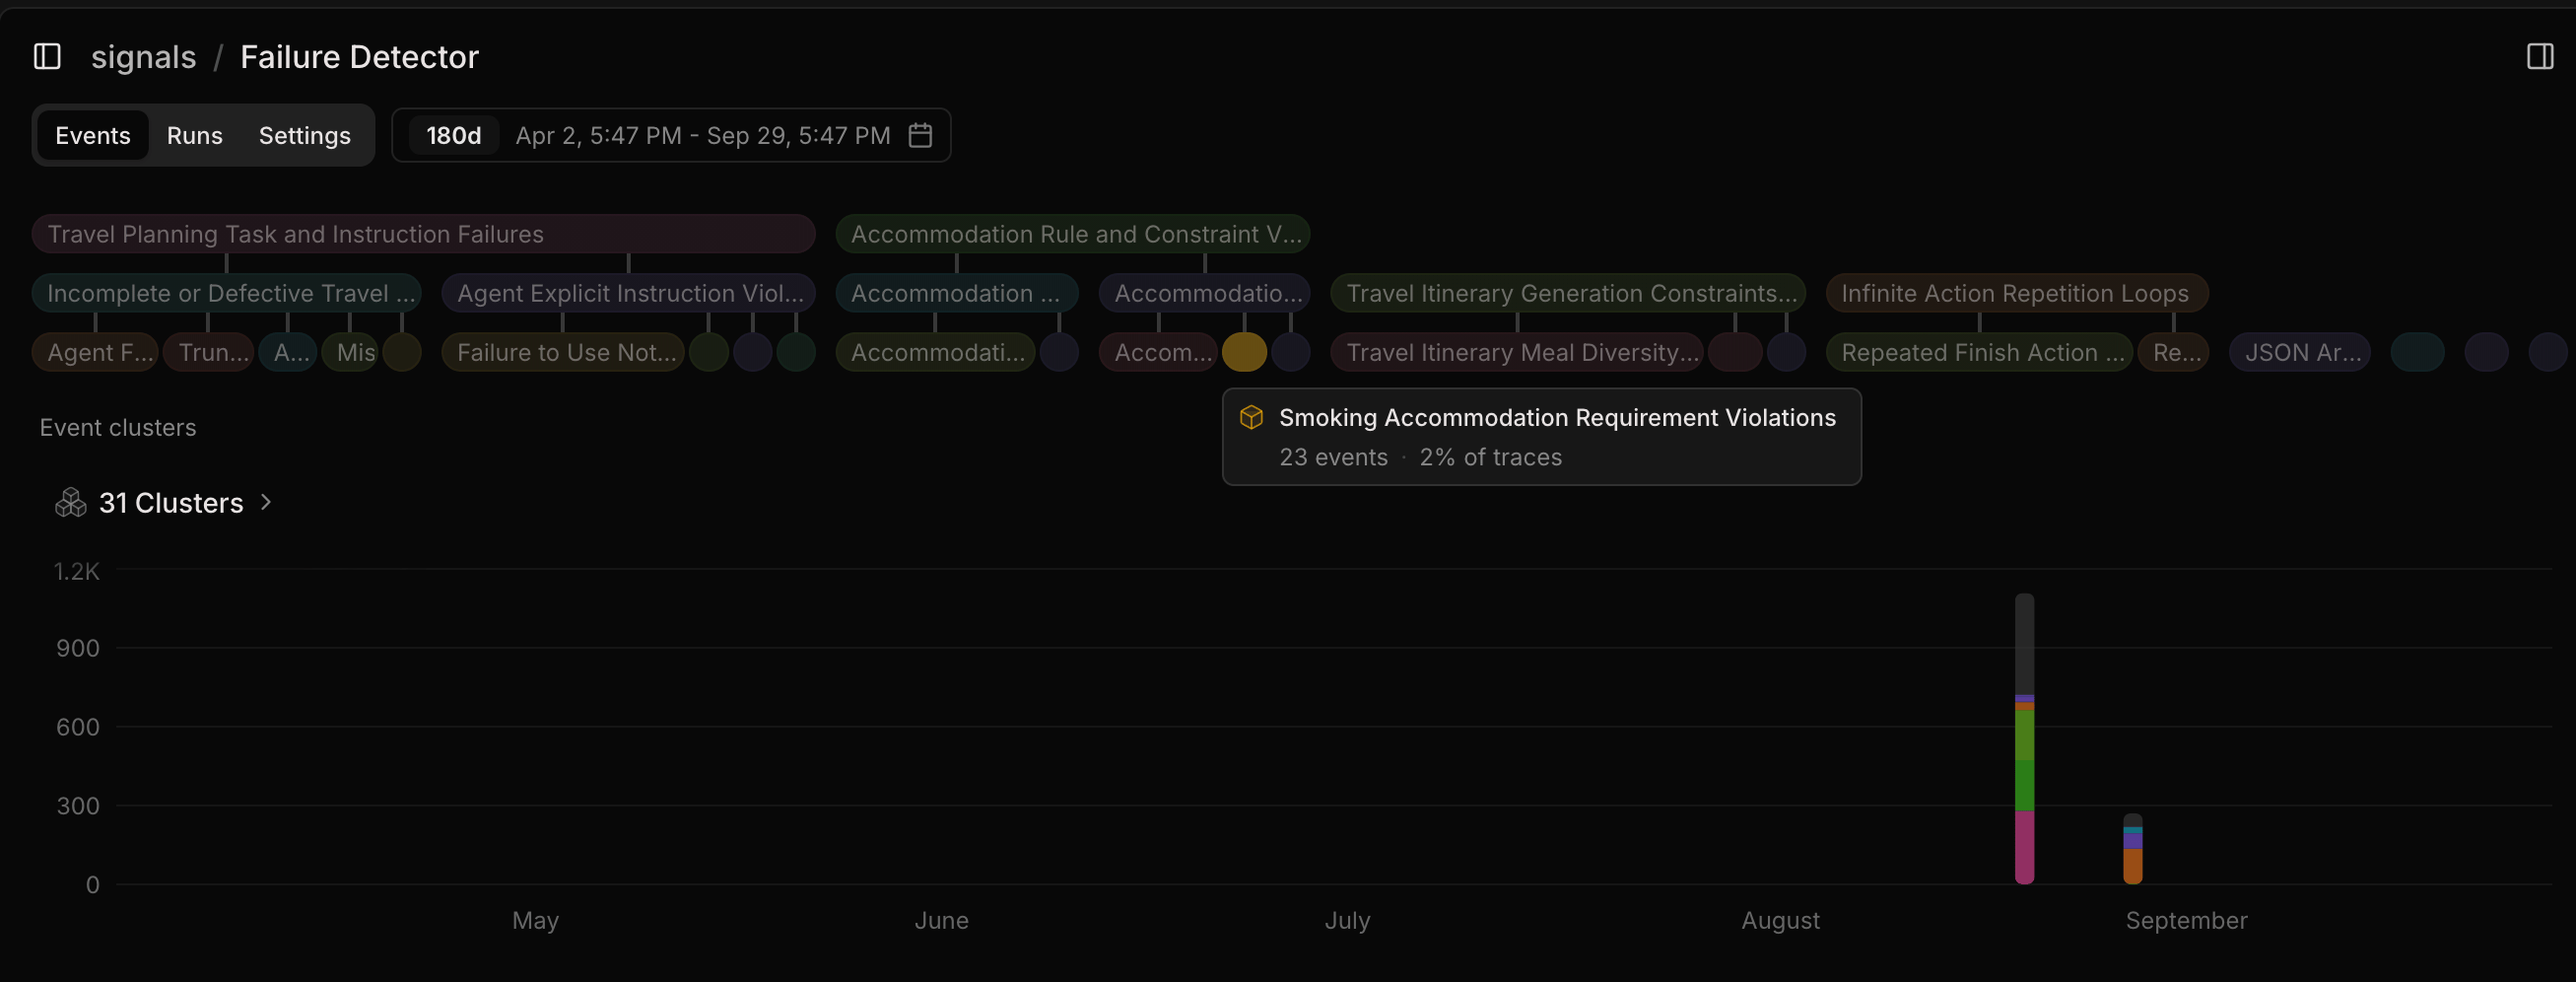
Cluster distribution for the traces of the travel agent
The agent produced a complete 7-day plan via Finish, but the final deliverable contains an error. […] The user’s request states: “We would prefer accommodations with smoking house rules.” The agent acknowledged the preference […], but the final plan books [hotels], none of which have any smoking mention in their house rules. The final plan also contains no note of the deviation the agent said it would include, so the user is not told their preference was not met.Other interesting example clusters include “Missing Return Transportation in Itinerary”, “Accommodation Minimum Night Stay Violations”, “Travel Itinerary Meal Diversity Violations”. But not all clusters are based on the poor quality of the final deliverable. Several clusters catch errors that are much more mechanical. For example, “Truncated Travel Itinerary Deliverables”, “Repeated Finish Action Loops”, and “JSON Array Output Instead of Finish Action”. Some of this is fixable by a code change. For instance, if the agent returns an array instead of a final tool call, or calls the same action twice, this can be caught by deterministic checks in code and corrected in place. The call can be retried, possibly using additional prompt instructions, such as
Your requirement is to call the finish tool, but you returned the final action as a JSON. Fix it by
calling the tool
Creating a narrower Signal after analyzing clusters
The more high-level issues — such as failure to follow instructions, failure to include all requirements in the final itinerary, or malformed final itinerary — are much harder to catch in place. Now that we’ve had a look at the cluster distribution, it may make sense to create a more specific Signal that looks into a specific class of issues. Let’s create a signal called “Constraint Violation”. The prompt isReport cases where the agent fails to follow instructions and constraints given in the travel plan. This can include explicit failures, like an incorrect number of nights booked, or more implicit issues in the final itinerary, such as overlapping transportation. Do NOT report other issues, such as malformed tool calls.The structured output schema will include two fields: description: String — what went wrong, the evidence with span references. error_type: Enum: MINIMUM_NIGHTS, SMOKING_RULES, HOUSE_RULES, TOTAL_BUDGET, ROOM_OCCUPANCY, MEAL_DIVERSITY, TRANSPORTATION, HALLUCINATION, OTHER