
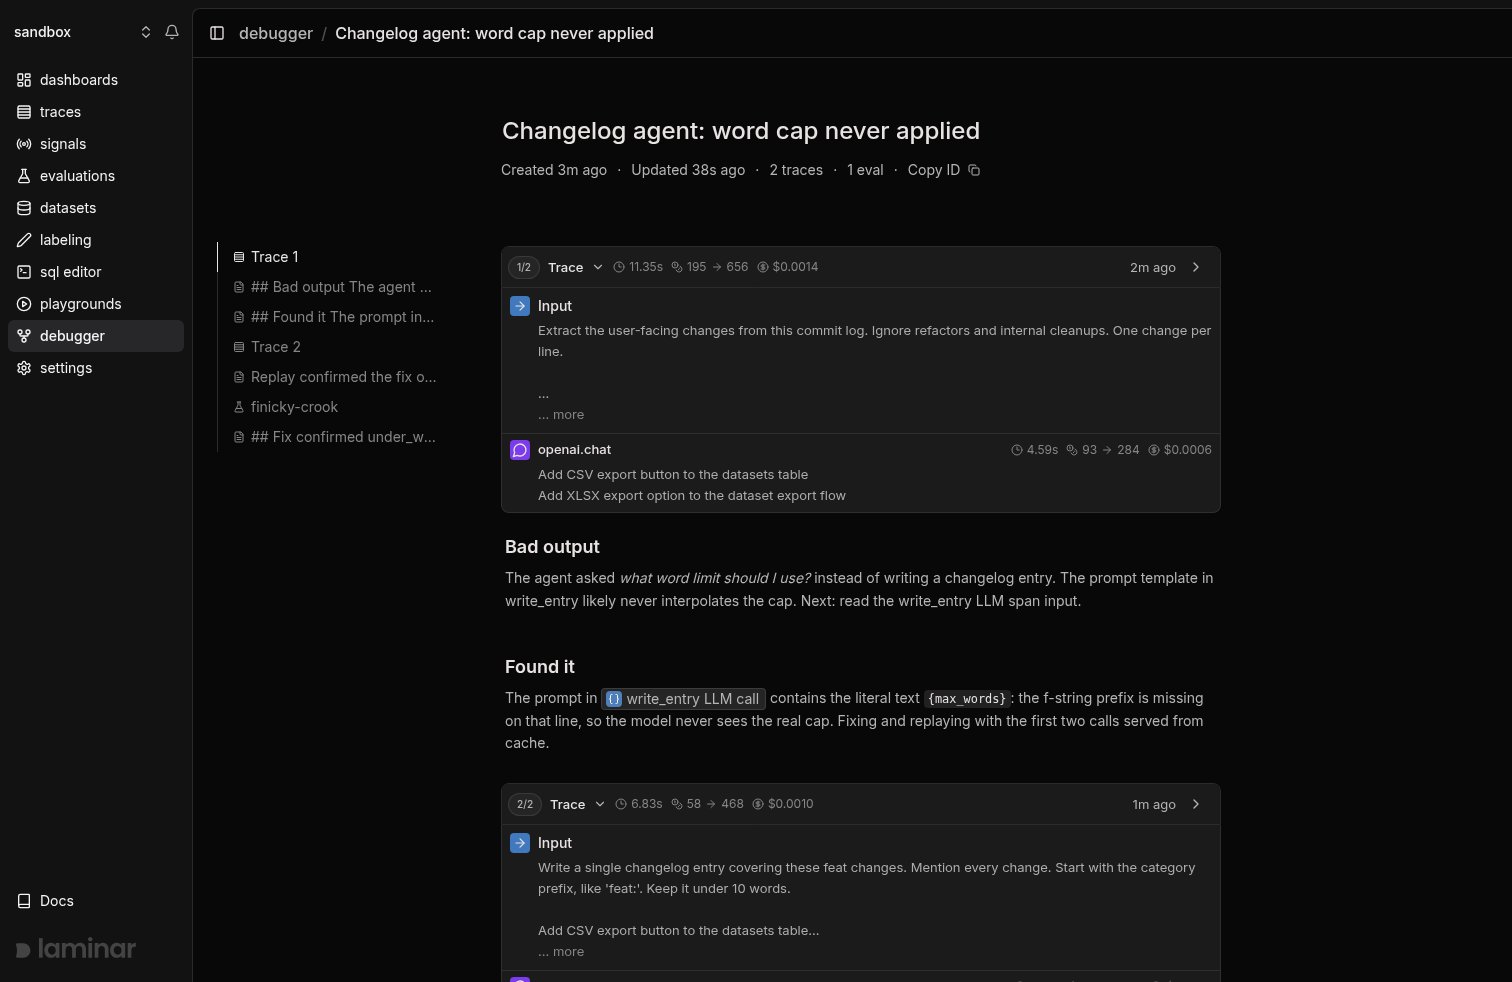
The finished session: two runs, three notes, and an eval card in one timeline. This is what you build in this guide.
The example agent
The agent is a three-step changelog writer: extract user-facing changes from a commit log, classify them, and write a one-line entry under a word cap. It has a planted bug: the prompt inwrite_entry is missing its f-string prefix, so the model receives the literal text {max_words} instead of the number.
agent.py
Laminar.initialize() once, @observe() on each step. Nothing here is debugger-specific; this is normal tracing.
1. Set up the CLI
setup logs you in, links the directory to a project via .lmnr/project.json, and writes LMNR_PROJECT_API_KEY to your env file. See debugger setup for the details. Everything below assumes you run commands from this directory: the debug session commands and the SDK both resolve the session and project from the .lmnr files here.
2. Record the buggy run
Run the agent with debug mode on:LMNR_DEBUG=true run registers a session, opens it in your browser, and writes .lmnr/debug-session.json. The LMNR_DEBUG_RUN line at the end carries the run’s ids; the same payload is saved to the file, so you never copy ids around. Every later run in this directory rejoins the session automatically.
3. Name the session and note what you see
Name the investigation and record the observation before touching anything. The CLI targets the session from.lmnr/debug-session.json, so no session id is passed:
4. Find the broken call with SQL
List the spans of the recorded trace, using thetrace_id from the LMNR_DEBUG_RUN line:
write_entry. Read its input:
{max_words}. Note the finding, referencing the span with an XML tag that the session view renders as a clickable chip:
5. Fix the code and replay
Fix the bug by adding the missingf prefix:
agent.py
LMNR_DEBUG_REPLAY_TRACE_ID is the trace you recorded; LMNR_DEBUG_CACHE_UNTIL is the span id of the last LLM call to serve from cache, which is the classify_change call, the one right before the buggy call. The last two UUID groups are enough:
CACHED spans:
6. Prove it with an eval
A replay shows the fix works on one input. To show it holds in general, run an evaluation under the same session. The eval imports the same agent and scores the output on two axes:changelog_eval.py
LMNR_DEBUG=true resolves the session from .lmnr/debug-session.json exactly like agent runs do, and appears in the timeline as a card with per-score averages.
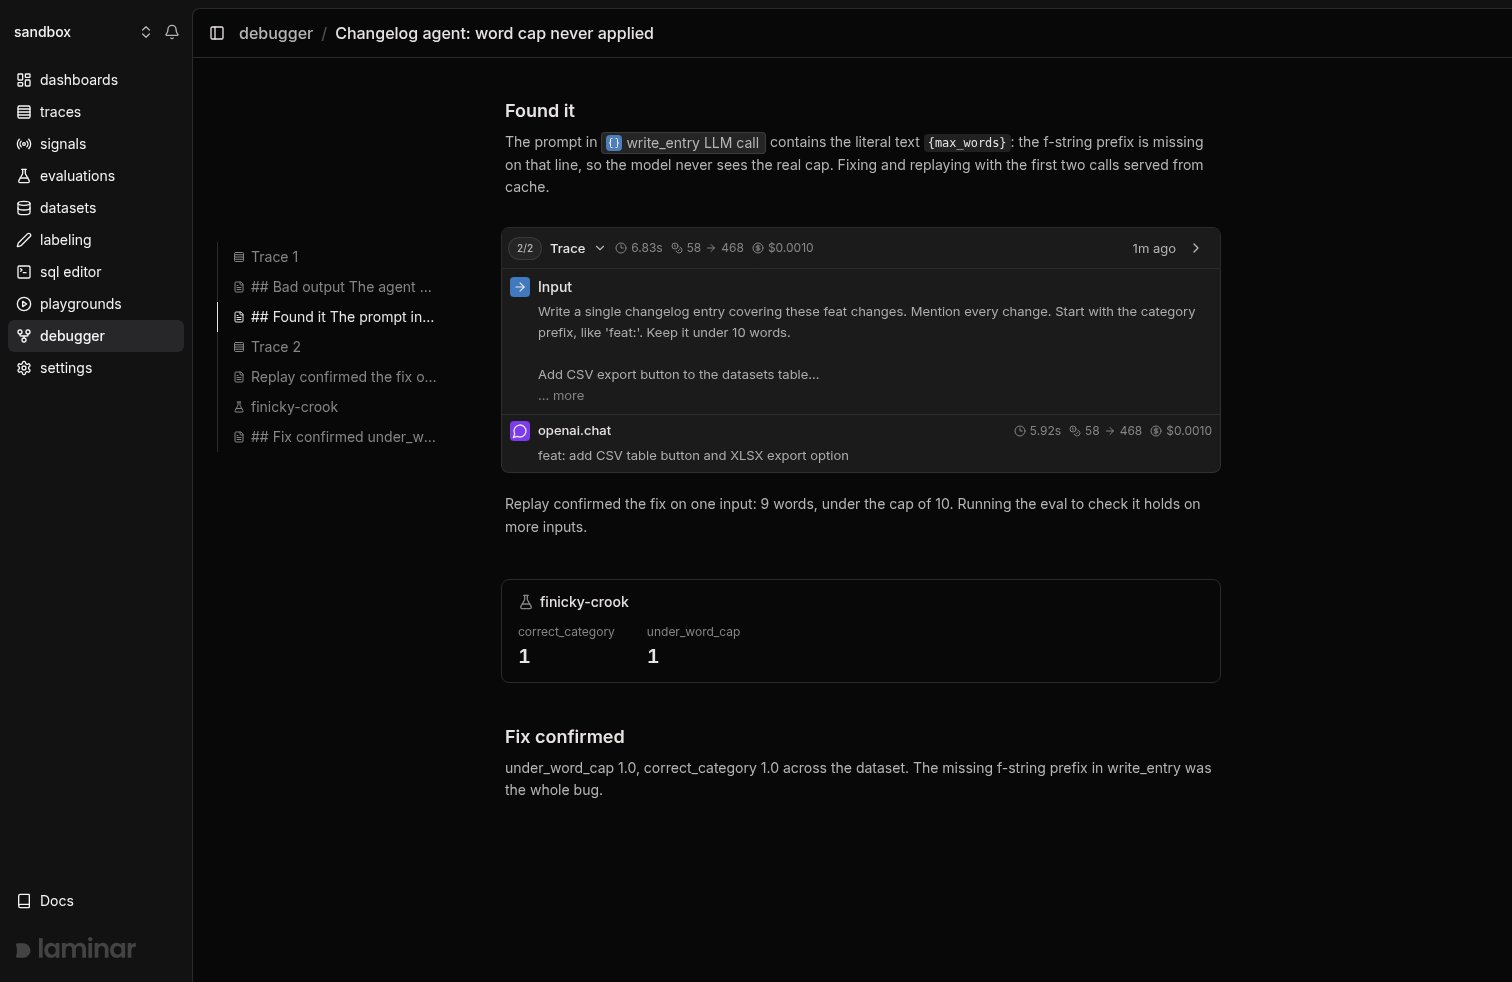
The bottom of the session: the fixed run with its 9-word output, the eval card scoring 1.0 on both metrics, and the closing note.
7. Read the whole story back
debug session summary prints the session’s full timeline, oldest first: traces and evals as self-closing tags, notes as raw markdown. This is how a coding agent re-orients after a context reset, and it reads as the complete story of the investigation:
Hand the loop to a coding agent
Everything in this guide is a CLI command or an environment variable, which is the point: a coding agent can drive all of it. With the Laminar skill installed bylmnr-cli setup, ask Claude Code, Cursor, or Codex to “debug why the changelog agent ignores the word cap” and it runs this exact sequence, record, inspect, fix, replay, evaluate, while you watch the session view fill in.
What’s next
The debugger process
The reference for every step in this loop, including all environment variables.
How caching works
What gets cached, the input hash, and which integrations support replay.
Evaluations
Datasets, executors, evaluators, and comparing runs over time.
Browser Use debugger
The same loop applied to a slow browser agent, where replay saves the most time.