
Transcript view
Transcript view presents an agent trace as a conversation rather than a tree of span names. Laminar auto-extracts the agent input, the LLM turns, the tool calls, and the subagent invocations, and lays them out top-to-bottom so you can read what happened instead of click-hunting for it. It is the default view on every trace.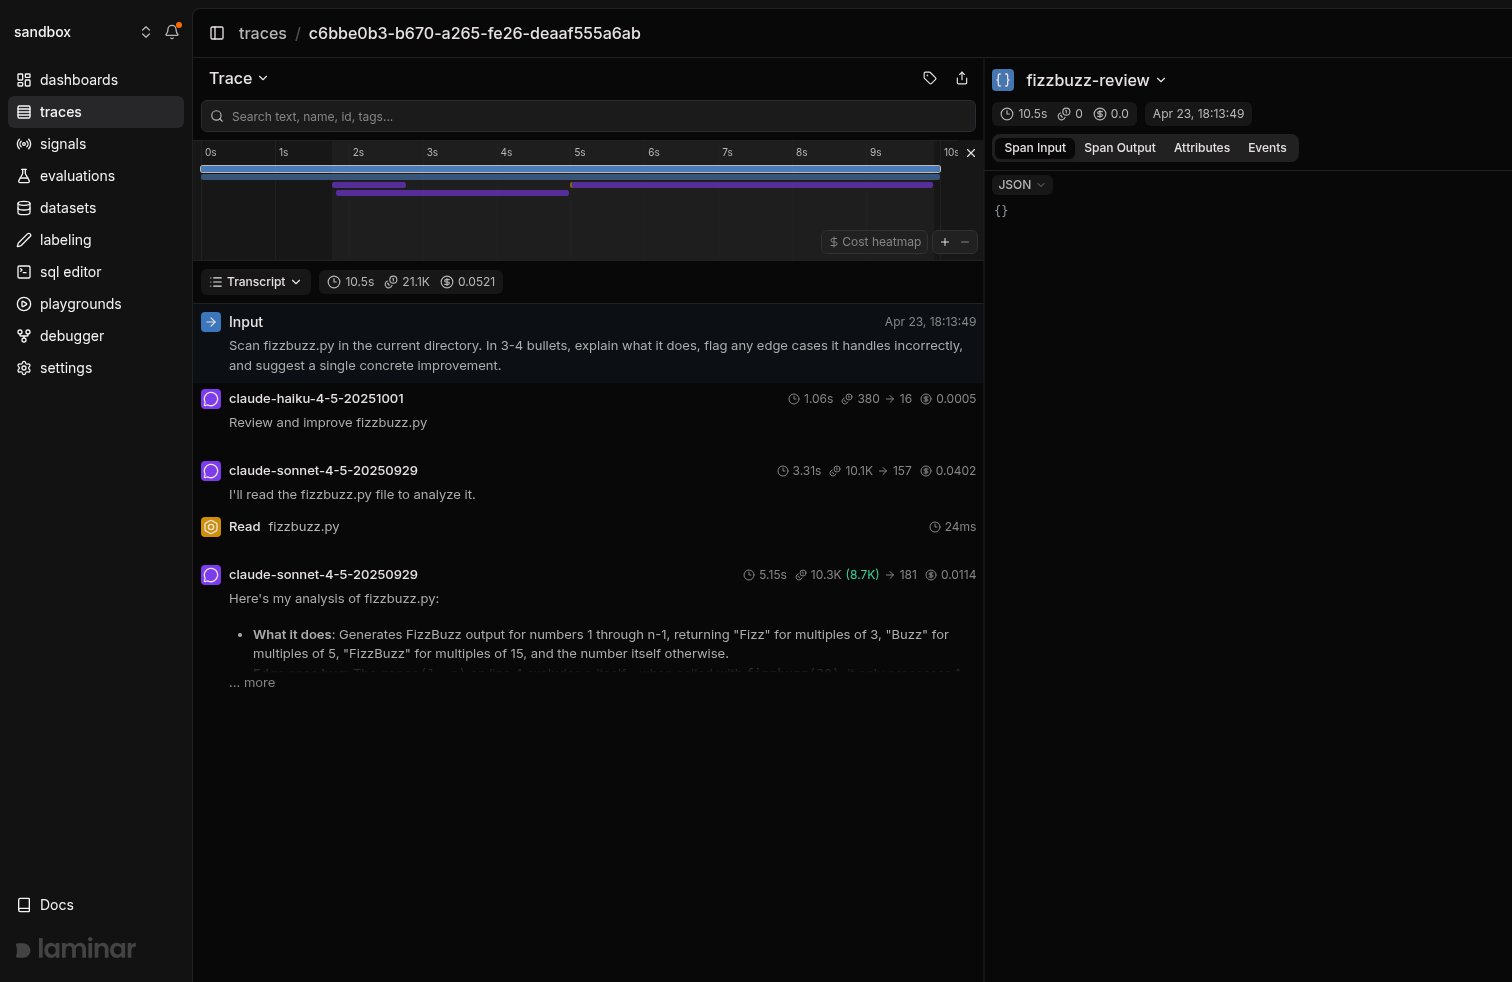
Transcript view of a single-agent fizzbuzz review: the input, two LLM turns, and a Read tool call laid out in reading order.
Why transcript, not a span tree
A span tree gives every row equal visual weight: the outer agent span, its query span, the planning LLM turn, each tool call, and every nested subagent are all just rows. On a long trace (six to ten subagents, dozens of tool calls) you end up scrolling an outline to reconstruct what the agent actually did. Transcript view flips that: it shows the agent input, the LLM outputs, the tool-call arguments and results, and each subagent as a single collapsed card. Spans that exist only to hold children (wrappers, framework internals) are elided from the reading flow. The decision you care about when debugging an agent (what did it see, what did it decide, what did it call) is what transcript view surfaces first.Inputs to every agent and subagent, surfaced for free
The input to the root call and to each subagent is parsed out of system and user messages and rendered inline as a labelledInput block. You do not need to instrument anything: any OpenAI- or Anthropic-style chat completion is parsed automatically, and Laminar will surface the task prompt even when it is buried many messages deep in the request.
This matters most when you are reading a trace that someone else wrote, or a trace from a run you started three days ago. Before transcript view, recovering what did we actually ask this agent to do? meant opening the first LLM span, finding the input JSON, expanding the messages array, and scrolling to the last user message. Now it is the first thing on the page.
Subagents are cards, not a flood of spans
Multi-agent runs (Claude Agent SDK, OpenAI Agents SDK, LangGraph, custom orchestrators) produce deeply nested trees. Transcript view collapses each subagent invocation into a named card that shows the subagent’s name, duration, token/cost badges, the Input prompt it was given, and an Output preview of its final message.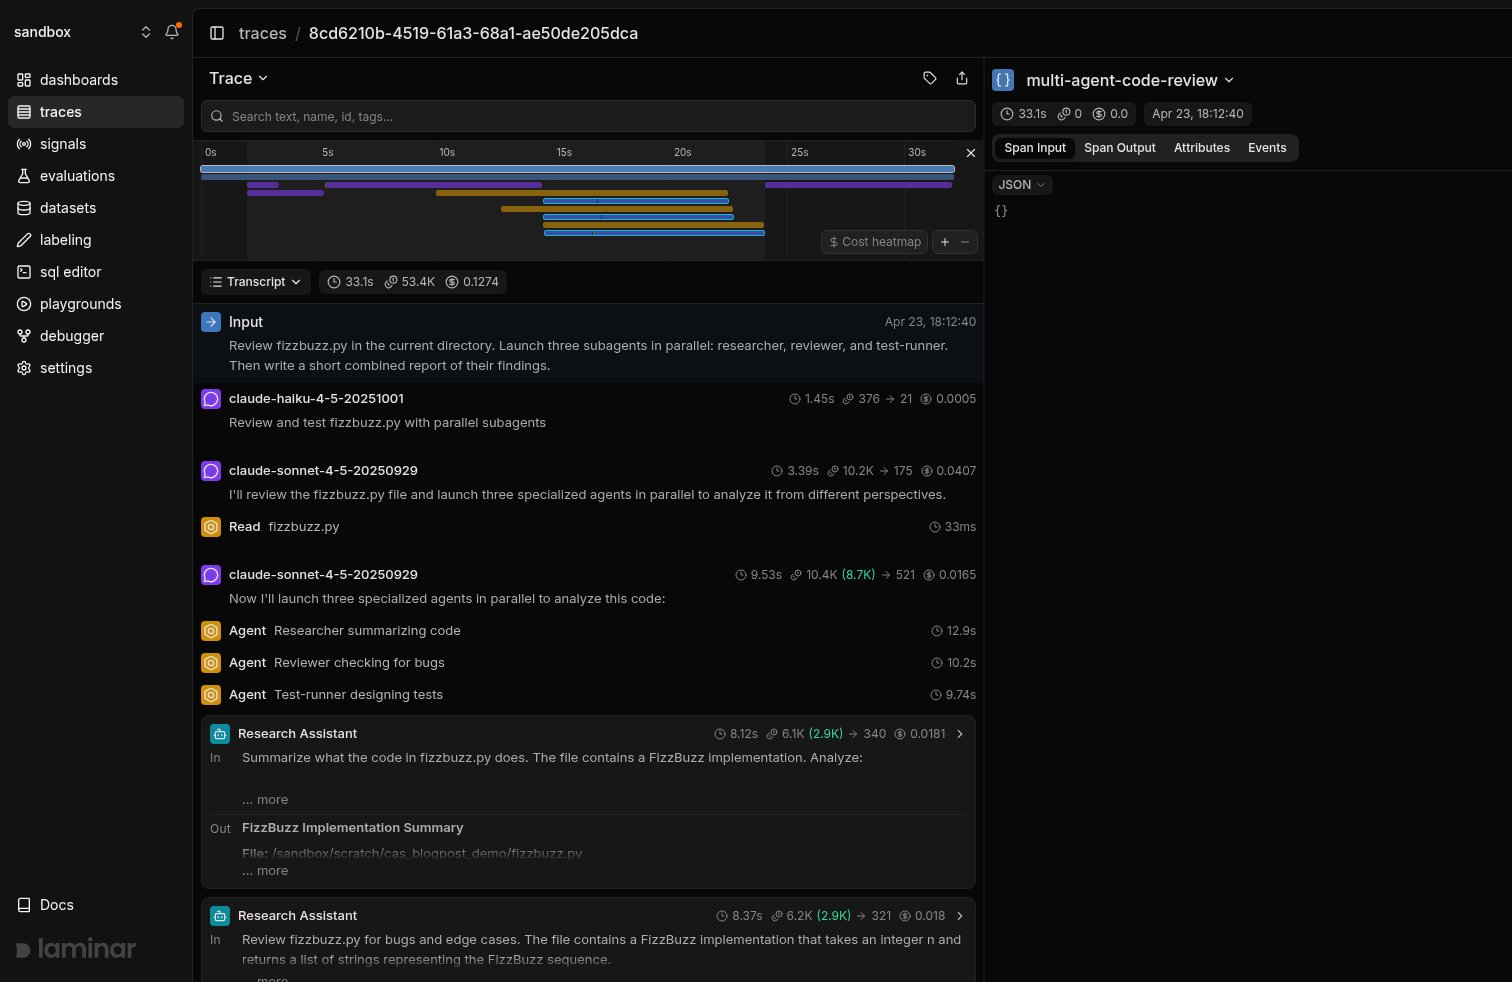
Transcript view of a multi-agent Claude Agent SDK run. Each Code Analyst subagent is a single card with its input prompt and output preview inline. Click a card to expand it in place.
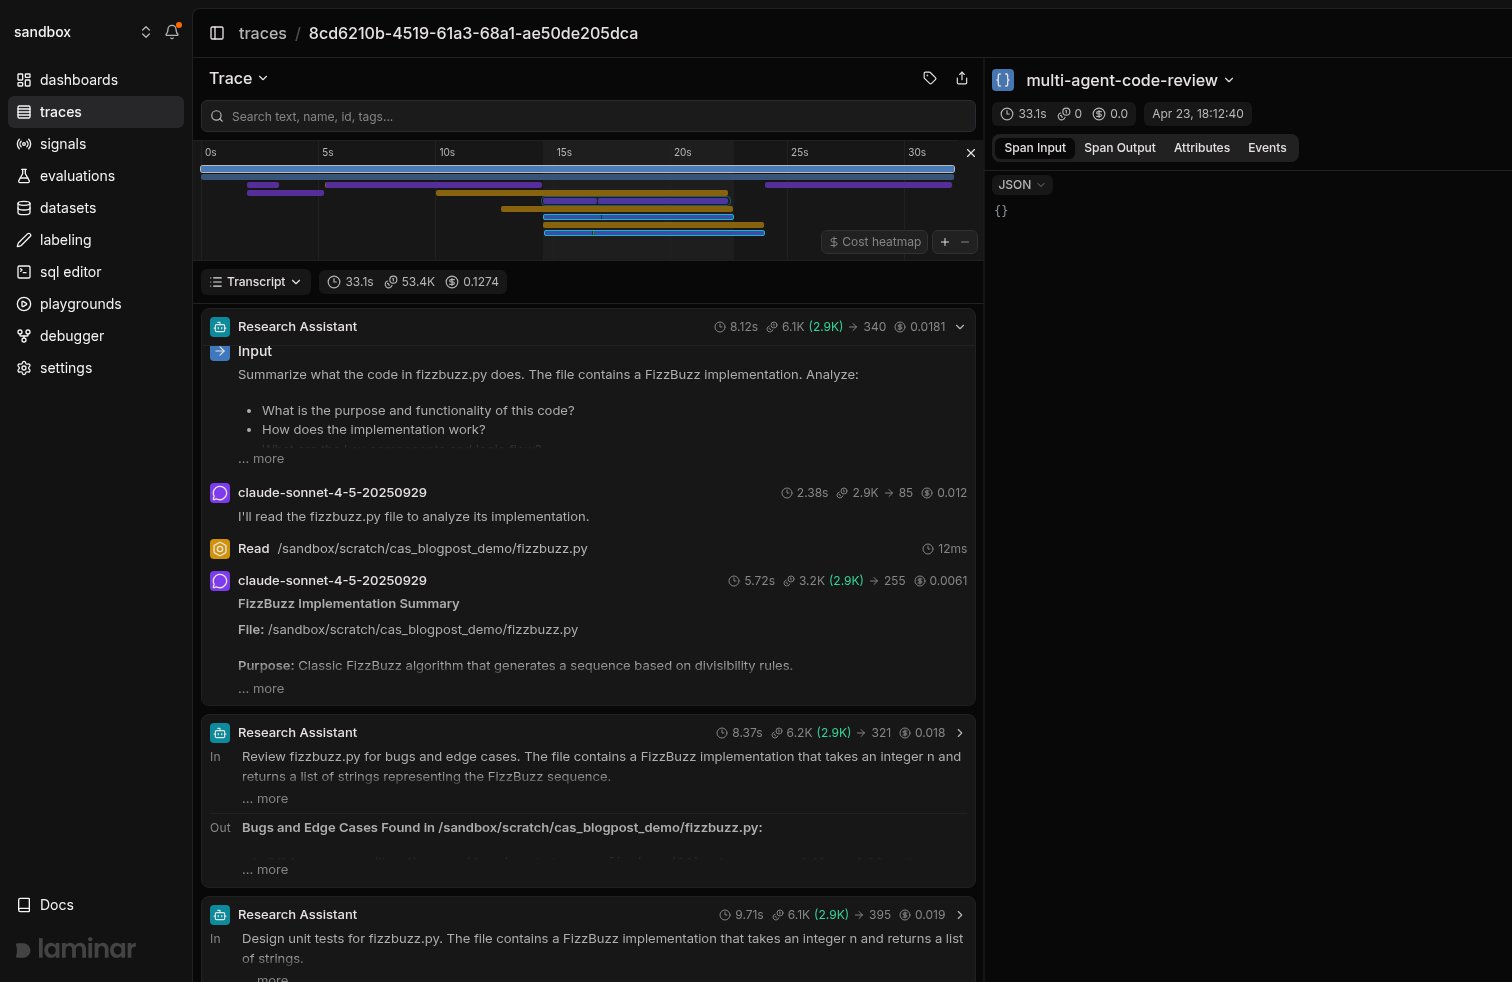
The first Code Analyst subagent card expanded in place. Its Input, the subagent's LLM turn, and the Read tool call it made sit inside the card.
Inline previews on every row
LLM turns and tool calls render a one-line preview next to the row: the first part of the model’s response for an LLM turn, and the first argument or result for a tool call (for example,Read fizzbuzz.py or Read /sandbox/scratch/...). You can scan a long trace and get a sense of what was happening at each step without expanding anything.
Switch between Transcript and Tree
Transcript is the default, but Tree view is one click away and useful when you need to confirm parent/child nesting, debug a custom integration, or inspect span attributes at specific nodes in the hierarchy. Use the view-mode dropdown in the trace toolbar.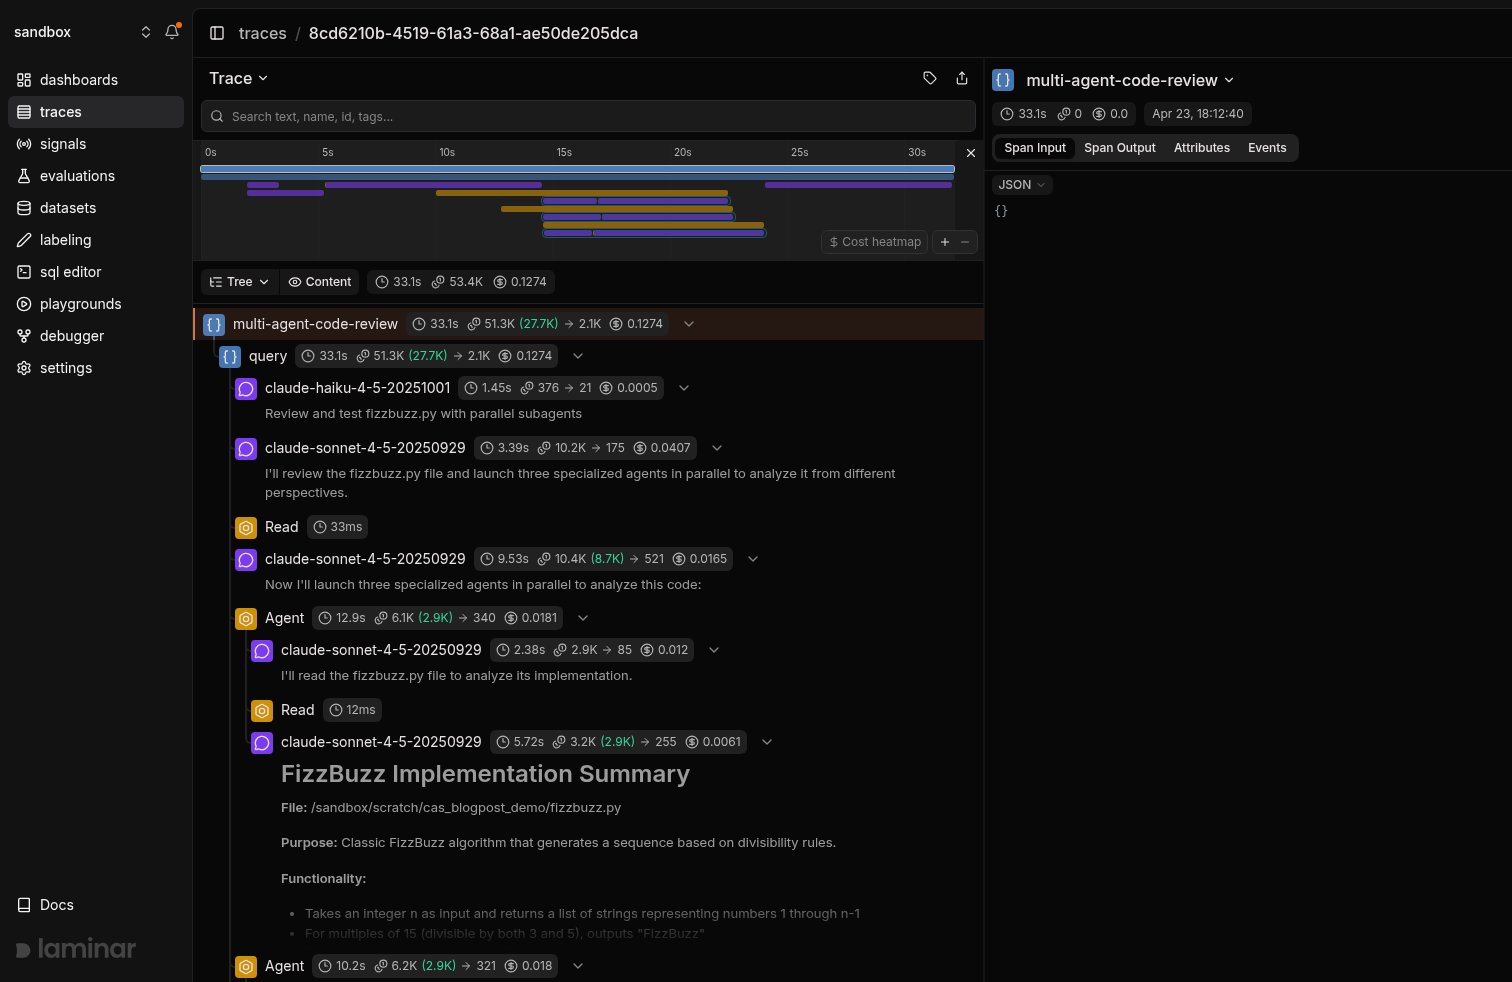
The same multi-agent trace in Tree view: every span rendered as a row, with the three subagents and their children interleaved in the list.
Tree view
Open Tree view
- Open a trace (from Traces).
- In the trace view toolbar, open the view-mode dropdown.
- Select Tree (switch back the same way).
- Hierarchy-first: Shows parent/child nesting so you can follow the trace’s call structure.
- Collapsible branches: Collapse spans with children to hide entire subtrees.
- Inline metrics: Duration on every row; tokens and cost badges on LLM spans.
- Fast navigation: Virtualized list stays responsive on large traces.
- Synced minimap: Jump to spans and scrub the shared session-time cursor.
Custom views with render templates
The same view-mode dropdown lists your project’s trace render templates under Custom. A trace template is a small JSX component plus a SQL filter over the trace’s spans: it receives the matching spans and renders the whole trace however you define, instead of as a transcript or a tree.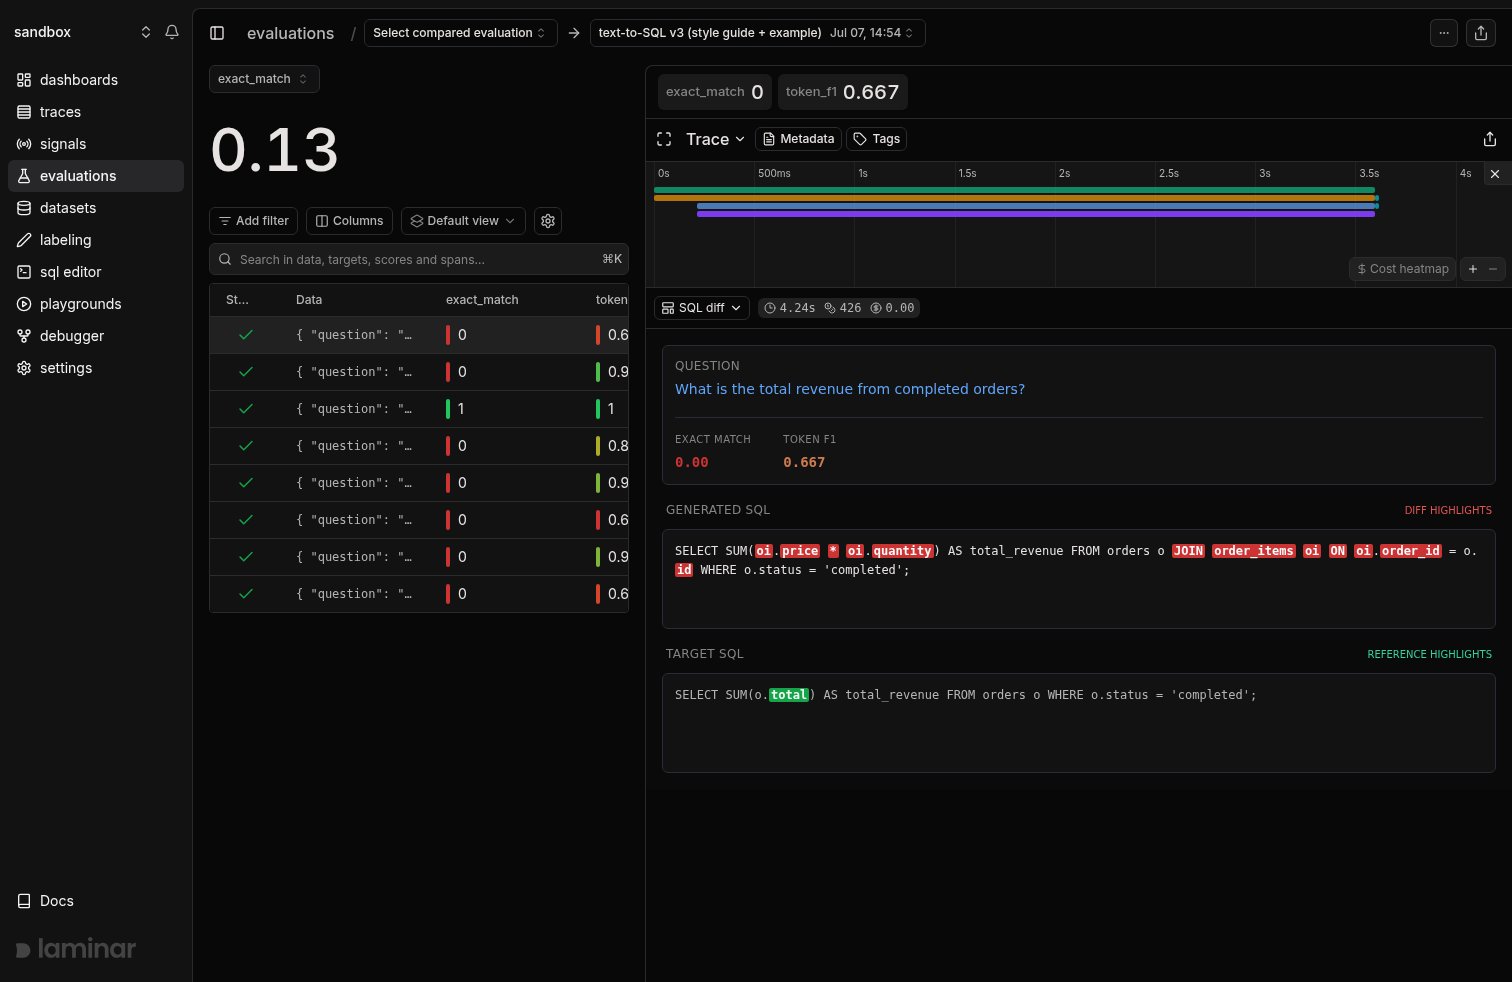
An evaluation trace rendered through a custom SQL diff template: the question, the scores, and a word diff between the model's output and the target, built from the executor and evaluator spans.
Timeline
Open Timeline
- Open a trace (from Traces).
- In the trace header, click the Timeline toggle (Gantt icon) below the search bar.
- The condensed timeline appears at the top of the trace view. Click the toggle again to hide it.
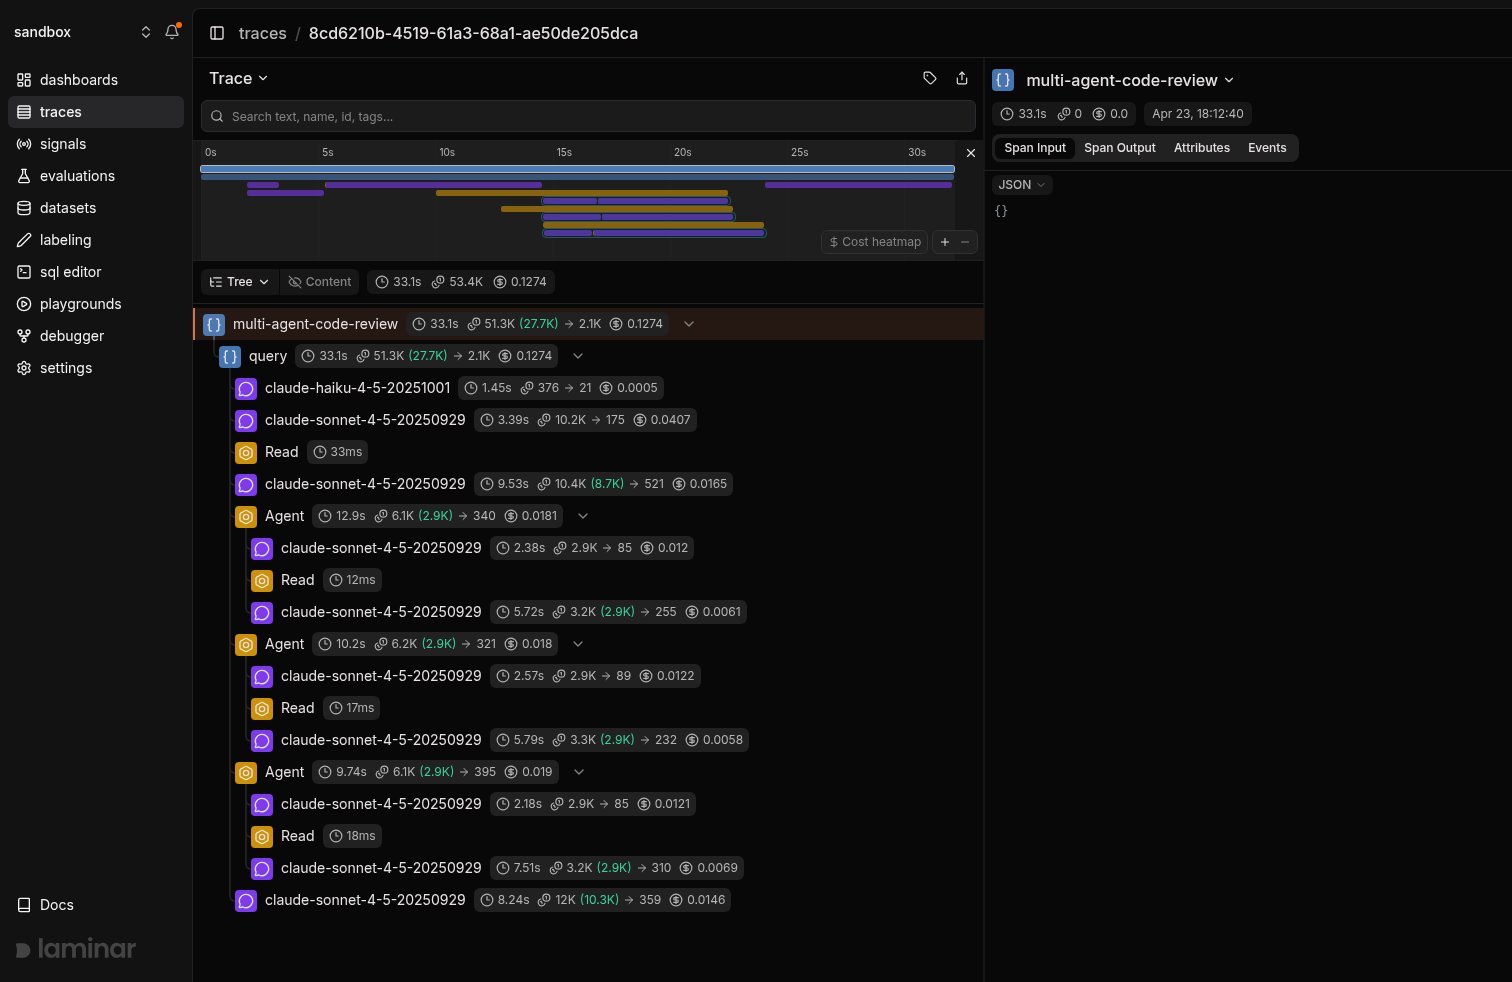
- Time-first overview: Spans render as colored bars on a single time axis.
- Zoom controls: Use the +/- buttons (or cmd/ctrl + scroll) to zoom in and out.
- Hover needle: Move your cursor to see precise time markers.
- Span selection: Drag to select a range; non-selected spans dim and the selection is clearable.
- Session playhead (if available): Shows the browser session position on the timeline.
Metadata
Open Metadata
- Open a trace (from Traces).
- In the trace view toolbar, click Metadata.
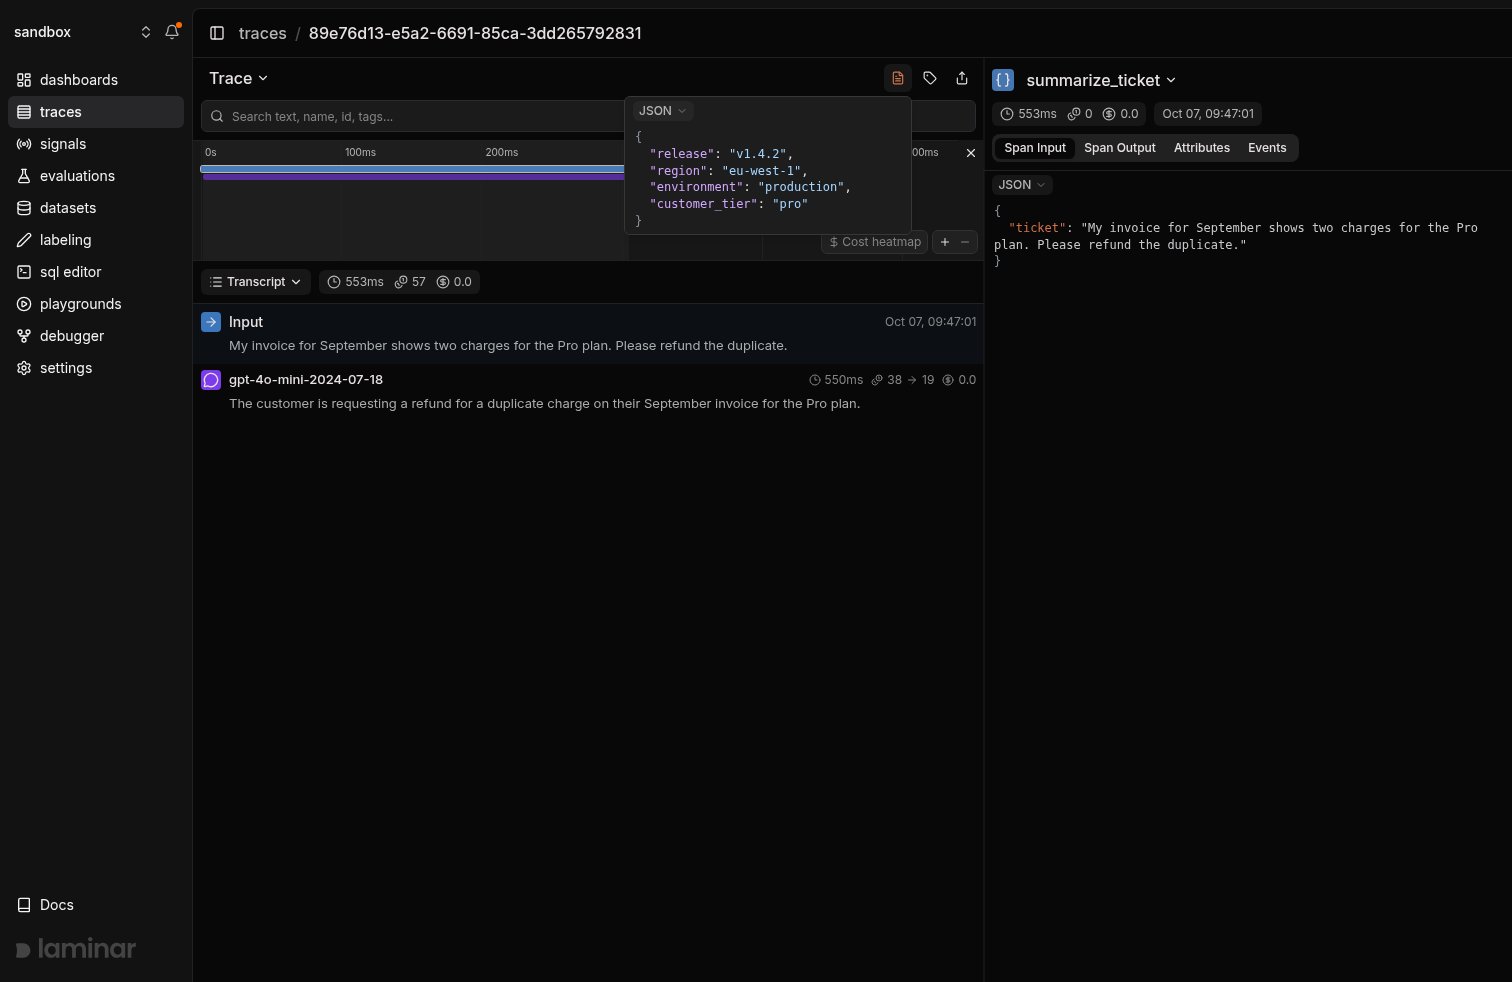
- Read-only source of truth: Shows the trace metadata exactly as stored.
- JSON-first: Defaults to a JSON view with formatting and syntax highlighting.
- Search/copy friendly: Quickly find keys/values and copy raw text as needed.
Chat about a trace
- Open a trace (from Traces).
- In the trace view toolbar, click Chat.
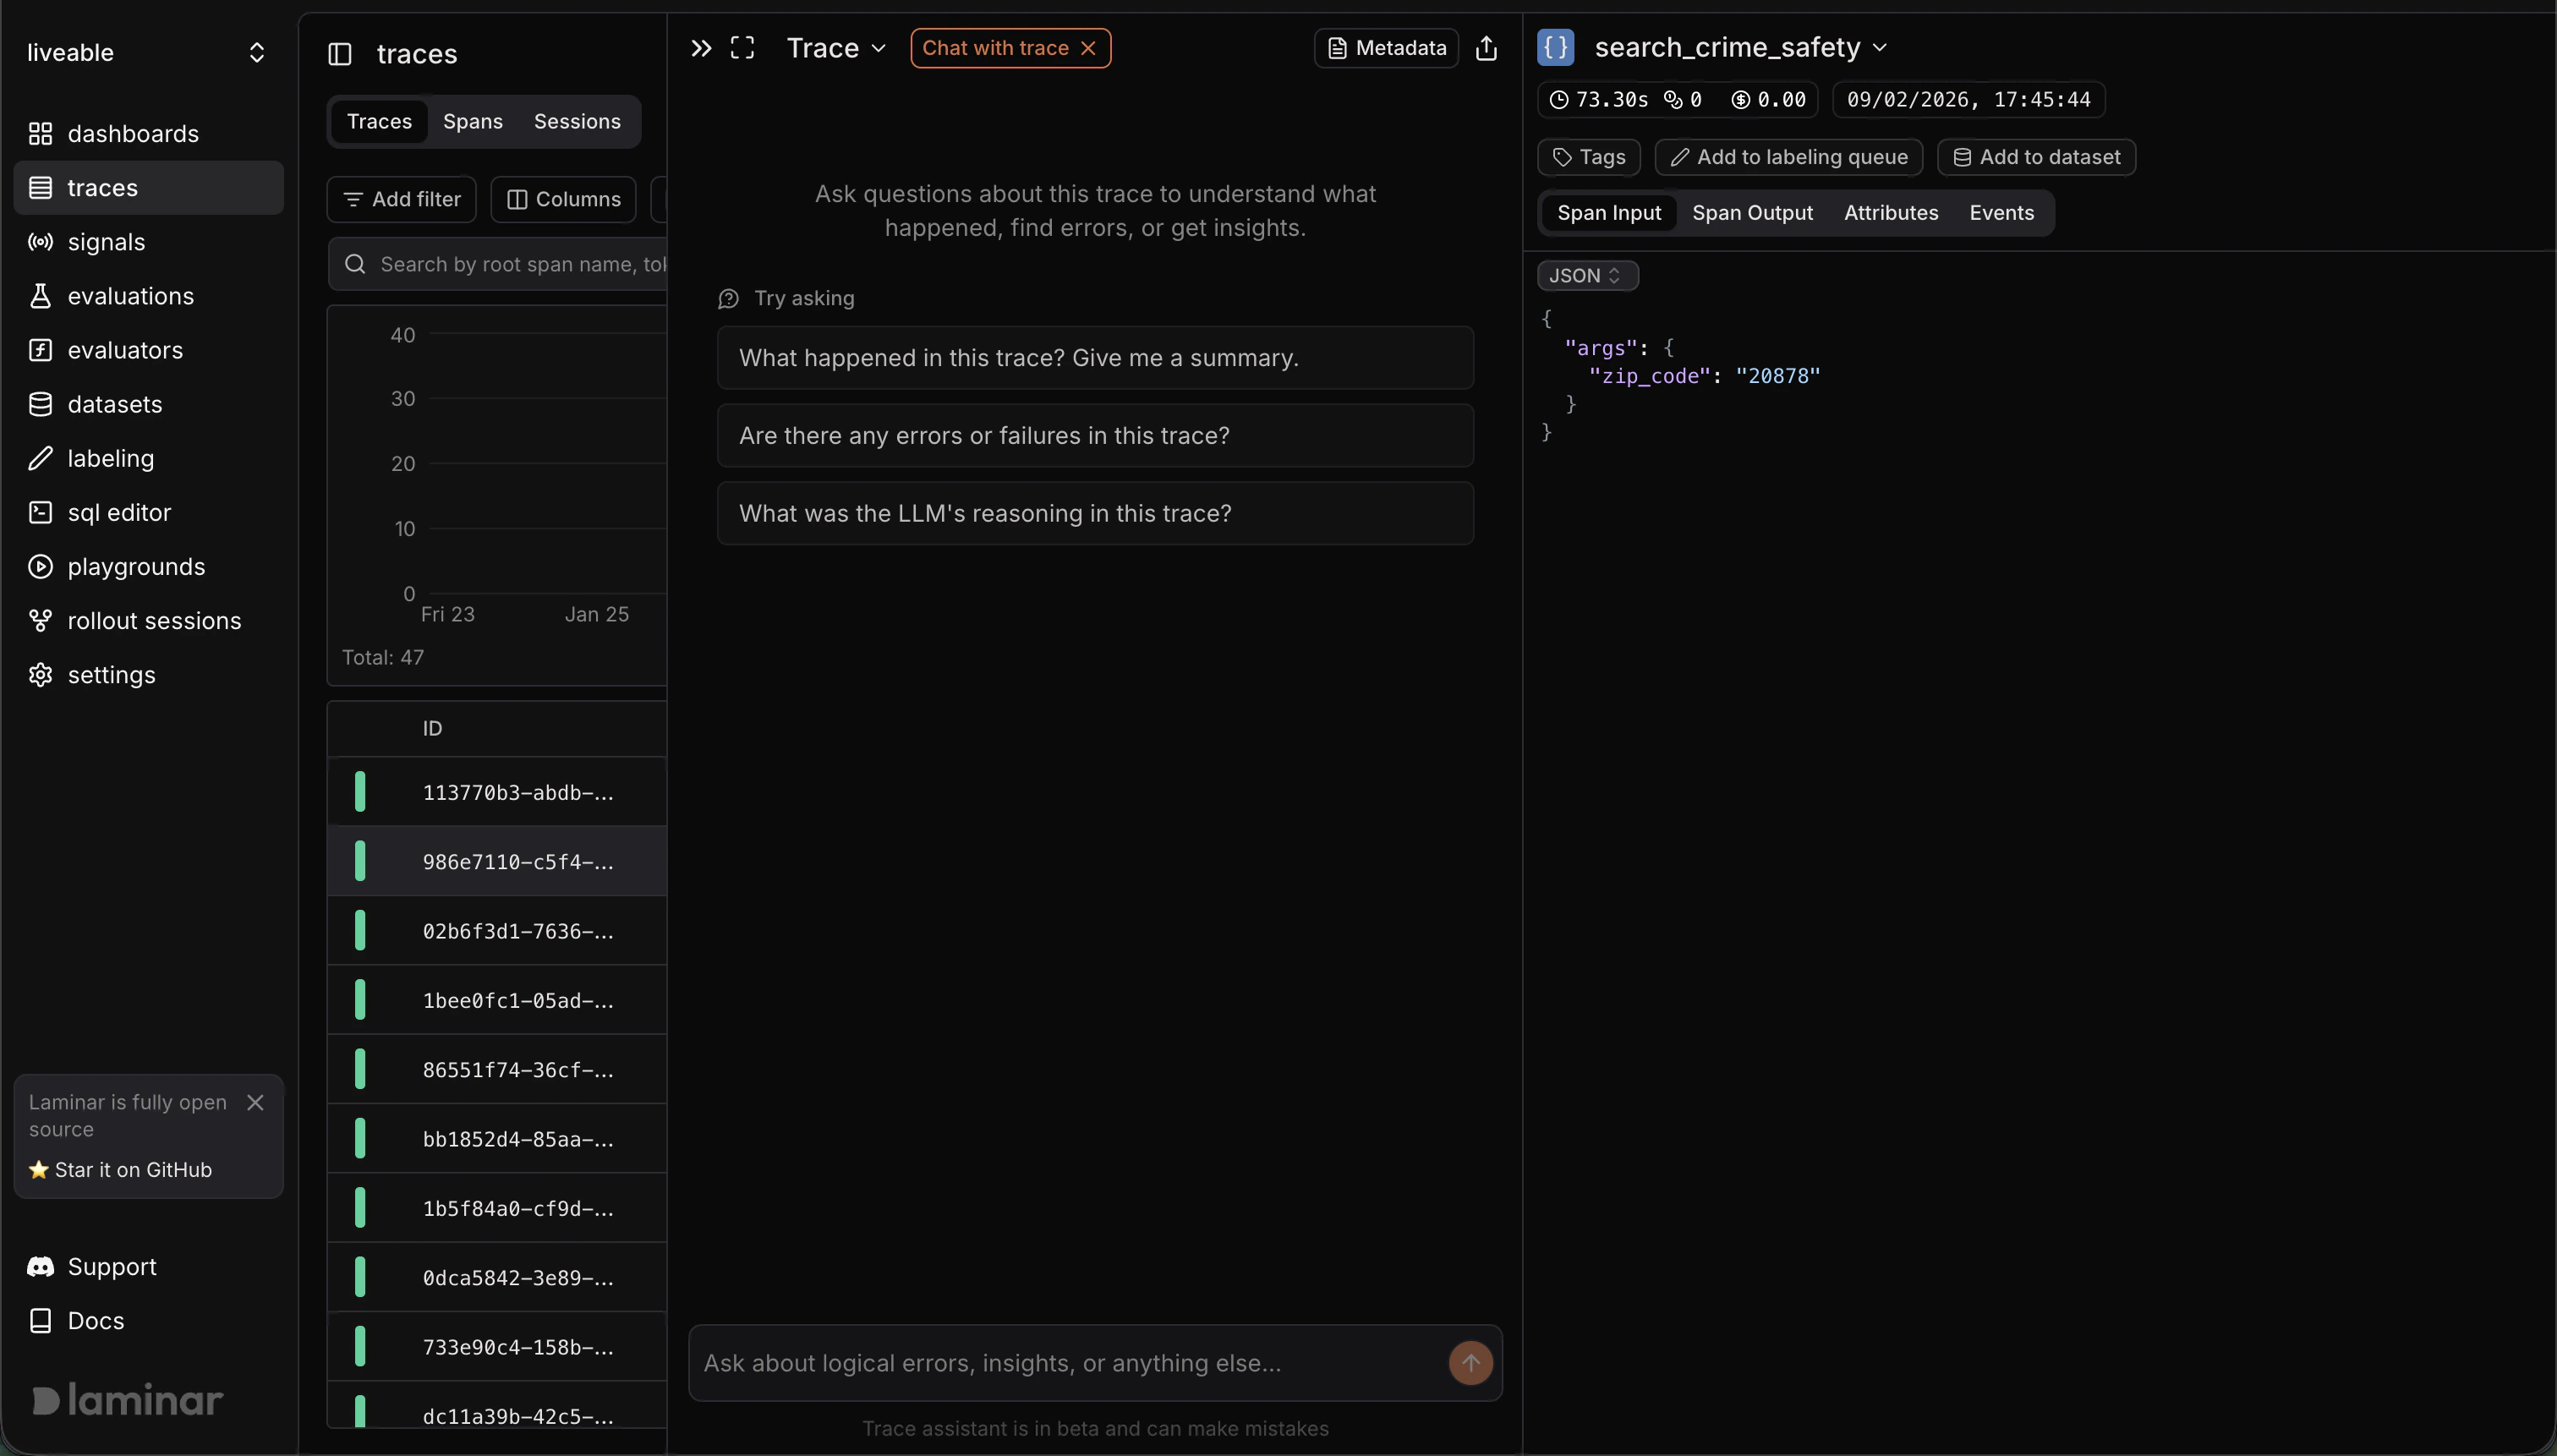
- Automatic summary: Generates a trace summary (and deeper analysis) to orient you quickly.
- Span-aware answers: When the assistant cites spans, they show up as clickable chips that jump you to the referenced span.
- Iterate fast: Ask follow-ups about errors, unexpected outputs, tool calls, or performance.
- Resettable: Start a new chat when you want a fresh thread.
Open in SQL Editor
- Open a trace (from Traces).
- In the trace view header, open the Trace dropdown.
- Select Open in SQL editor (opens in a new tab).
- Pre-filled query (trace): Starts with
SELECT * FROM spans WHERE trace_id = ... ORDER BY start_time ASC. - Pre-filled query (span): From a span’s detail header dropdown, Open in SQL editor creates
SELECT * FROM spans WHERE span_id = ....