
Overview
Laminar is an open-source, OpenTelemetry-native observability platform for AI agents. Trace, debug, and monitor every Pydantic AI agent run, model turn, and tool call with a singleLaminar.initialize() call. Self-host via Helm or use managed cloud.
Pydantic AI is a Python agent framework built by the Pydantic team. Agent drives the loop, typed tools are added with @agent.tool, and the framework emits its own OpenTelemetry GenAI semconv spans for agent runs, model calls, and tool executions. Laminar wires those spans to its tracer provider so the full conversation lands in your project with no manual exporter setup.
What Laminar captures:
- The root
agent runspan with the prompt you sent and the final output. - Every
chat <model>turn with prompts, responses, token counts, latency, and cost. - Every
execute_tool <name>call with arguments and return value. - Multi-agent handoffs and sub-agent runs nested under the call that spawned them.
Getting started
1
Install
Ensure you have
lmnr version 0.7.49 or higher and pydantic-ai-slim >= 1.0 (or the full pydantic-ai distribution):2
Set environment variables
3
Initialize Laminar
Laminar.initialize() auto-instruments Pydantic AI when pydantic-ai-slim or pydantic-ai is importable. No Agent.instrument_all() call is needed: Laminar installs itself as the default instrumentation for every Agent you construct afterwards.Wrapping your entry point in
@observe() is optional but recommended: it creates a root span that captures inputs and outputs and makes the trace easy to find in the UI.See what happened in a trace
Open a multi-agent trace and switch to tree view to see how Pydantic AI nests sub-agents and tool calls. The example below is a concierge agent that delegates flight and hotel booking to two sub-agents, each running its own model turns and tool calls, so the full hierarchy is visible at a glance.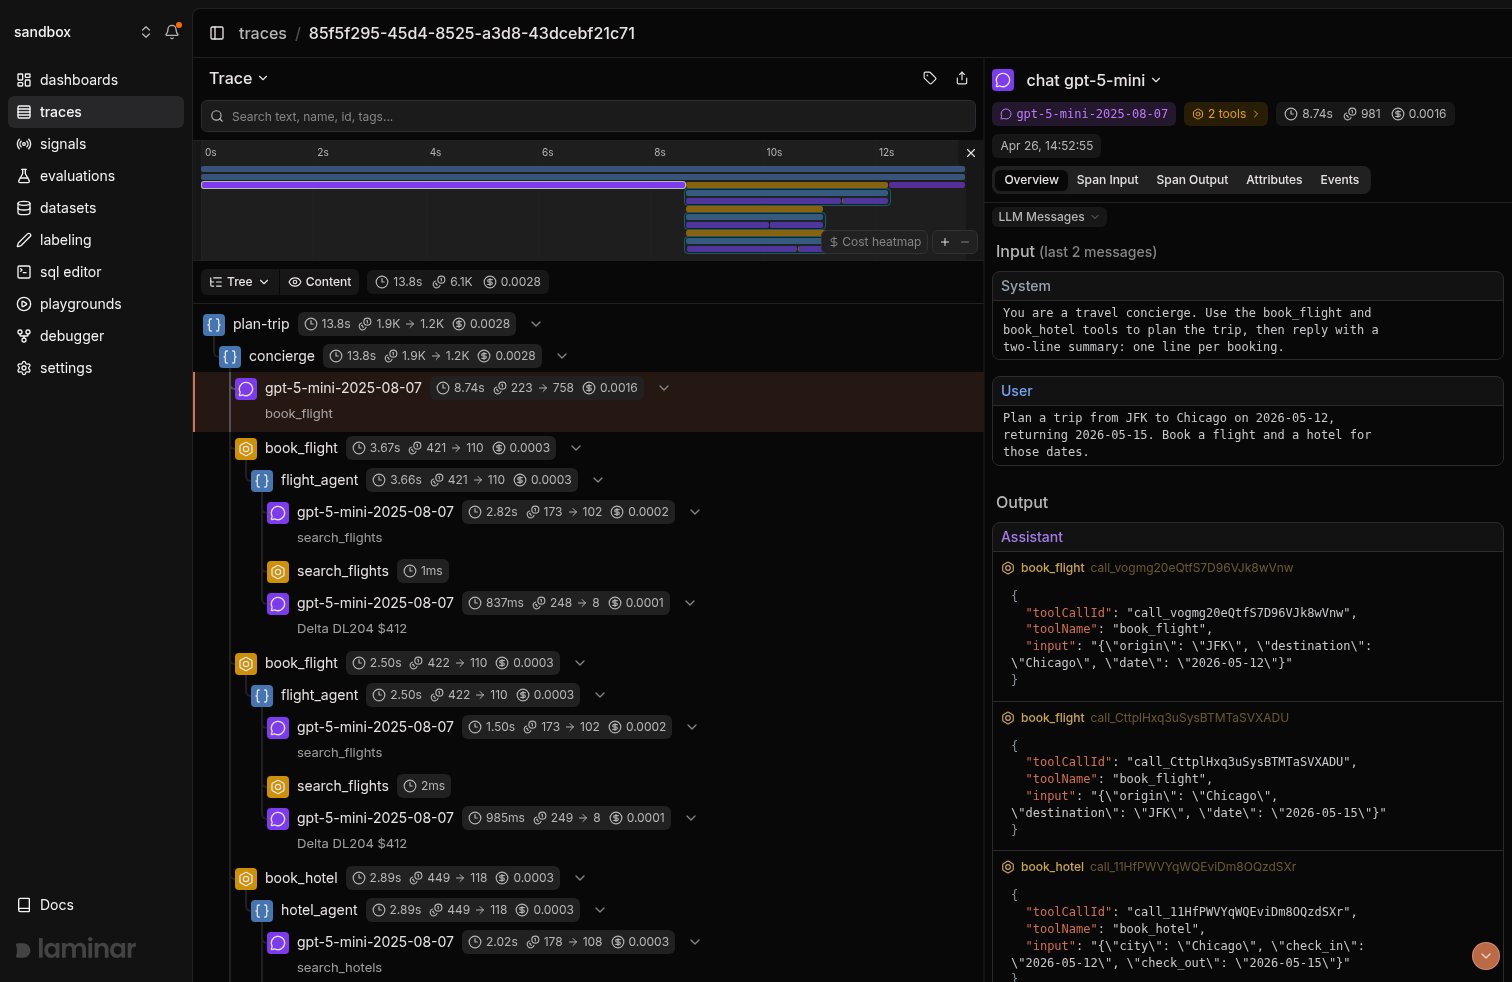
Tree view of a multi-agent Pydantic AI run.
Multi-agent with tool delegation
Register tools with@agent.tool_plain (no dependency state) or @agent.tool (with injected RunContext). A coordinator agent can delegate to specialist sub-agents by calling Agent.run() inside a tool. Pydantic AI emits an execute_tool <name> span for each invocation, and Laminar nests the sub-agent’s run underneath it so the hierarchy mirrors the conversation.
book_flight / book_hotel tool call with its sub-agent’s input and output, and the final concierge summary.
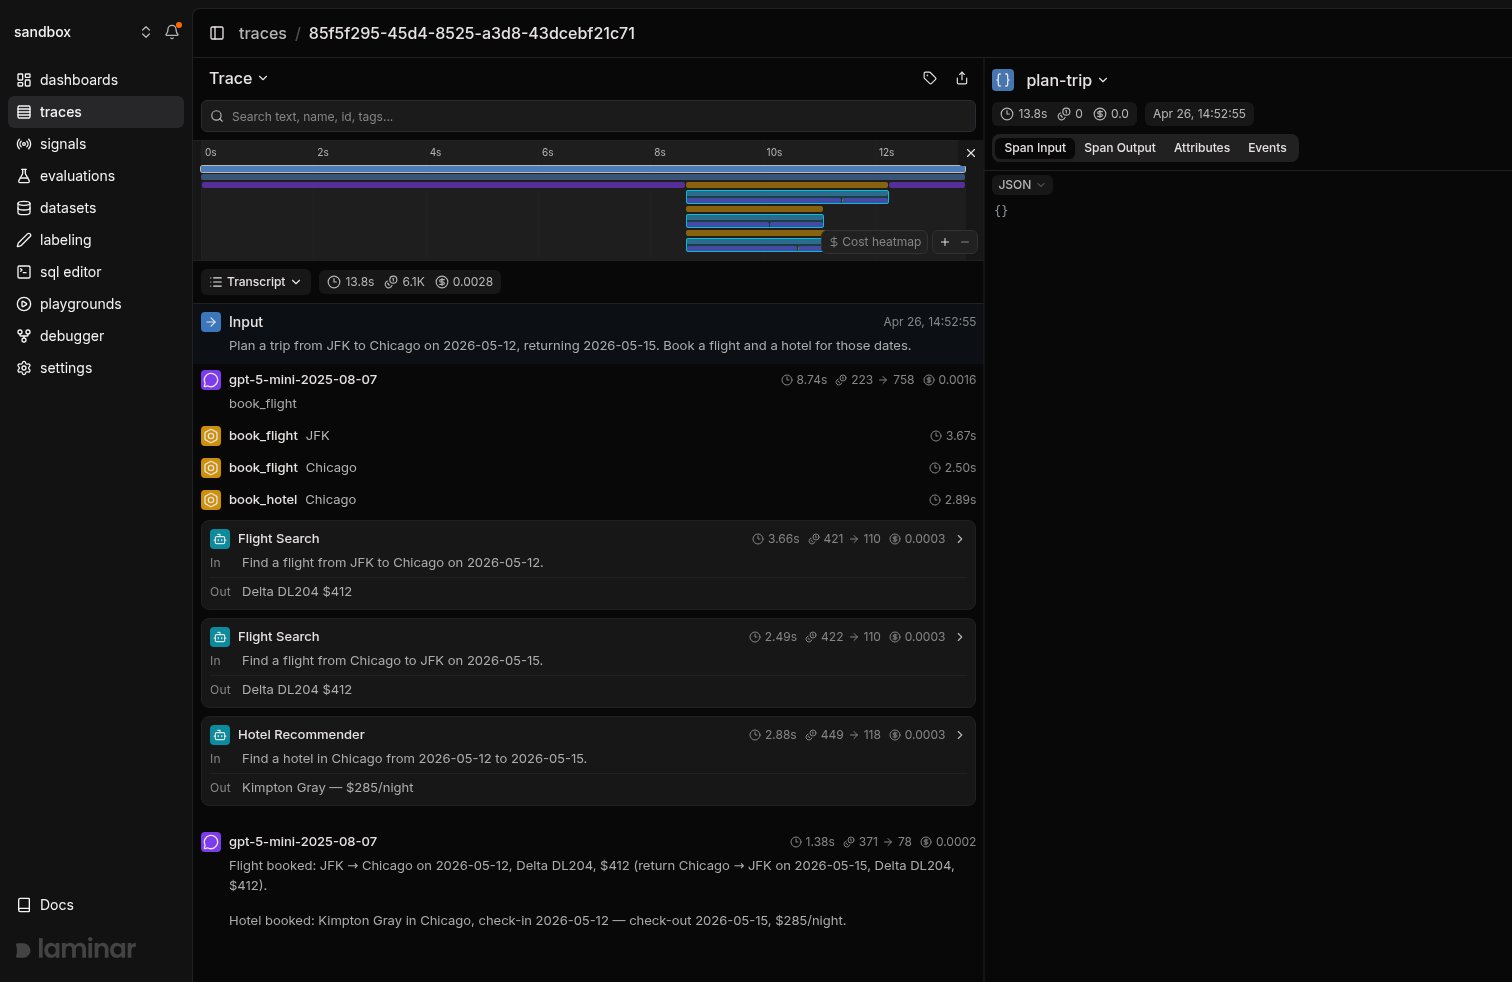
Transcript view of the multi-agent run above. Each book_flight / book_hotel tool call expands inline with the sub-agent's input and output, and the final LLM turn shows the concierge's summary response.
Track outcomes with Signals
Traces answer what happened on this run. Signals answer the cross-trace question: how often does the agent call a tool with missing arguments, when does the model hallucinate a booking code, how many runs exceed three turns without a final answer. A Signal pairs a plain-language prompt with a JSON output schema. Laminar runs it live on new traces (Triggers) or backfills it across history (Jobs) and records a structured event every time it matches. From there you query, cluster, and alert on events across every trace.Every new project ships with a Failure Detector Signal that categorizes issues on any trace over 1000 tokens. Open it from the Signals sidebar to see events as soon as your Pydantic AI traces arrive.
Query across traces
- SQL editor for ad-hoc queries across traces, spans, signals, and evals.
- SQL API for programmatic access from scripts and pipelines.
- CLI (
lmnr-cli sql query) for terminal-driven queries and piping JSON into shell tools or coding agents. - MCP server to query Laminar directly from Claude Code, Cursor, or Codex.
Troubleshooting
I don't see any traces in Laminar
I don't see any traces in Laminar
- Confirm
LMNR_PROJECT_API_KEYis set in the same process that runs the agent. pydantic-ai-slim(orpydantic-ai) must be importable whenLaminar.initialize()runs. Install withpip install "pydantic-ai-slim>=1.0".- The integration requires
pydantic-ai-slim >= 1.0.0andlmnr >= 0.7.49.
I'm getting duplicate spans for every model call
I'm getting duplicate spans for every model call
Laminar auto-removes the raw provider instrumentors (OpenAI, Anthropic, Google GenAI, Groq, Mistral, Cohere, Bedrock) when Pydantic AI is auto-enabled, so this should not happen with a default setup. If you passed an explicit
instruments set that includes both Instruments.PYDANTIC_AI and one of the overlapping providers, drop the provider entry or use disabled_instruments={Instruments.PYDANTIC_AI} to keep only the raw spans.I want to disable the Pydantic AI integration
I want to disable the Pydantic AI integration
Pass
disabled_instruments={Instruments.PYDANTIC_AI} to Laminar.initialize(). The raw provider instrumentors will be auto-enabled again.Self-hosting Laminar
Self-hosting Laminar
Set
base_url and the ports of your instance when initializing. For a local OSS deployment:What’s next
Viewing traces
Read the transcript view, filter, and search across traces.
Signals
Detect behaviors and failures across every run, then query, cluster, and alert on them.
SQL editor and MCP server
Query traces programmatically from the UI, API, or your IDE.
Tracing structure
Sessions, metadata, and tags for deeper control.
Related integrations
OpenAI
Using the OpenAI SDK directly without Pydantic AI? Trace it here.
LangChain / LangGraph
Trace LangChain chains and LangGraph graphs.
Microsoft Agent Framework
Trace Microsoft Agent Framework agents, tools, and workflows.
OpenAI Agents SDK
Trace agent runs, handoffs, and tool calls.
Google ADK
Trace Google ADK agents, Gemini calls, and tool calls.
All integrations
Browse every provider, framework, coding agent, and browser integration Laminar supports.