Overview
If you already instrument your agent with Langfuse and want to try Laminar, you can, without rewriting or migrating anything. Add one line and the same spans flow to both platforms at once, so you can evaluate Laminar on your own real traces:- No code changes. Your
@observefunctions,langfuse.openaicalls, andlangfuse.langchainruns stay exactly as they are. - Side by side. Langfuse keeps receiving everything it does today; Laminar receives a copy in parallel.
- Reversible. It is one specifier you can remove whenever you want, so there is no commitment to evaluate.
- Every Langfuse observation:
@observefunctions,langfuse.openaiLLM calls, andlangfuse.langchainruns. - LLM turns with prompts, responses, tool-call arguments, token counts, latency, and cost, rewritten into Laminar’s GenAI message format so they render in the transcript view.
- Tool observations (
@observe(as_type="tool")) as TOOL spans, so they show up as tool rows instead of opaque function spans. - Trace-level metadata (session id, user id, tags) mapped onto the Laminar trace.
The bridge is Python-only and requires
langfuse version 3.0.0 or higher (the OpenTelemetry-native major version). There is no TypeScript equivalent today.Getting started
Set environment variables
Keep your Langfuse keys exactly as they are. Add your Laminar project API key:
Initialize Laminar with the Langfuse instrument
Call
Laminar.initialize() with instruments={Instruments.LANGFUSE}. That single argument attaches Laminar to Langfuse’s tracer provider, whether the Langfuse client is built before or after this call. Everything else in your code stays the same.See what happened in a trace
Open a bridged run in Laminar and you land on the transcript view: the user prompt at the top, each model turn as a conversation line, and every tool call inline with its arguments and result. The bridge rewrites Langfuse’s observations into Laminar’s message format, so an LLM turn with tool calls reads as a conversation rather than a raw attribute blob. The span tree tells you the shape of the run; the transcript tells you what actually happened.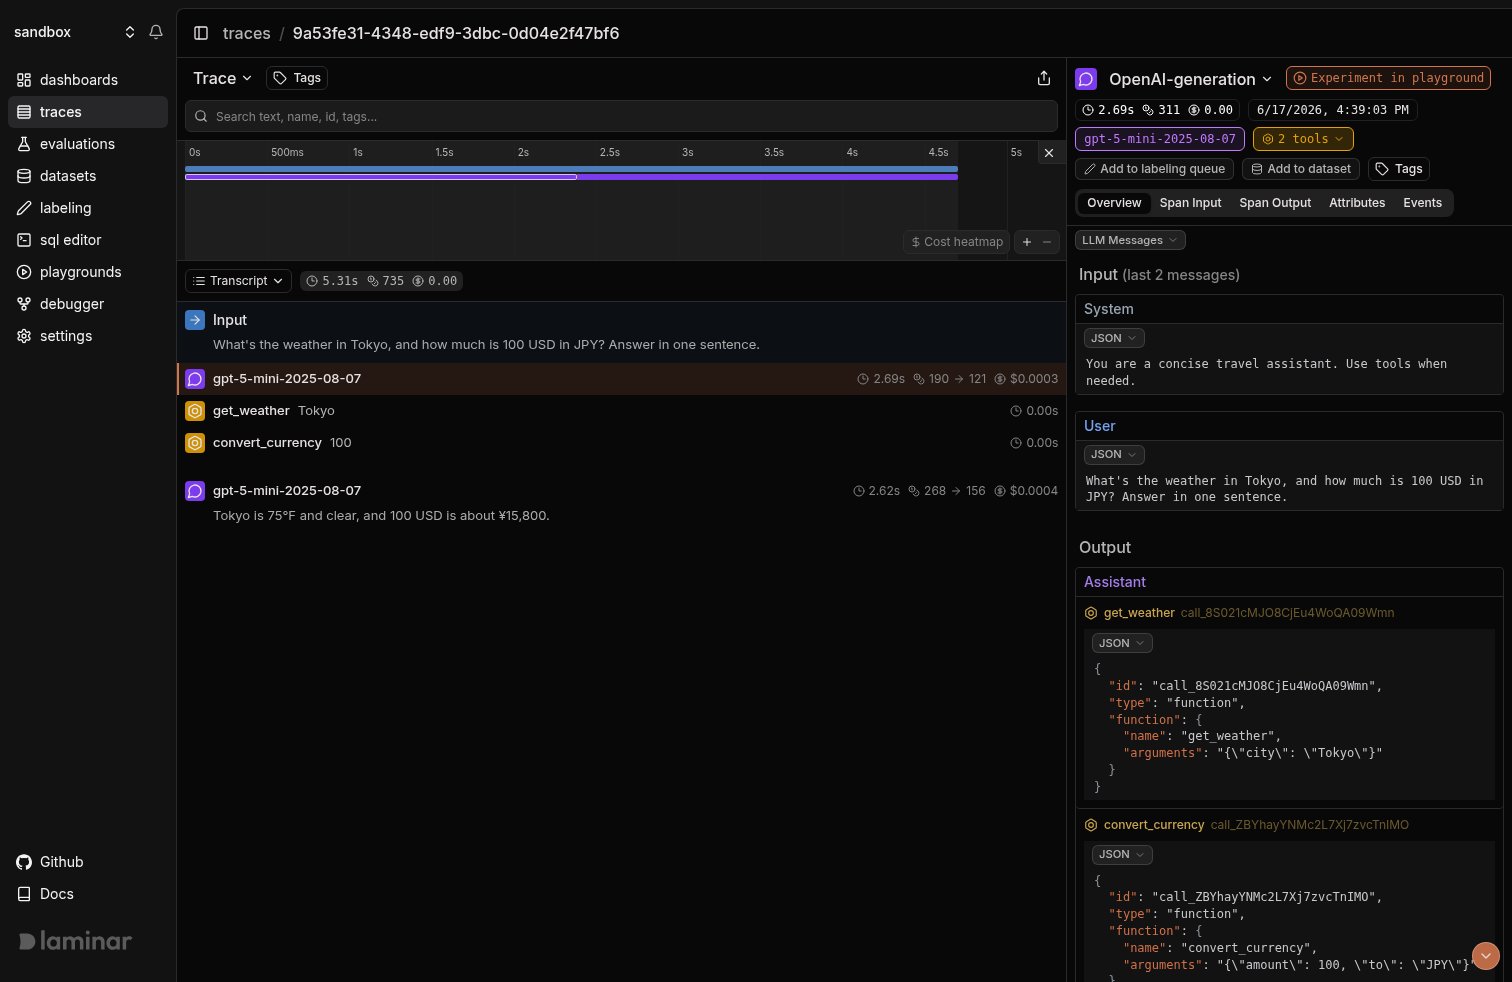
When you’re ready to use Laminar only
The point of the bridge is that you don’t have to commit up front. Once you decide Laminar is what you want, remove the Langfuse-specific code at your own pace:- Drop the
Instruments.LANGFUSEspecifier and enable Laminar’s native instrumentors instead. For the example above, that isLaminar.initialize()with the default instruments, which auto-instruments the OpenAI SDK. - Replace
from langfuse.openai import OpenAIwithfrom openai import OpenAI, and swap@observefromlangfusefor Laminar’s ownobserve. - Remove the Langfuse client and credentials.
Track outcomes with Signals
Traces answer what happened on this run. Signals answer the cross-trace question: how often does the agent skip a tool it should have called, when does it loop, which runs end without answering the user. A Signal pairs a plain-language prompt with a JSON output schema. Laminar runs it live on new traces (Triggers) or backfills it across history (Jobs) and records a structured event every time it matches. From there you query, cluster, and alert on events across every trace. This is a layer Langfuse doesn’t have, and it’s a good reason to keep the bridged traces flowing while you evaluate.Every new project ships with a Failure Detector Signal that categorizes issues on any trace over 1000 tokens. Open it from the Signals sidebar to see events as soon as your bridged traces arrive.
Query across traces
- SQL editor for ad-hoc queries across traces, spans, signals, and evals.
- SQL API for programmatic access from scripts and pipelines.
- CLI (
lmnr-cli sql query) for terminal-driven queries and piping JSON into shell tools or coding agents. - MCP server to query Laminar directly from Claude Code, Cursor, or Codex.
Troubleshooting
I don't see any traces in Laminar
I don't see any traces in Laminar
- Confirm
LMNR_PROJECT_API_KEYis set in the same process that runs the agent. - The bridge is opt-in. It is NOT enabled merely because
langfuseis installed. You must passinstruments={Instruments.LANGFUSE}toLaminar.initialize(). - The bridge requires
langfuse >= 3.0.0. Onlangfuse2.x there’s nothing OpenTelemetry-native to attach to.
The same call shows up twice in Laminar
The same call shows up twice in Laminar
Opting into the bridge does not turn off Laminar’s other instrumentors. If you enable
Instruments.LANGFUSE while the default instruments are still active, a langfuse.openai call can be traced once by the bridge and once by Laminar’s native OpenAI instrumentor. Pass an explicit instruments set listing only what you want, for example instruments={Instruments.LANGFUSE}, so the bridge is the single source.LLM inputs and outputs look like raw JSON, not a conversation
LLM inputs and outputs look like raw JSON, not a conversation
The bridge translates
langfuse.openai and langfuse.langchain observations into Laminar’s GenAI message format. If a span still shows a raw blob, it’s likely a non-LLM observation, which falls back to the raw input/output. Make sure LLM calls go through langfuse.openai (or langfuse.langchain) so the observation is typed as a generation.Self-hosting Laminar
Self-hosting Laminar
Set
base_url and the ports of your instance when initializing. For a local OSS deployment:What’s next
Viewing traces
Read the transcript view, filter, and search across traces.
Signals
Detect behaviors and failures across every run, then query, cluster, and alert on them.
OpenAI
Drop Langfuse and trace the OpenAI SDK with Laminar’s native instrumentor.
Tracing structure
Use Laminar’s own
observe, sessions, metadata, and tags once you migrate off Langfuse.