
Overview
Laminar is an open-source, OpenTelemetry-native observability platform for AI agents. eve is Vercel’s framework for durable AI agents, built on the Workflow SDK and the Vercel AI SDK. eve emits OpenTelemetry spans for every agent turn, model call, and tool call through itsinstrumentation.ts file, so Laminar captures the full run without any per-call wiring.
What Laminar captures from an eve agent:
- User messages and system instructions sent to the model.
- Model output and reasoning for each turn.
- Tool calls, their arguments, and tool results.
- Token counts, latency, and cost per call.
- The model name and provider behind each call.
gpt-5-mini turn, the get_weather tool call, and the final answer, in order.
Getting Started
eve discoversagent/instrumentation.ts automatically and runs its setup function once when the agent server starts. You register Laminar’s span processor there.
1
Install
@vercel/otel is eve’s recommended way to register an OpenTelemetry tracer provider. Laminar plugs into it as a span processor.2
Set environment variables
Laminar initialization. If not specified,
Laminar will look for the key in the LMNR_PROJECT_API_KEY environment variable.3
Register Laminar in agent/instrumentation.ts
Create
agent/instrumentation.ts (or edit the one eve generated). Add LaminarSpanProcessor to the spanProcessors array you pass to registerOTel. The processor reads LMNR_PROJECT_API_KEY from the environment and sends spans to Laminar.agent/instrumentation.ts
setup runs at server startup, before the first agent turn. eve passes the agent name in, which becomes the OpenTelemetry service name on every span.Do not call
Laminar.initialize() here. registerOTel already installs a tracer provider, and LaminarSpanProcessor attaches to it. Calling Laminar.initialize() as well would register a second provider.4
Run your agent
Build and start the agent as usual. Every turn is traced.Send the agent a message and the trace appears in Laminar.
Keeping payloads off your spans
eve enables input and output recording by default, so prompts and responses are captured on the spans. To keep that content out of Laminar (for sensitive data or to reduce payload size), turn it off in the instrumentation file. Token counts, latency, and cost are still recorded.agent/instrumentation.ts
See what happened in a trace
Open the trace in Laminar and you get the transcript view: the user message, each model turn, tool calls with their arguments, and tool results laid out as a conversation. The timeline on the right shows how the turn’s spans overlap in time, so you see where the agent spent its time.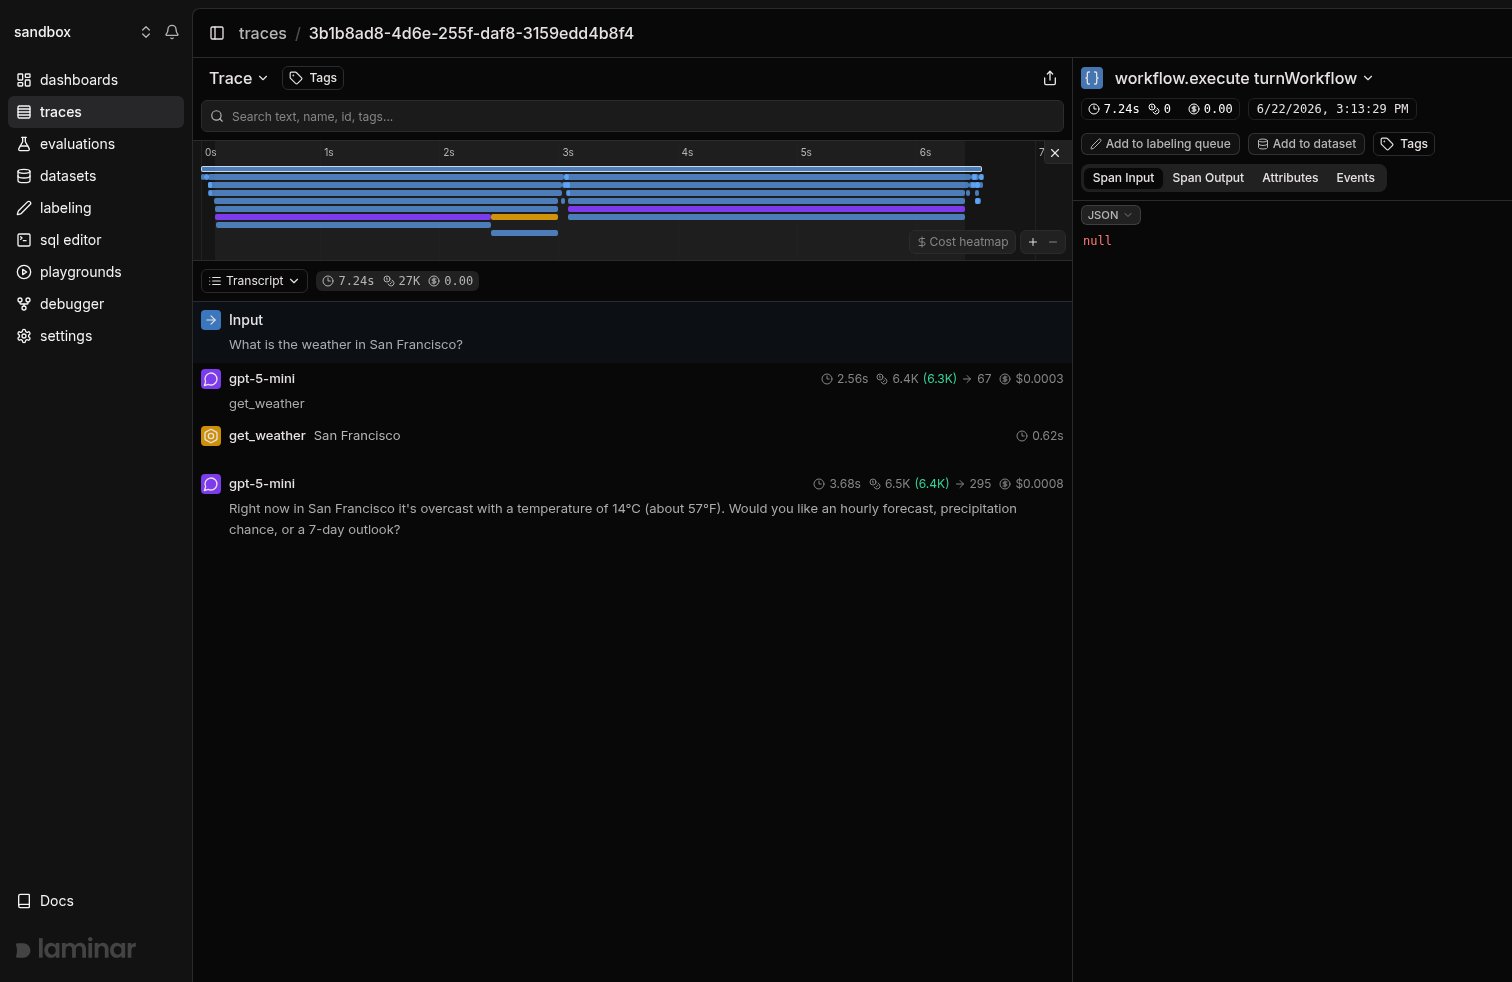
An eve agent turn in Laminar: the user question, the gpt-5-mini turns, the get_weather tool call, and the final answer rendered as a transcript, with the span timeline on the right.
Run evals
eve ships its own eval runner (eve eval). Laminar plugs into it as a reporter. Every run becomes a Laminar evaluation: one evaluation per run, one datapoint per eval, and each datapoint links to the agent trace that produced it. From there you compare runs and chart scores across a group.
This needs eve 0.29.1 or later.
1
Register the Laminar reporter
Add
LaminarReporter to the reporters array in your eval config. The reporter reads LMNR_PROJECT_API_KEY from the environment.evals/evals.config.ts
groupName is what makes runs comparable: every run under the same group appears on one progression chart. On run start the reporter prints the URL of the evaluation to stdout.2
Let the agent join the eval trace
The reporter creates the trace in the runner process and sends it to the agent as a The option defaults to
traceparent header. eve only reads that header when the agent emits a server span for each inbound channel request, so turn that on in the instrumentation file.agent/instrumentation.ts
false. With it off, no eve span joins the eval trace.3
Keep the whole run in one trace
eve runs on the Vercel Workflow runtime. Its default trace mode starts a new root trace for every queue-delivered invocation, so the agent’s turns land on a different trace than the eval result. Set the continuous mode in the environment the agent runs in.
4
Run the evals
Trace the judge model calls
t.judge.autoevals.* assertions run in the runner process, not in the agent, so the agent’s instrumentation never sees them. To capture the judge’s model call, register Laminar’s AI SDK telemetry in the eval config. eve calls the AI SDK from inside its own bundle, and AI SDK v7 reads registered telemetry from a global registry, so this one registration reaches it.
evals/evals.config.ts
process.exit() that ends eve eval.
Each judge call lands as its own span under the eval trace. Without this step the scores are still recorded; only the judge’s model call is missing.
What lands on each datapoint
Every eval produces one datapoint with three scores:
The scores stay the same across every eval file on purpose. eve eval files assert different things, and per-assertion score columns would leave most rows empty.
Per-assertion detail goes to the datapoint metadata under
assertions, with a shorter failedAssertions list when something fails. The metadata also carries the eve verdict, the session status, the eve session id, the model id, and the tools the agent called. On the trace itself, each assertion becomes an EVALUATOR span, so you read the grade and the run that earned it in one place.
Reporter options
Track outcomes with Signals
Traces answer what happened on this run. Signals answer the cross-trace question: how often does the agent call a tool that returns an empty result, when does a turn run more steps than expected, how often does the agent answer without calling the tool it should have. A Signal pairs a plain-language prompt with a JSON output schema. Laminar runs it live on new traces (Triggers) or backfills it across history (Jobs) and records a structured event every time it matches. From there you query, cluster, and alert on events across every run.Every new project ships with a Failure Detector Signal that categorizes issues on any trace over 1000 tokens. Open it from the Signals sidebar to see events as soon as your eve traces arrive.
Query across traces
- SQL editor for ad-hoc queries across traces, spans, signals, and evals.
- SQL API for programmatic access from scripts and pipelines.
- CLI (
lmnr-cli sql query) for terminal-driven queries and piping JSON into shell tools or coding agents. - MCP server to query Laminar from Claude Code, Cursor, or Codex.
Troubleshooting
I don't see any traces in Laminar
I don't see any traces in Laminar
- Confirm
LMNR_PROJECT_API_KEYis set in the environment the agent server runs in, not just your shell. - The processor must be registered in
agent/instrumentation.ts. eve only runs thesetupfunction from a default-exporteddefineInstrumentationcall, so make sure that is the file’s default export. - Restart the agent after editing
instrumentation.ts.setupruns once at startup, so changes only take effect on a fresheve start.
I see the model and tool calls but no message content
I see the model and tool calls but no message content
Check that you did not set
recordInputs or recordOutputs to false in defineInstrumentation. Both default to on; setting either to false strips that content from the spans.My eval datapoints link to a trace with no agent work in it
My eval datapoints link to a trace with no agent work in it
Both eve settings are needed for the agent to join the eval trace:
traceChannelRequests: trueinagent/instrumentation.ts. Without it the agent ignores the runner’straceparentheader. The option needs eve 0.29.1 or later.WORKFLOW_TRACE_MODE=continuousin the environment the agent runs in. The default mode starts a fresh trace for every queue-delivered invocation, so the turns land elsewhere.
traceResolution. A value of reporter-fallback means no trace context reached the agent.I see the eval scores but no judge model call
I see the eval scores but no judge model call
Add
registerTelemetry(new LaminarAiSdkTelemetry()) to evals/evals.config.ts. Judge assertions run in the eval runner, which the agent’s instrumentation never sees.A running eval row stays pending in the UI
A running eval row stays pending in the UI
Reload the evaluation page. Rows written by the eve reporter do not stream their result into an open page yet. The stored data is complete, so a reload shows every score.
I see two tracer providers or duplicated spans
I see two tracer providers or duplicated spans
Remove any
Laminar.initialize() call from agent/instrumentation.ts. In the agent, registerOTel owns the tracer provider and LaminarSpanProcessor attaches to it, so Laminar.initialize() would register a second provider.This does not apply to evals/evals.config.ts. That file runs in the eval runner, which has no registerOTel, and the reporter and the AI SDK telemetry integration share one provider there.What’s next
Viewing traces
Read the transcript view, filter, and search across traces.
Signals
Detect behaviors and failures across every run, then query, cluster, and alert on them.
SQL editor and MCP server
Query traces programmatically from the UI, API, or your IDE.
Vercel AI SDK
eve is built on the AI SDK. Trace
generateText and streamText directly here.Evaluations
Score agent behavior on a dataset and track it as the agent changes.
Comparing runs
Read score deltas between two runs of the same eval group.