
Tracing AI agents in TypeScript means recording each run as one trace, with a parent span for the agent loop and child spans for model and tool calls. In an ESM test of the agent below, the root and tools appeared but all three Anthropic calls were missing. The agent ran successfully; its trace was incomplete.
With Laminar, you can patch the provider SDK to record model calls and use observe() around your own loop and tools. This guide builds that path, shows a recorded run, and uses targeted tests to explain import order, async context and export loss.
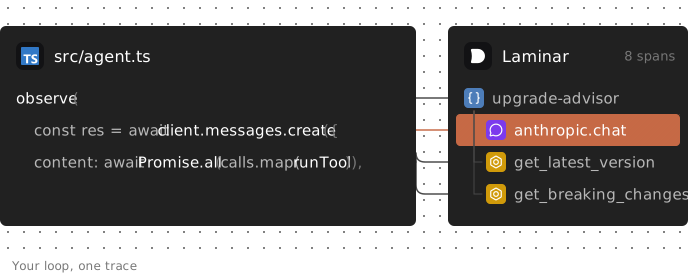
Trace AI agents in TypeScript with Laminar
The example is an npm upgrade advisor running as a plain Node script. Set "type": "module" in package.json to use ESM. The agent looks up package versions and returns upgrade advice. Its migration notes are illustrative fixtures: get_breaking_changes fetches package metadata and returns fixed notes, rather than computing a diff between the requested versions.
The tested setup used Node 24.22.2, @lmnr-ai/lmnr 0.9.5, @anthropic-ai/sdk 1.11.0, tsx 4.23.15 and TypeScript 7.0.2. Span-count tests used an in-memory exporter; the screenshots and export-loss test used a local Laminar production build.
Install the SDKs:
npm install @lmnr-ai/lmnr @anthropic-ai/sdk
npm install --save-dev tsx typescript @types/node
Set LMNR_PROJECT_API_KEY from your Laminar project settings and ANTHROPIC_API_KEY in the environment.
1. Initialize Laminar in its own file
// src/instrumentation.ts
import * as anthropic from "@anthropic-ai/sdk";
import { Laminar } from "@lmnr-ai/lmnr";

Laminar.initialize({
  projectApiKey: process.env.LMNR_PROJECT_API_KEY,
  instrumentModules: { anthropic },
});
instrumentModules gives Laminar the Anthropic module so it can patch messages.create directly. Calls then produce anthropic.chat LLM spans with messages, model and token usage; the recorded trace also shows cost.
Passing instrumentModules instruments only the modules you supply. Add other provider or framework modules explicitly. The instrumentation reference lists supported keys, including OpenAI, langchain and claudeAgentSDK.
2. Mark your tools as TOOL spans
// src/tools.ts
import { observe } from "@lmnr-ai/lmnr";

const MIGRATION_NOTES: Record<string, string[]> = {
  zod: ["z.string().email() is now z.email()", "errorMap replaced by the error param"],
  express: ["req.param() removed", "path-to-regexp v8 route syntax"],
};

const registry = async (path: string) => {
  const res = await fetch(`https://registry.npmjs.org/${path}`);
  if (!res.ok) throw new Error(`npm registry returned ${res.status} for ${path}`);
  return res.json();
};

export const getLatestVersion = (pkg: string) =>
  observe(
    { name: "get_latest_version", spanType: "TOOL", input: { pkg } },
    async () => {
      const { version } = await registry(`${pkg}/latest`);
      return { pkg, version };
    },
  );

export const getBreakingChanges = (pkg: string, from: string, to: string) =>
  observe(
    { name: "get_breaking_changes", spanType: "TOOL", input: { pkg, from, to } },
    async () => {
      const { engines } = await registry(`${pkg}/${to}`);
      return {
        pkg,
        to,
        node: engines?.node ?? "any",
        breaking: MIGRATION_NOTES[pkg] ?? [],
      };
    },
  );
observe() opens a span, runs the function inside it, and records its return value. spanType: "TOOL" makes the span appear in Laminar's transcript view. The default span type, DEFAULT, appears only in the tree view.
Set input explicitly here. Otherwise, observe() records the wrapped function's arguments. These closures take no arguments, so the initial test recorded {} for every tool input until that option was added.
3. Wrap the agent loop
// src/agent.ts
import Anthropic from "@anthropic-ai/sdk";
import { observe } from "@lmnr-ai/lmnr";

import { getBreakingChanges, getLatestVersion } from "./tools.js";

const client = new Anthropic();

const tools: Anthropic.Tool[] = [
  {
    name: "get_latest_version",
    description: "Latest published version of an npm package",
    input_schema: {
      type: "object",
      properties: { pkg: { type: "string" } },
      required: ["pkg"],
    },
  },
  {
    name: "get_breaking_changes",
    description: "Breaking changes between two versions of an npm package",
    input_schema: {
      type: "object",
      properties: {
        pkg: { type: "string" },
        from: { type: "string" },
        to: { type: "string" },
      },
      required: ["pkg", "from", "to"],
    },
  },
];

const runTool = async (
  call: Anthropic.ToolUseBlock,
): Promise<Anthropic.ToolResultBlockParam> => {
  const args = call.input as { pkg: string; from: string; to: string };
  const result =
    call.name === "get_latest_version"
      ? await getLatestVersion(args.pkg)
      : await getBreakingChanges(args.pkg, args.from, args.to);
  return {
    type: "tool_result",
    tool_use_id: call.id,
    content: JSON.stringify(result),
  };
};

export const runAgent = (
  question: string,
  { userId, sessionId }: { userId: string; sessionId: string },
) =>
  observe(
    {
      name: "upgrade-advisor",
      input: question,
      userId,
      sessionId,
      metadata: { prompt: "v3" },
    },
    async () => {
      const messages: Anthropic.MessageParam[] = [
        { role: "user", content: question },
      ];
      for (let step = 0; step < 6; step++) {
        const res = await client.messages.create({
          model: "claude-sonnet-5",
          max_tokens: 2048,
          system: "You advise on npm upgrades. Call tools in parallel when you can.",
          tools,
          messages,
        });
        messages.push({ role: "assistant", content: res.content });

        const calls = res.content.filter((b) => b.type === "tool_use");
        if (calls.length === 0) {
          return res.content
            .filter((b) => b.type === "text")
            .map((b) => b.text)
            .join("");
        }
        messages.push({
          role: "user",
          content: await Promise.all(calls.map(runTool)),
        });
      }
      throw new Error("upgrade-advisor hit the step limit");
    },
  );
The outer observe() creates the root span. Its userId, sessionId and metadata propagate to child spans, including auto-instrumented model calls. Set them once per run.
Promise.all executes the model's requested tools concurrently. The loop then sends their results back together. The recorded run used both tools twice; model decisions and live registry results can vary between runs.
4. Import tracing first, and shut down at the end
// src/index.ts
import "./instrumentation.js";

import { Laminar } from "@lmnr-ai/lmnr";

import { runAgent } from "./agent.js";

const answer = await runAgent(
  "We're on zod 3.23.8 and express 4.21.2. Can we upgrade both to latest, and what breaks?",
  { userId: "user-42", sessionId: "pr-1187" },
);
console.log(answer);

await Laminar.shutdown();
Run it with npx tsx src/index.ts. The files passed strict typechecking with module and moduleResolution set to nodenext.
This entry point shuts down after a successful answer. For deployment, ensure cleanup also runs when runAgent rejects, such as through a finally block, so an application error cannot skip export.
What the trace shows
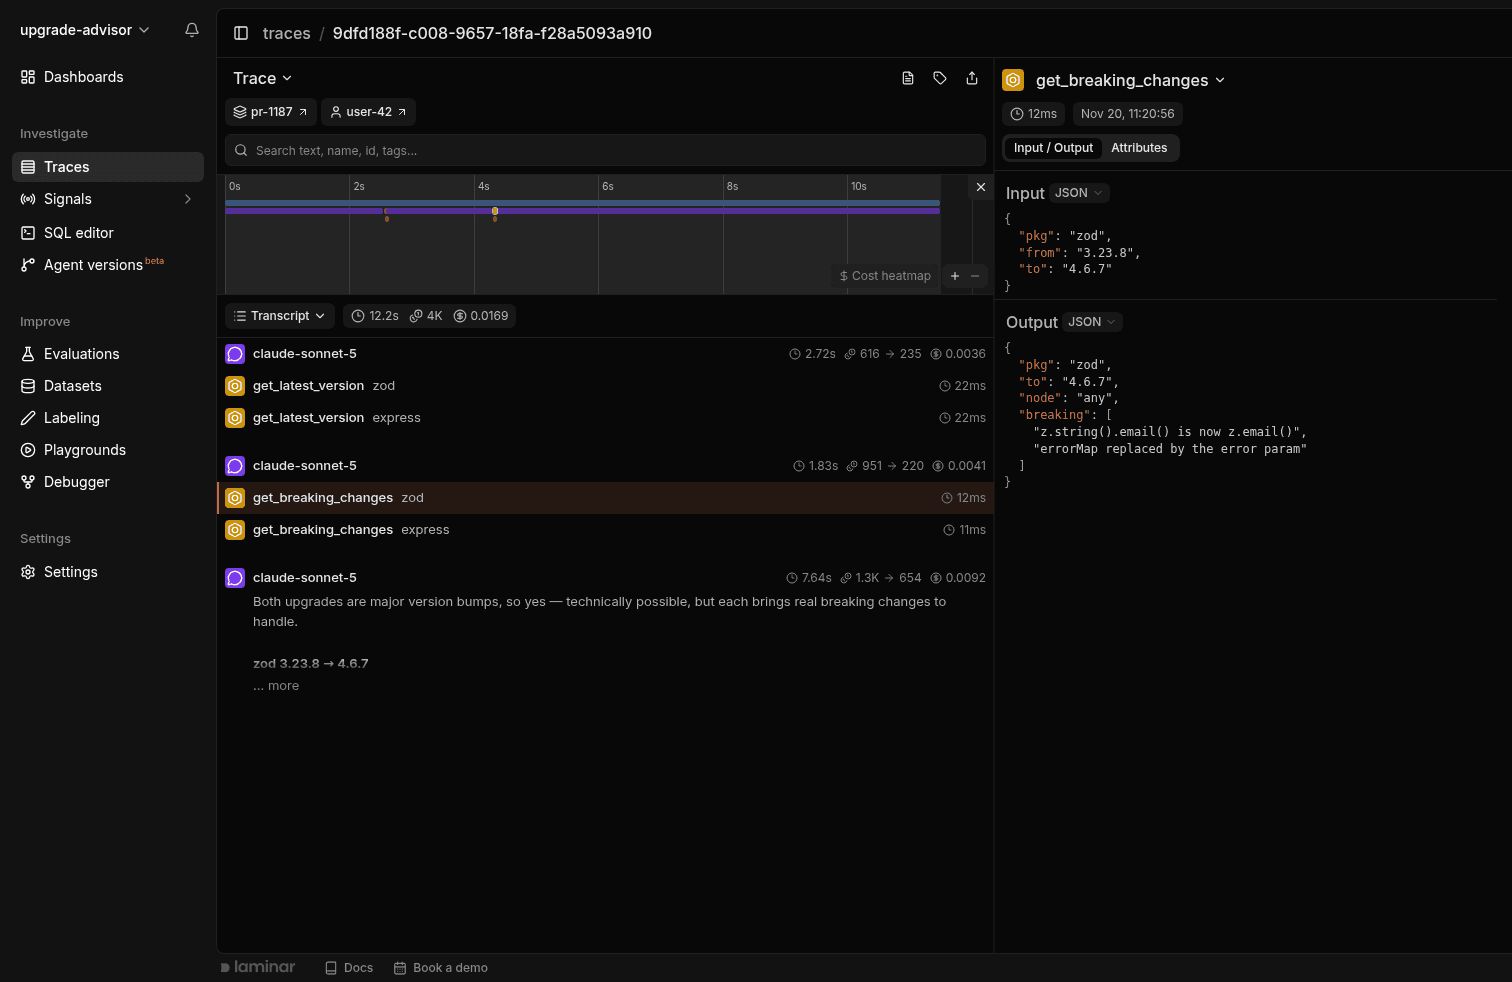
The recorded run took 12.2 seconds and contained three claude-sonnet-5 calls and four tool calls. Laminar displayed 4.0K tokens and $0.0169. The transcript view shows model turns and tool calls, including each tool's arguments and result:
The tree view confirms the parent-child relationships and the root's totals:
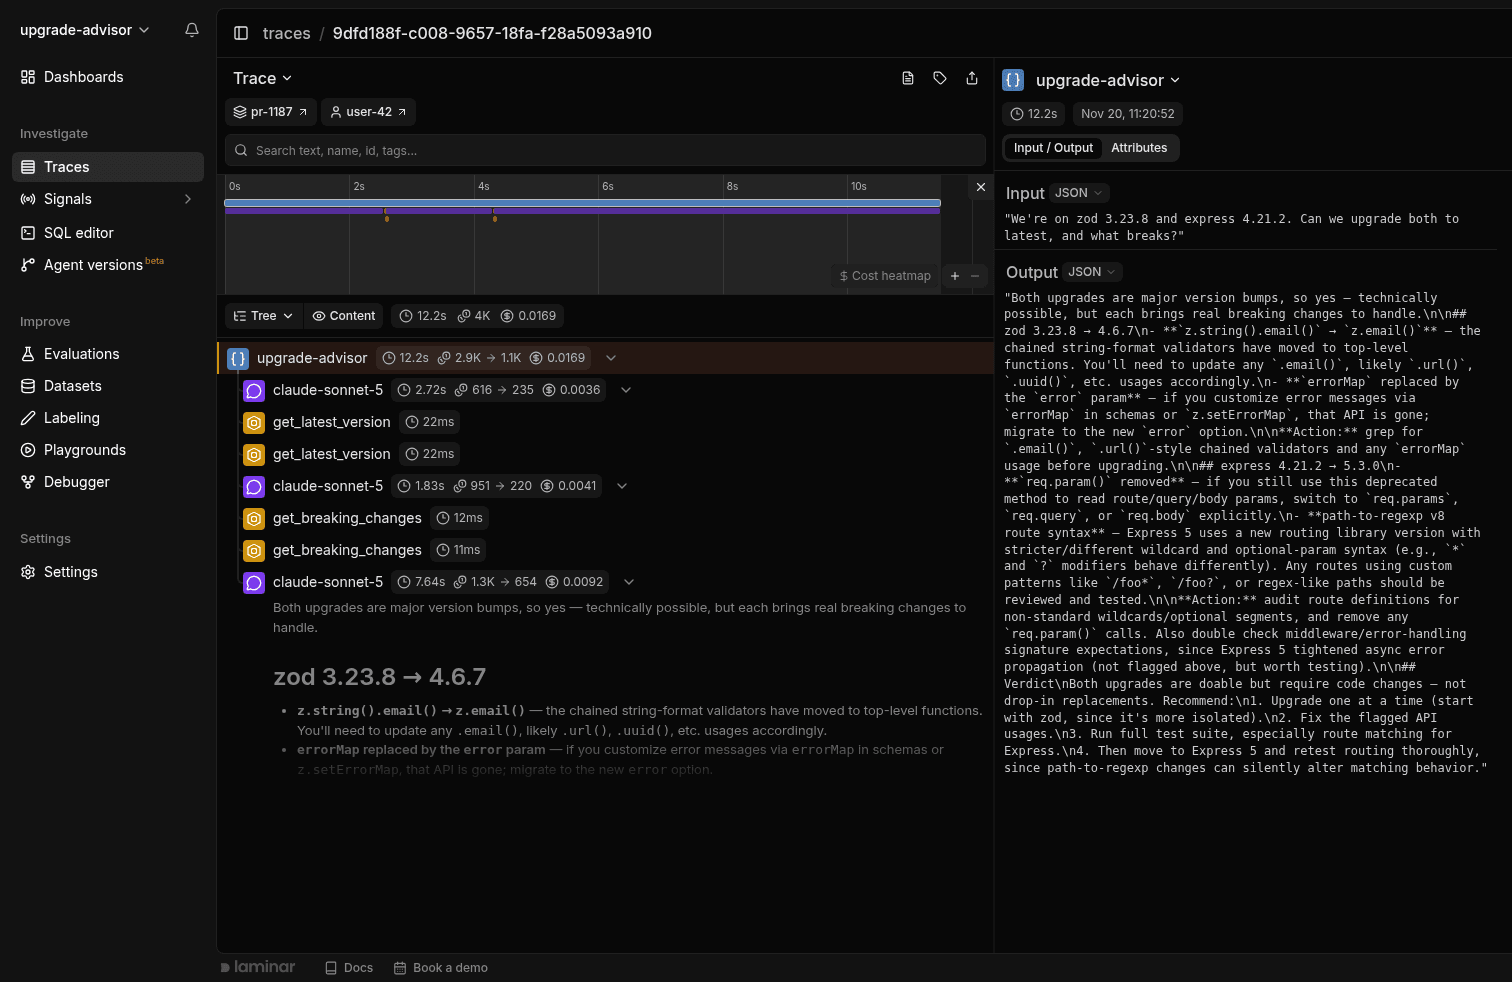
Both get_latest_version spans started within 2 ms of each other and lasted 22 ms, confirming that they overlapped under one parent. The model spans also carried pr-1187 and user-42 without setting those fields on each call.
The final model call used 1,347 input and 654 output tokens and cost $0.009234, over half this run's total. That is an observation about this run, not a general cost distribution for agents.
ESM vs CommonJS: why model calls go missing
Laminar 0.9.5's default auto-instrumentation uses OpenTelemetry require hooks. With CommonJS, initialization can register those hooks before the provider SDK loads. The tested ESM imports bypassed them.
The troubleshooting guide describes these auto-instrumentations as "optimized for commonjs modules." With initialization in a separate module imported first, the same agent produced these results through tsx:
| Module system | instrumentModules | Spans recorded |
|---|---|---|
| CommonJS | not passed | 8: root, 3 LLM, 4 tool |
| ESM | not passed | 5: root and 4 tool, no LLM spans |
| ESM | { anthropic } | 8: root, 3 LLM, 4 tool |
The missing model calls are easy to overlook because the trace still contains your manually instrumented work.
Your output module format matters more than the import syntax in the source. With module: nodenext, a package's type field and file extensions determine whether TypeScript emits ESM or CommonJS.
Passing modules explicitly worked in both tested formats. Laminar patches client-class prototypes, so an already-constructed Anthropic client was also covered when patched before its first request. That test used Laminar.patch({ anthropic }) after the agent module loaded and still recorded all three LLM spans.
Call Laminar.patch() after Laminar.initialize() and before the calls you want to trace. It cannot recover earlier requests.
Initialize Laminar before your LLM clients load
Even with CommonJS output, the runner can change initialization order. This entry file looks plausible:
import { Laminar } from "@lmnr-ai/lmnr";

Laminar.initialize();

import { runAgent } from "./agent";
Static imports are evaluated before an ES module's body. In the tested CommonJS build through tsx, which uses esbuild, ./agent and the Anthropic SDK loaded before initialize() ran. The trace contained the root and tools but no LLM spans.
Compiling the same inline-initialization pattern with tsc to CommonJS preserved the written statement order and recorded all eight spans. Treat that difference as a tested compiler behavior, not a portable initialization strategy.
Use the separate instrumentation module shown above. With this import graph, it evaluates before agent.ts. Explicit instrumentModules also fixed the hoisted-import test because direct patching did not depend on catching the SDK as it loaded.
Parallel tool calls and async context
Laminar uses Node's AsyncLocalStorage to track the active span. In the tests, context followed await and Promise.all: parallel tool spans stayed under the root and overlapped in time.
A worker loop started outside the run has a different context. A setInterval worker created at module load produced three traces when it processed jobs enqueued inside observe(): one root trace and two orphan tool traces.
Capture the parent when you enqueue, then pass it to the worker's observe() call:
import { Laminar, observe } from "@lmnr-ai/lmnr";

type Job = { pkg: string; parent: string | null; done: (v: unknown) => void };
const queue: Job[] = [];

setInterval(() => {
  const job = queue.shift();
  if (!job) return;
  observe(
    {
      name: "get_latest_version",
      spanType: "TOOL",
      input: { pkg: job.pkg },
      parentSpanContext: job.parent ?? undefined,
    },
    async () => ({ pkg: job.pkg }),
  ).then(job.done);
}, 10);

export const enqueue = (pkg: string) =>
  new Promise((done) =>
    queue.push({ pkg, parent: Laminar.serializeLaminarSpanContext(), done }),
  );
This snippet isolates context propagation with a placeholder tool result. With parentSpanContext, the test produced one trace containing both tool spans under the root. Production workers also need error handling and lifecycle cleanup.
For jobs that cross process boundaries, see distributed tracing for AI agents. The local queue test does not establish behavior for every queue or transport.
Flush before short-lived processes exit
Laminar exports spans in background batches. A short-lived process can end before its final spans leave.
Removing await Laminar.shutdown() from this script reproduced that loss. Six of eight spans arrived; the root and final model call were missing. Laminar showed 4.14 seconds and $0.00742, without the final answer. Complete runs of the same agent took 11.19 to 13.58 seconds and cost $0.0166 to $0.0184.
Choose cleanup based on the process lifecycle:
| Process | Call |
|---|---|
| Script, CLI, one-off job | await Laminar.shutdown() when tracing is finished |
| Serverless handler | await Laminar.flush() before returning, on every invocation |
| Long-running server or worker | No routine per-request flush; shut down the SDK during graceful shutdown |
The serverless recommendation comes from Laminar's SDK and documentation; Lambda was not tested here.
flush() exports buffered spans and waits for exports already in flight. shutdown() also flushes, then releases SDK resources. Avoid routine flushing inside long-running web request handlers because it adds latency. The flushing and shutdown guide explains the lifecycle choices.
Add sessions, users and metadata
Use sessionId to group runs belonging to one conversation or job. Reusing the value across turns lets you inspect them as a session. userId identifies the application user; metadata can record the prompt or agent version.
These fields also let you query across runs in Laminar's SQL editor. This query groups one user's recent traces by prompt version:
SELECT
  JSONExtractString(metadata, 'prompt') AS prompt,
  count() AS runs,
  round(avg(total_cost), 4) AS avg_cost,
  round(avg(duration), 1) AS avg_seconds
FROM traces
WHERE user_id = 'user-42'
  AND start_time > now() - INTERVAL 7 DAY
GROUP BY prompt
The test project returned prompt v3, 5 runs, $0.0153 average cost and 10.8 seconds average duration. That sample includes the deliberately incomplete no-flush trace, so these averages demonstrate the query rather than establish a complete-run baseline. Check trace completeness before interpreting aggregate cost or latency.
When OpenTelemetry or AI SDK telemetry fits better
You already operate an OpenTelemetry Node SDK and collector. Check native provider-SDK tracing and compatible instrumentations before adding another setup. Package versions matter here.
As of November 20, 2026, the contrib OpenAI instrumentation 0.23.0 documents support for openai >=4.19.0 <7. The separate OpenAI test for this guide used 7.62.0, outside that documented range.
The contrib Anthropic instrumentation 0.2.0 targets @anthropic-ai/sdk >=0.65.0 <0.134.0. Its README says newer Anthropic SDKs emit their own GenAI spans when a global tracer provider is registered. The older instrumentation's limited content capture therefore does not establish a limitation of current Anthropic native tracing.
OpenTelemetry's "ECMAScript Modules vs. CommonJS" document specifies --experimental-loader=@opentelemetry/instrumentation/hook.mjs for ESM runtime patching. Native SDK spans are a separate path. These alternatives were reviewed through documentation, not run against this agent. You still need spans around your custom loop and tools. See OpenTelemetry for AI agents for the tracing and export setup.
Your agent already uses the Vercel AI SDK. Its telemetry integration can be the more direct fit: generateText and streamText emit operation, model-step and tool-call spans. Follow Vercel AI SDK observability, including its Next.js setup, rather than copying provider-level patching unchanged.
FAQ
Does this work with the OpenAI SDK instead of Anthropic?
Yes. Import OpenAI's default export and pass it under the OpenAI key in instrumentModules. Tests with openai 7.62.0 recorded openai.chat spans for Chat Completions and openai.response spans for Responses, with token counts. Keep the run/tool wrapper pattern, but adapt the provider requests and tool-result payloads. See the OpenAI integration page.
Are streamed responses traced?
The client.messages.stream() test recorded one anthropic.chat LLM span under its parent, with 11 input and 13 output tokens. That completed-stream result does not establish cancellation or abandoned-stream behavior; test those paths if your application uses them. The Anthropic integration page covers supported methods.
Can I trace LangChain.js or LangGraph.js agents?
Yes, with a different instrumentModules configuration. The langchain entry takes framework modules such as callbackManagerModule and chatModelsModule; provider SDK modules go at the top level. Laminar's LangChain guide passes them explicitly under ESM, where nothing is recorded without them. Follow the LangChain and LangGraph guide for the module keys rather than assuming { anthropic } also instruments the framework.
Can native provider telemetry duplicate model spans?
Laminar alone did not duplicate them in this setup: each Anthropic call produced one anthropic.chat span. Laminar uses its own tracer provider without registering it globally, while Anthropic's native tracing reads the global provider. If another library registers one, Anthropic may emit native spans there too. Its openTelemetry: false client option disables those native spans when that is your intended configuration.