
Vercel AI SDK observability records an agent's model calls, tool executions, and generation steps in a trace, including their inputs, outputs, token usage, cost, and errors.
In the order-support run below, getOrder threw Order A-1002 not found. The SDK passed that error back to the model, which answered both parts of the customer's question: A-1001 had shipped via UPS with an ETA of 2026-10-09; A-1002 could not be found. The script exited cleanly after two steps and 1,024 tokens. Laminar marked the trace as error.
The answer reported the missing order, but did not distinguish a failed lookup from a valid "not found" result. The tool span preserved that distinction.
This guide sets up tracing with Laminar on AI SDK 7 and on AI SDK 5 and 6. It covers Next.js deployment, follows the failing lookup through its trace, and uses SQL to find similar failures across runs.
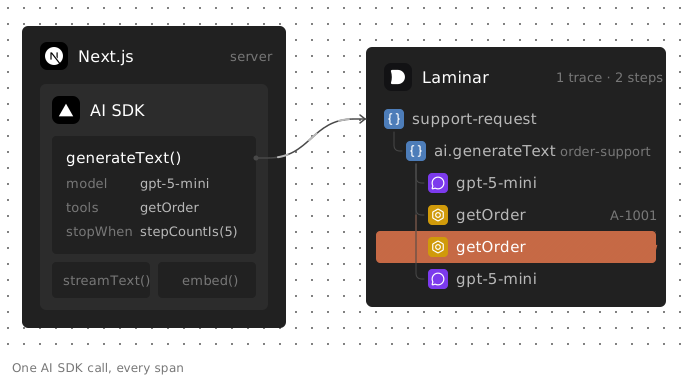
What Vercel AI SDK observability should capture
A generateText call with tools can involve several model requests. The model selects a tool, the SDK runs its execute function, and the result goes back to the model. With a multi-step stop condition, generation continues until the model finishes or the condition stops it.
Your trace needs to preserve that loop:
- Model calls: instructions, messages, output, model name, tokens, and cost.
- Tool calls: arguments, results, and errors.
- Parent operations: a span for each generateText or streamText call, grouping its steps.
- Request context: user, session, and feature identifiers you can filter on later.
Timing matters too. Two tool spans at the same level may run concurrently. A flat log can obscure that relationship or mix their output with another request's.
HTTP status alone cannot describe the loop. A route can return successfully after the model handles a tool error. The standalone script in this guide made no HTTP request. Our agent observability guide covers the broader method; this article focuses on the AI SDK.
How the AI SDK emits telemetry
Laminar records AI SDK operations as OpenTelemetry spans. The integration entry point changes by SDK version.
- AI SDK 7 has a global registry. Call registerTelemetry(...) once at startup. Per-call settings live in telemetry.
- AI SDK 5 and 6 require experimental_telemetry: { isEnabled: true, tracer } on each call. Omitting it means no AI SDK telemetry for that call.
Span names changed too. The recorded runs used the same functionId: 'order-support':
| AI SDK 7.0.130 | AI SDK 6.0.301 | |
|---|---|---|
| Parent span | ai.generateText order-support | order-support |
| Model span | ai.llm openai.responses:gpt-5-mini | ai.generateText.doGenerate |
Both versions produced LLM spans with token counts and cost. Update saved queries that depend on these names when migrating.
Unless stated otherwise, the tested examples used @lmnr-ai/lmnr 0.8.49, ai 7.0.130, and @ai-sdk/openai 4.0.86.
Set up tracing on AI SDK 7
Use an ESM-configured project for the standalone script, which uses top-level await. This command pins the tested SDK versions and adds the script's other dependencies:
npm install @lmnr-ai/lmnr@0.8.49 ai@7.0.130 @ai-sdk/openai@4.0.86 dotenv zod
npm install --save-dev tsx
Set the API keys:
LMNR_PROJECT_API_KEY=your-laminar-project-api-key
OPENAI_API_KEY=your-openai-api-key
Register telemetry before the first AI SDK call:
import 'dotenv/config';
import { registerTelemetry } from 'ai';
import { LaminarAiSdkTelemetry } from '@lmnr-ai/lmnr';

registerTelemetry(new LaminarAiSdkTelemetry());
The constructor calls Laminar.initialize() if needed. Initialization options, including an explicit API key or self-hosted base URL, go in laminarOptions.
The integration docs also document registerAiSdkTelemetry(), an equivalent helper exported by @lmnr-ai/lmnr, and tracing for embed calls. Those paths were not exercised in the recorded tests.
Set up tracing on AI SDK 5 and 6
Initialize Laminar at startup, then pass its tracer on each call:
import 'dotenv/config';
import { openai } from '@ai-sdk/openai';
import { generateText } from 'ai';
import { Laminar, getTracer } from '@lmnr-ai/lmnr';

Laminar.initialize();

const { text } = await generateText({
  model: openai('gpt-5-mini'),
  prompt: 'Where is order A-1001?',
  experimental_telemetry: {
    isEnabled: true,
    tracer: getTracer(),
    functionId: 'order-support',
    metadata: { plan: 'pro' },
  },
});

await Laminar.shutdown();
This example typechecked and ran with ai 6.0.301 and @ai-sdk/openai 3.0.124, producing the v6 spans above. The v5 setup follows the integration documentation; it was not tested here.
Per-call configuration makes coverage easy to miss when adding a route. For v7, replace initialization with telemetry registration and remove the old blocks. Move functionId into telemetry. Move metadata into runtimeContext and explicitly allow its keys through telemetry.includeRuntimeContext, as shown below.
Trace a multi-step tool loop
The complete agent has one tool, a two-order prompt, and a five-step limit. Its lookup throws for unknown IDs:
// agent.ts
import 'dotenv/config';
import { registerTelemetry, generateText, stepCountIs, tool } from 'ai';
import { openai } from '@ai-sdk/openai';
import { LaminarAiSdkTelemetry, Laminar, observe } from '@lmnr-ai/lmnr';
import { z } from 'zod';

registerTelemetry(new LaminarAiSdkTelemetry());

const orders: Record<string, { status: string; carrier: string; eta: string }> = {
  'A-1001': { status: 'shipped', carrier: 'UPS', eta: '2026-10-09' },
};

const getOrder = tool({
  description: 'Look up an order by its ID, for example A-1001.',
  inputSchema: z.object({ orderId: z.string() }),
  execute: async ({ orderId }) => {
    const order = orders[orderId];
    if (!order) throw new Error(`Order ${orderId} not found`);
    return order;
  },
});

const result = await observe({ name: 'support-request', sessionId: 'sess-42', userId: 'user-7' }, () =>
  generateText({
    model: openai('gpt-5-mini'),
    instructions: 'You are an order-support agent. Use getOrder before answering.',
    prompt: process.argv[2] ?? 'Where are my orders A-1001 and A-1002?',
    tools: { getOrder },
    stopWhen: stepCountIs(5),
    telemetry: { functionId: 'order-support' },
  }),
);

console.log(result.text);
console.log('steps:', result.steps.length, 'usage:', JSON.stringify(result.totalUsage));
await Laminar.shutdown();
Run it with npx tsx agent.ts.
Use instructions for the agent's instructions. A system role inside messages threw AI_InvalidPromptError in the v7 test.
stepCountIs(5) limits generation steps, not tokens or dollars. observe adds the support-request parent span and sets the user and session. Without that wrapper, the AI SDK operation is the root unless another active span provides a parent.
Laminar.shutdown() exports the remaining spans before the script exits.
The recorded run printed an answer covering both orders, followed by steps: 2. Usage was 406 input tokens and 618 output tokens, including 384 reasoning tokens. The trace view shows the run, with the failing getOrder call selected:
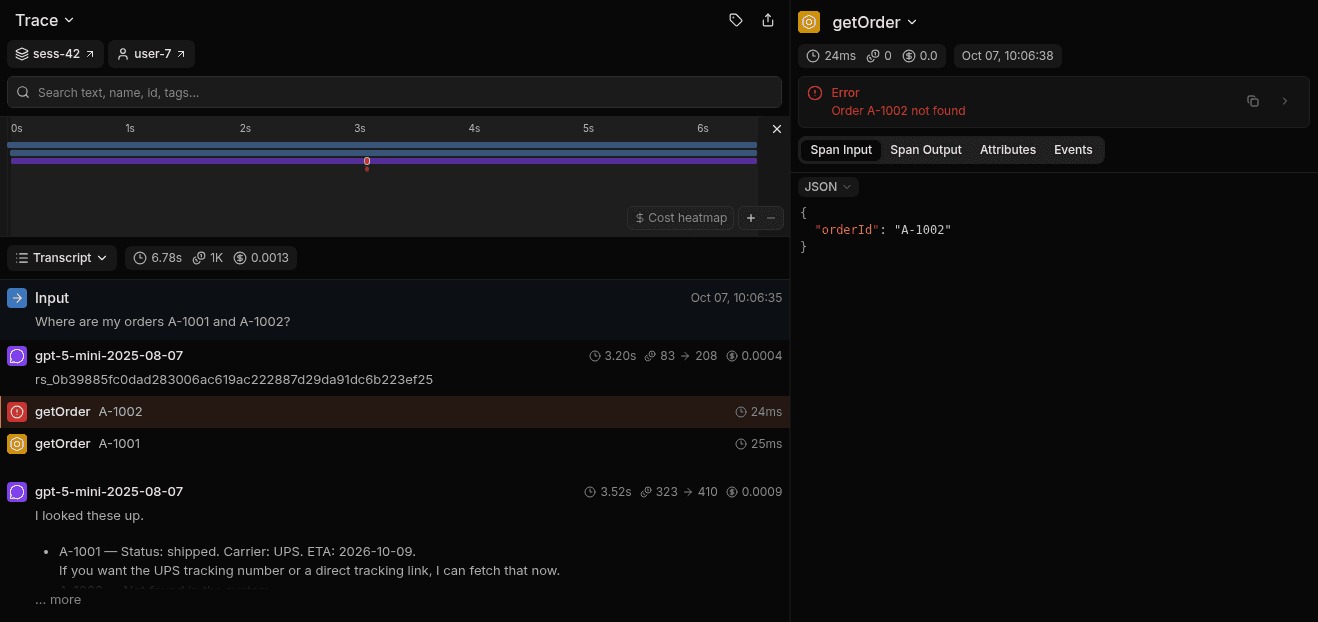
Both tool spans started at the same time. The second model call used one successful result and one error to write the answer.
The model spans sum to 1,024 tokens and $0.0013375. The trace has session sess-42, user user-7, and status error.
In this run, the thrown tool error did not reject generateText. The SDK supplied it to the model and generation continued. A clean script exit therefore did not mean every operation succeeded.
Add tracing to a Next.js app
The startup configuration below follows the Next.js integration guide. Register Laminar in instrumentation.ts, before route handlers run.
Keep Laminar external to the server bundle:
// next.config.ts
const nextConfig = {
  serverExternalPackages: ['@lmnr-ai/lmnr'],
};

export default nextConfig;
Use dynamic imports inside a Node.js runtime guard:
// instrumentation.ts
export async function register() {
  if (process.env.NEXT_RUNTIME === 'nodejs') {
    const { registerTelemetry } = await import('ai');
    const { LaminarAiSdkTelemetry } = await import('@lmnr-ai/lmnr');

    registerTelemetry(
      new LaminarAiSdkTelemetry({
        laminarOptions: { projectApiKey: process.env.LMNR_PROJECT_API_KEY },
      }),
    );
  }
}
On AI SDK 5 or 6, initialize Laminar inside the guard and pass getTracer() on each route's AI SDK calls. Before Next.js 15, also set experimental: { instrumentationHook: true } in next.config.js.
This minimal route handler typechecks:
// app/api/chat/route.ts
import { openai } from '@ai-sdk/openai';
import { streamText } from 'ai';

export async function POST(req: Request) {
  const { messages } = await req.json();
  const result = streamText({
    model: openai('gpt-5-mini'),
    instructions: 'You are an order-support agent.',
    messages,
  });
  return result.toTextStreamResponse();
}
For several AI SDK calls in one request, use an observe wrapper to group them if no request span already exists.
If the app also uses OpenAI or Anthropic clients directly, the documented setup uses Laminar.patch({ OpenAI, anthropic }) where those clients are constructed. AI SDK registration alone does not configure that separate integration.
Serverless and edge: what works
This integration supports Node.js serverless functions, not the Edge runtime. These deployment behaviors are documented, rather than tested by the standalone run.
The runtime guard skips Laminar on Edge routes. Those routes can still execute, but this setup will not trace them.
Laminar exports spans in background batches. A serverless function can freeze after responding, before its final batch leaves. Call await Laminar.flush() after the work you need recorded. Use await Laminar.shutdown() when a script or job exits.
When spans are missing, check the route runtime, exporter lifecycle, and deployed API key before changing agent code.
Running alongside @vercel/otel
If the app already uses @vercel/otel, pass Laminar's instrumentations to that provider before registering AI SDK telemetry:
// instrumentation.ts
import { registerOTel } from '@vercel/otel';

export async function register() {
  if (process.env.NEXT_RUNTIME === 'nodejs') {
    const { registerTelemetry } = await import('ai');
    const { initializeLaminarInstrumentations, LaminarAiSdkTelemetry } = await import('@lmnr-ai/lmnr');

    registerOTel({
      serviceName: 'my-service',
      instrumentations: initializeLaminarInstrumentations(),
    });

    registerTelemetry(new LaminarAiSdkTelemetry());
  }
}
This avoids registering a second tracer provider. The coexistence documentation specifies this ordering.
The same ordering applies with @sentry/nextjs: initialize the other library first, then Laminar. If its handler span is active, AI SDK calls group beneath it without an additional observe wrapper.
These configurations were not exercised in the test run. The OpenTelemetry for AI agents guide explains how parent spans and integrations compose.
Attach users, sessions, and metadata
On AI SDK 7, put request context in runtimeContext. Explicitly select the keys to export with telemetry.includeRuntimeContext:
const { text } = await generateText({
  model: openai('gpt-5-mini'),
  prompt: 'Where is order A-1001?',
  runtimeContext: {
    userId: 'user-ctx-9',
    sessionId: 'sess-ctx-9',
    tags: ['ctx-test'],
    plan: 'pro',
    internalToken: 'do-not-export',
  },
  telemetry: {
    functionId: 'ctx-check',
    includeRuntimeContext: { userId: true, sessionId: true, tags: true, plan: true },
  },
});
The test produced user user-ctx-9 and session sess-ctx-9 on the trace. The ai.generateText ctx-check span had tag ctx-test, and trace metadata contained {"plan":"pro"}. internalToken was not exported through runtime-context telemetry.
The named user, session, and tag fields receive special handling. Other selected keys become metadata. This integration behavior requires @lmnr-ai/lmnr 0.8.49 or later.
Use a stable session ID across conversation turns. That lets you inspect the context before a bad answer rather than treating each turn as an unrelated run. The tracing structure docs describe these fields.
Keep sensitive data out of traces
recordInputs and recordOutputs control payload recording globally. Both default to true:
registerTelemetry(new LaminarAiSdkTelemetry({ recordInputs: false }));
In the test, input fields were empty on the ai.generateText and ai.llm spans. The model span still recorded token counts.
Disabling inputs does not disable output recording. If outputs can repeat customer data, configure recordOutputs too. Review metadata and error messages separately before exporting sensitive content.
The documented per-call setting telemetry: { isEnabled: false } disables tracing for that call. That option was not exercised in the recorded tests.
Debug the failing tool call
Laminar's documented transcript view presents instructions, messages, tool calls, and the final answer as a conversation. For this failure, inspect the getOrder span's arguments and thrown message, then compare them with the model's response.
Use the SQL editor to search beyond one trace. This query finds recent tool spans recorded as errors:
SELECT trace_id, name, output, start_time
FROM spans
WHERE span_type = 'TOOL'
  AND status = 'error'
  AND start_time > now() - INTERVAL 1 DAY
ORDER BY start_time DESC
LIMIT 20
Against the test data, it returned one row: getOrder, output "Order A-1002 not found", and the trace ID.
Join spans to traces to count failed lookups by user:
SELECT t.user_id, count() AS failed_lookups
FROM spans s
JOIN traces t ON s.trace_id = t.id
WHERE s.name = 'getOrder' AND s.status = 'error'
GROUP BY t.user_id
ORDER BY failed_lookups DESC
That query returned user-7 with one failed lookup. Unlike the first query, it has no time filter. Add one when comparing counts within a specific window.
The CLI documents the equivalent terminal command, lmnr-cli sql query "..."; the recorded tests used the SQL queries directly.
Error counts tell you where to investigate. They do not prove whether customers supplied invalid IDs or the orders backend malfunctioned.
Your tool's error policy also determines what these queries find. Returning { found: false } normally produces a successful tool span, with the negative result in its output. Throwing produces an error span. Throw for execution failures; do not turn an expected domain result into an exception just to make a query match.
For failures without exceptions, Signals evaluate incoming traces using a plain-language question and JSON output schema, recording matching events. The documented default Failure Detector applies to traces over 1,000 tokens. This run meets that threshold, but Signals were not run in this test.
The failure detection guide covers designing those checks, including failures hidden behind successful operations.
To iterate on the tool, the documented debugger workflow uses wrapLanguageModel from @lmnr-ai/lmnr. It replays from a checkpoint and serves unchanged model calls from cache. Debugger replay was not tested here.
FAQ
Which observability tools have a TypeScript SDK that works with the Vercel AI SDK in serverless Next.js?
Laminar's TypeScript SDK, @lmnr-ai/lmnr, integrates with AI SDK 5, 6, and 7 and runs in Node.js serverless functions. It does not support the Edge runtime. For any tool, check three things: spans for both model and tool calls, a documented way to flush before the function freezes, and support for the AI SDK version you run. The agent observability guide covers what else to compare.
Does this trace useChat?
Not directly. useChat runs in the browser, and this integration traces AI SDK calls on the server. The route handler that useChat posts to, usually a streamText call in app/api/chat/route.ts, is what appears as a trace. Pass the same session ID on every turn to see a conversation as one session. The Next.js guide shows the server-side setup.
Why is my trace marked error when the request succeeded?
Because a tool threw during the run. In the tested run, the AI SDK passed the thrown error back to the model instead of rejecting generateText, so the call returned an answer and the script exited cleanly. The tool span still recorded the error, and the trace took the status error. Open the failed tool span in the trace view to see its arguments and message.
Does Laminar trace generateObject, streamObject, and embed?
Yes. The integration docs state that the same setup covers streamText, generateObject, streamObject, and embed. The run recorded for this guide used generateText with a tool.
How do I group several AI SDK calls into one trace?
Wrap them in observe. Each generateText or streamText call otherwise becomes its own root span, unless a parent span is already active. observe also takes the user and session IDs for the whole request. The observe reference lists its options.
Do I need @vercel/otel to trace the AI SDK in Next.js?
No. Laminar can initialize its own tracer provider. If your app already uses @vercel/otel, pass initializeLaminarInstrumentations() to registerOTel, then register AI SDK telemetry. Reuse the existing provider rather than creating a competing one.