
Automatic failure detection for AI agents means finding the runs that went wrong without anyone writing a rule for that specific failure first. Most agent failures never throw. A tool call times out, the model fills the gap with plausible numbers, the HTTP status is 200, and the user gets a confident, wrong answer. Laminar detects these failures by reading every trace end to end with an investigating agent, turning each finding into a structured event, grouping events into named failure patterns, and alerting on the ones that matter, usually before users notice. This article explains how that pipeline works, what the built-in Failure Detector flags out of the box, and how to extend it to your own definition of failure.
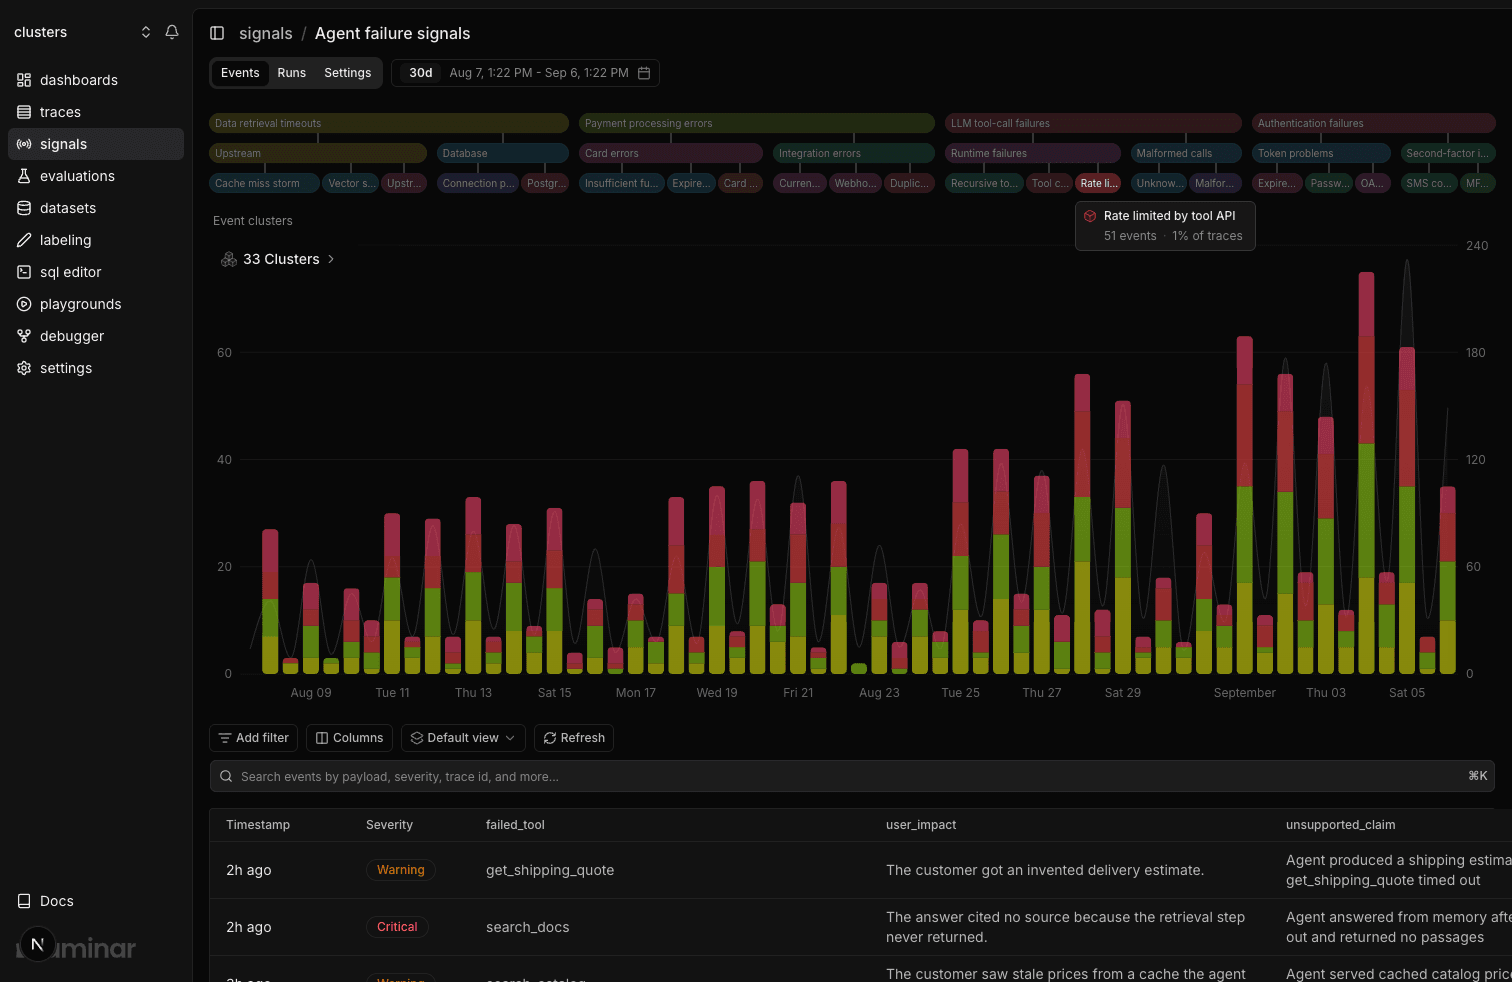
Why agent failures do not show up in error rates
Classic monitoring is built around a signal the code emits on purpose: an exception, a non-2xx status, a latency percentile crossing a line. An AI agent emits none of those when it:
- loops on the same tool call with the same arguments until it runs out of steps
- retries a failed search three times and then answers from memory as if the search had worked
- ignores a precondition in its own system prompt ("always confirm before charging the card")
- tells the user "I've sent the email" when no send_email call succeeded
- picks the wrong tool, gets an irrelevant result, and builds the rest of the run on it
Every one of these is a successful trace by infrastructure standards. Status ok, cost normal, duration unremarkable. The agent fails silently, and the first report comes from a user. The failure exists only in the content: what the tools returned, what the model said next, and whether those two agree. Detecting it means reading the run, not counting its metrics. Everything below follows from that constraint.
Failure detection that reads the whole trace
In Laminar, a failure detector is a Signal: a plain-language description of the failure, a JSON schema for what to extract when it is found, a trigger that says when to look (when a trace finishes, or when a specific named span finishes), and filters that narrow which traces are worth reading. There are no regexes, span-name matchers, or thresholds to maintain. The description is the rule.
When a finished trace matches a Signal, Laminar runs a small investigation in three stages.
1. The trace is condensed. Agent traces are long: hundreds of spans, megabytes of tool output, the same system prompt repeated on every LLM call. Reading all of that verbatim on every run would be slow and expensive, so Laminar first reduces the trace to a much smaller working view of the run. The reduction is lossy on purpose. The full content of every span stays available to the investigation that follows.
2. An agent investigates the trace. Your prompt does not run as a one-shot classification. Laminar runs it as an agent with tools. It can search span content for a string (an error code, a tool name, a phrase the user typed), fetch the full input and output of any span when the condensed view is not enough, and submit findings as it goes. The investigation is grounded in the trace: each finding cites the spans it came from and quotes the evidence, and the agent is instructed not to bring in outside knowledge or infer rules the trace never stated.
3. Findings become structured events. Each finding becomes a signal event attached to the trace: a one-line summary, a severity (critical, warning, or info), and a payload that conforms to your schema. A run with zero findings is recorded as a clean run. Events are rows: you can filter them, query them in SQL, cluster them, and alert on them.
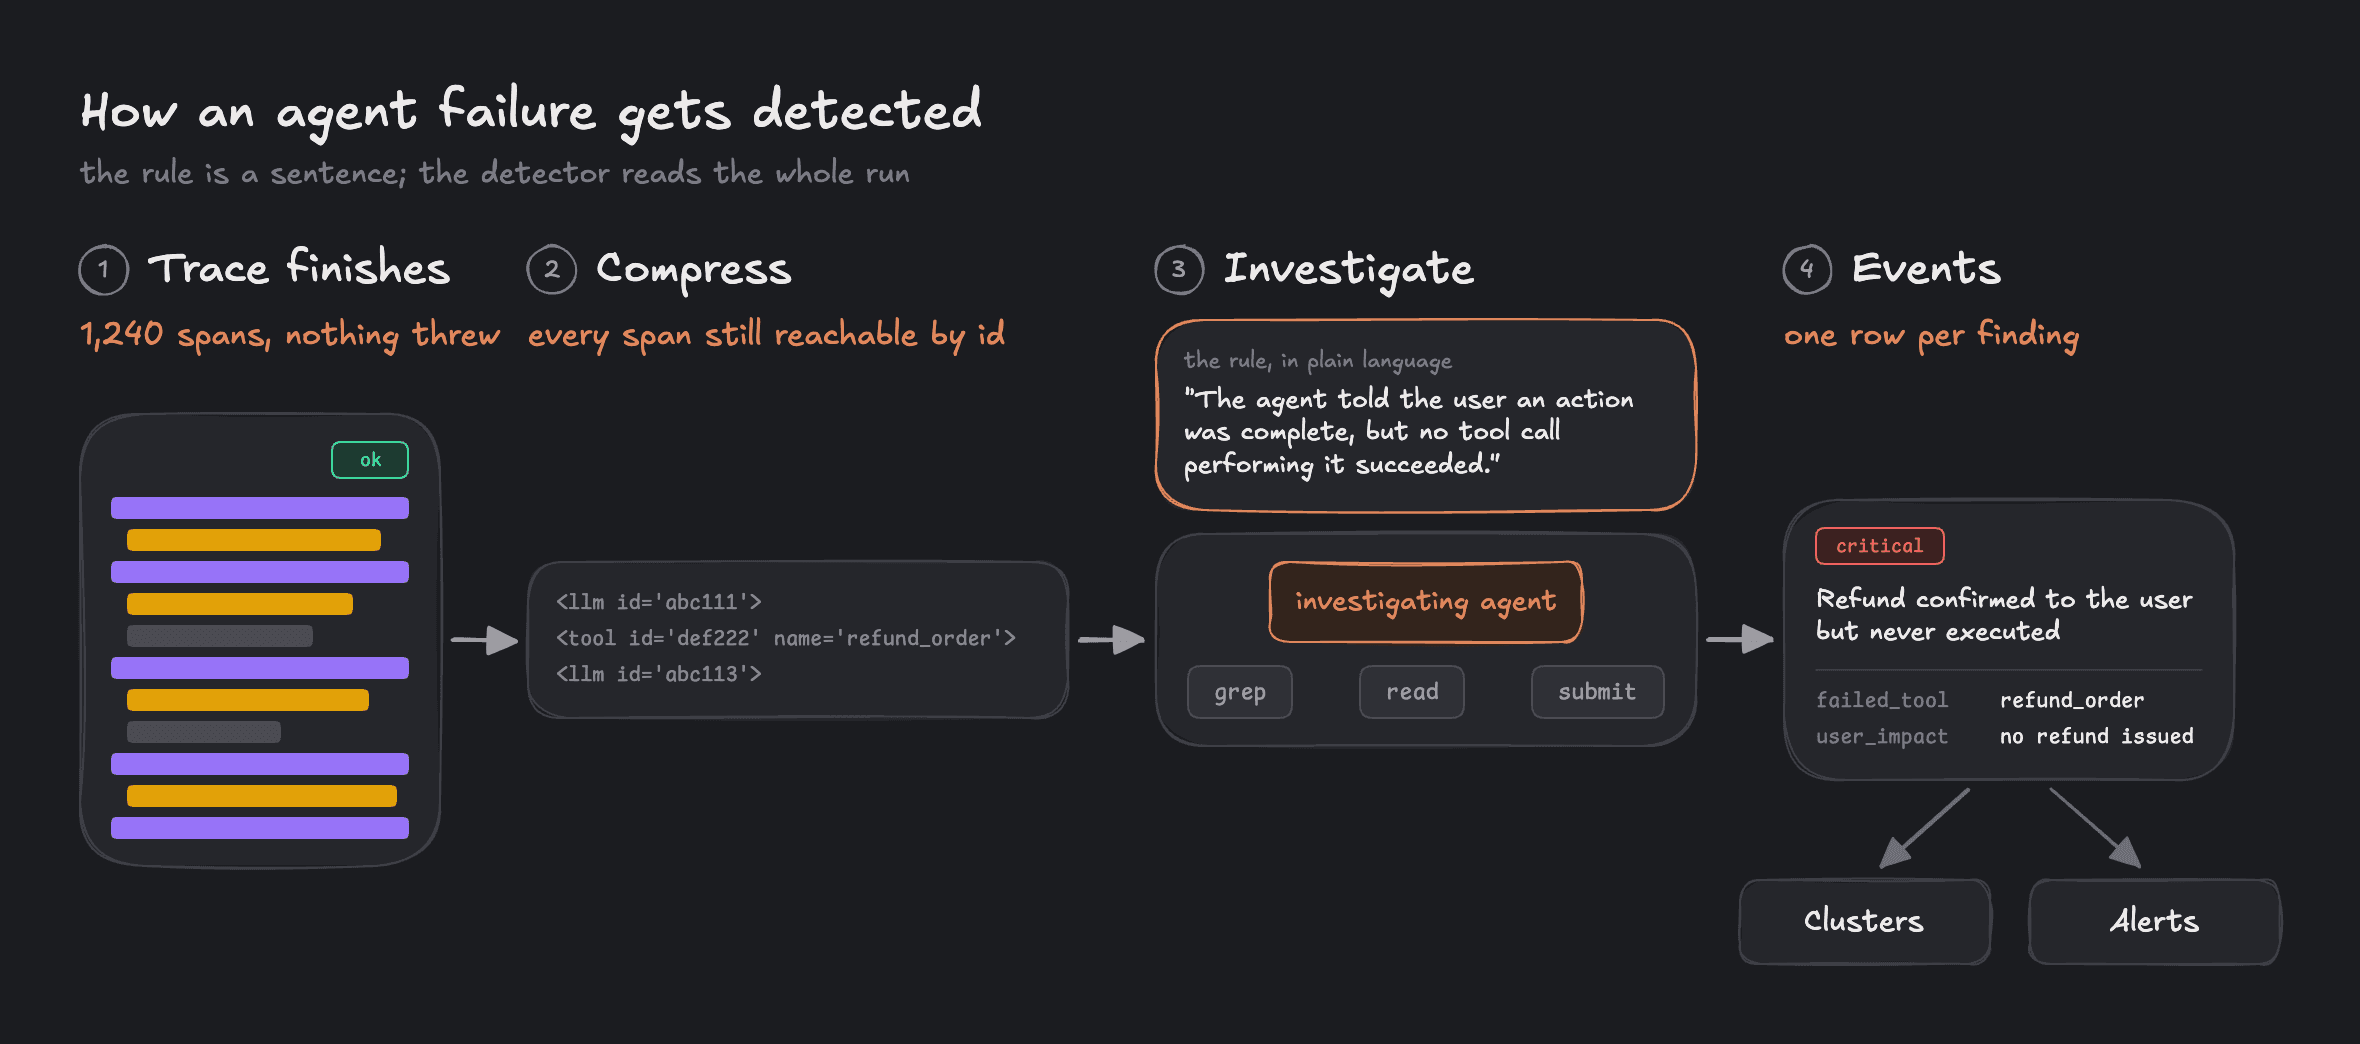
Because detection reads content instead of metrics, the same pipeline handles a five-second chat turn and a forty-minute coding-agent session with thousands of spans. The condensing step is what makes the second case affordable.
The Failure Detector that ships with every project
Every new Laminar project comes with a Signal called Failure Detector already running. It triggers when a trace finishes and reads any trace over 1,000 tokens, which skips trivial one-shot calls where there is nothing to investigate. It reports one finding per distinct failure that meets one of four bars:
- A wrong action or flawed reasoning that changed the outcome or wasted substantial work.
- A violation of a stated instruction or precondition from the system prompt, the user's request, or a tool's contract.
- Repeated near-identical failures that consumed a substantial part of the run. These are reported once with a count, not once per repetition.
- A factual assurance to the user that the tool results and context do not support.
Just as important is what it is told not to report: a single minor slip the agent corrected on its own, or a skipped verification step when the evidence already sufficed. A detector that flags every imperfection trains the team to ignore it.
Open an event and you land on the trace it came from in transcript view, where the tool result the finding quotes and the model's next turn are a scroll apart. Nothing about the built-in detector is special. It is a Signal like any other, so you can read its prompt, tighten it for your domain, narrow its filters, or pause it. The Signals quickstart walks through the whole loop on a fresh project.
Failures grouped into patterns, not a list of four thousand events
A detector that produces one event per failing trace produces a firehose on any high-volume workload. Laminar clusters events by the meaning of their summaries. Similar findings land in the same cluster, clusters roll up into parents up to three levels deep, and each cluster is named by AI, bottom-up, so a parent reads one abstraction level above its children ("Payment processing errors" over "Card errors" and "Integration errors") instead of repeating the name of its largest child.
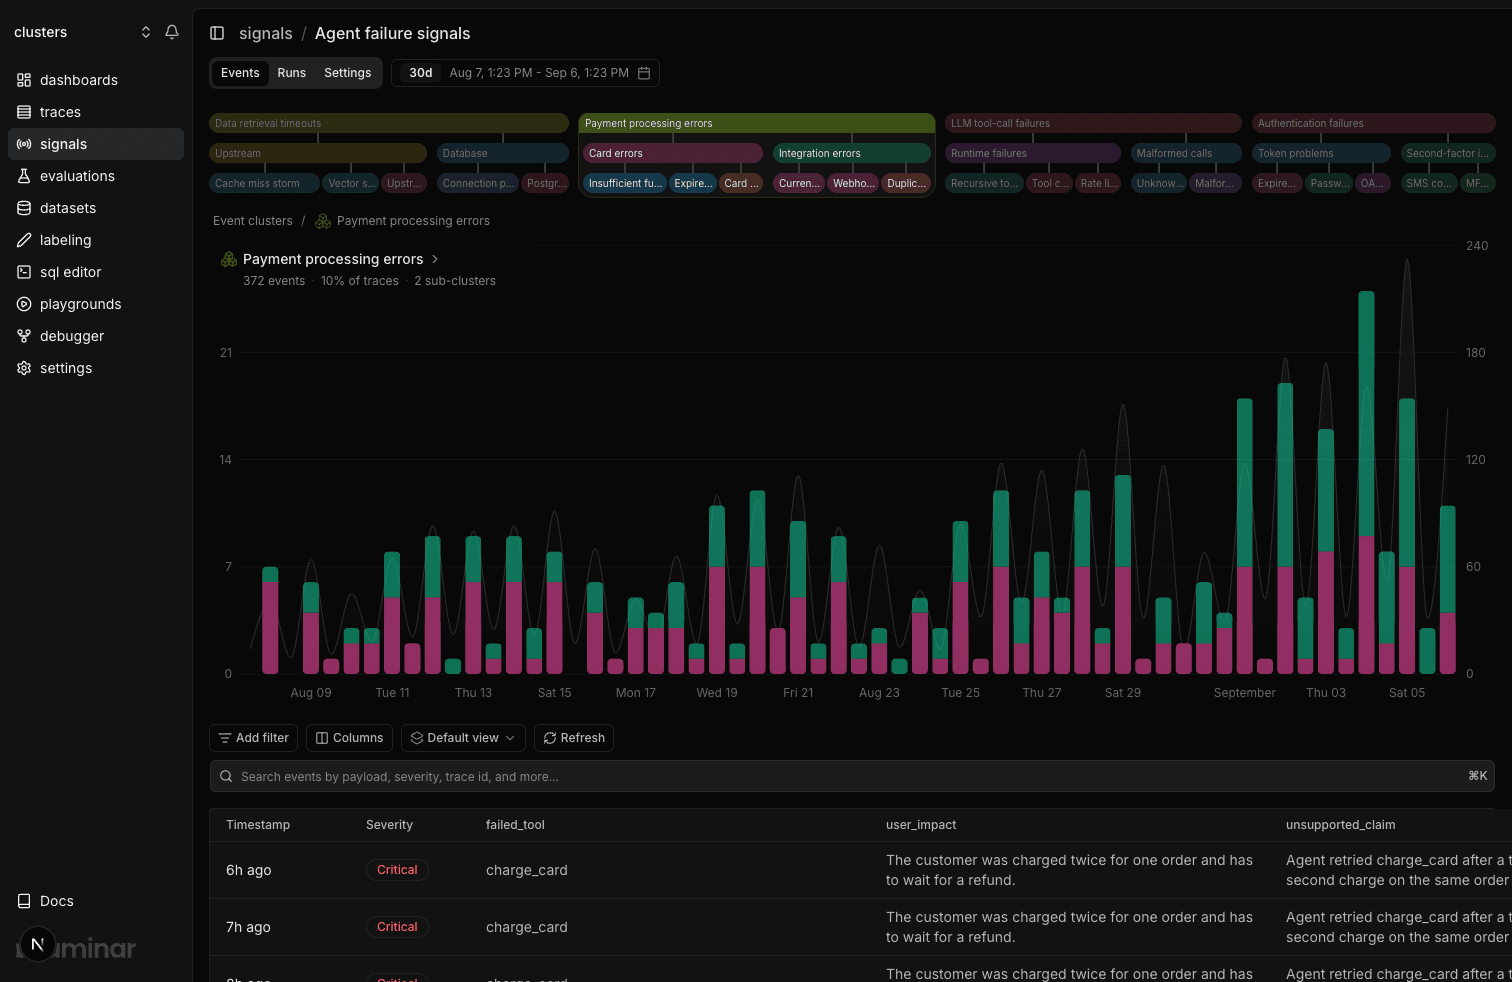
Nobody defines the categories. They emerge from the failures your agent actually produces, clustering typically lands within a minute of the event, and cluster names refresh as membership shifts. This is what turns "we have 372 failure events this month" into "10% of traces hit payment processing errors, and most of those are the agent retrying charge_card after a timeout and charging twice."
Clusters are data, not just a visualization. The traces table carries the clusters each trace landed in, so ranking failure patterns by what they cost is one query:
SELECT
    c.name AS cluster,
    count() AS traces,
    round(sum(total_cost), 4) AS cost
FROM traces
ARRAY JOIN clusters AS c
WHERE start_time > now() - INTERVAL 7 DAY
  AND c.level = 1
GROUP BY cluster
ORDER BY cost DESC
Alerts on the failure itself, not on a threshold
Because each detection is a structured event, alerting is a filter over events rather than a metric crossing a line. An alert fires on a New event or a New cluster. You choose which severities qualify, and you can filter on the fields of your own output schema: failed_tool = charge_card, isFailure = true. A "Skip notifications for similar events" toggle notifies you on the first event of a semantically similar group and stays quiet for the rest, so a burst of the same failure is one message, not fifty.
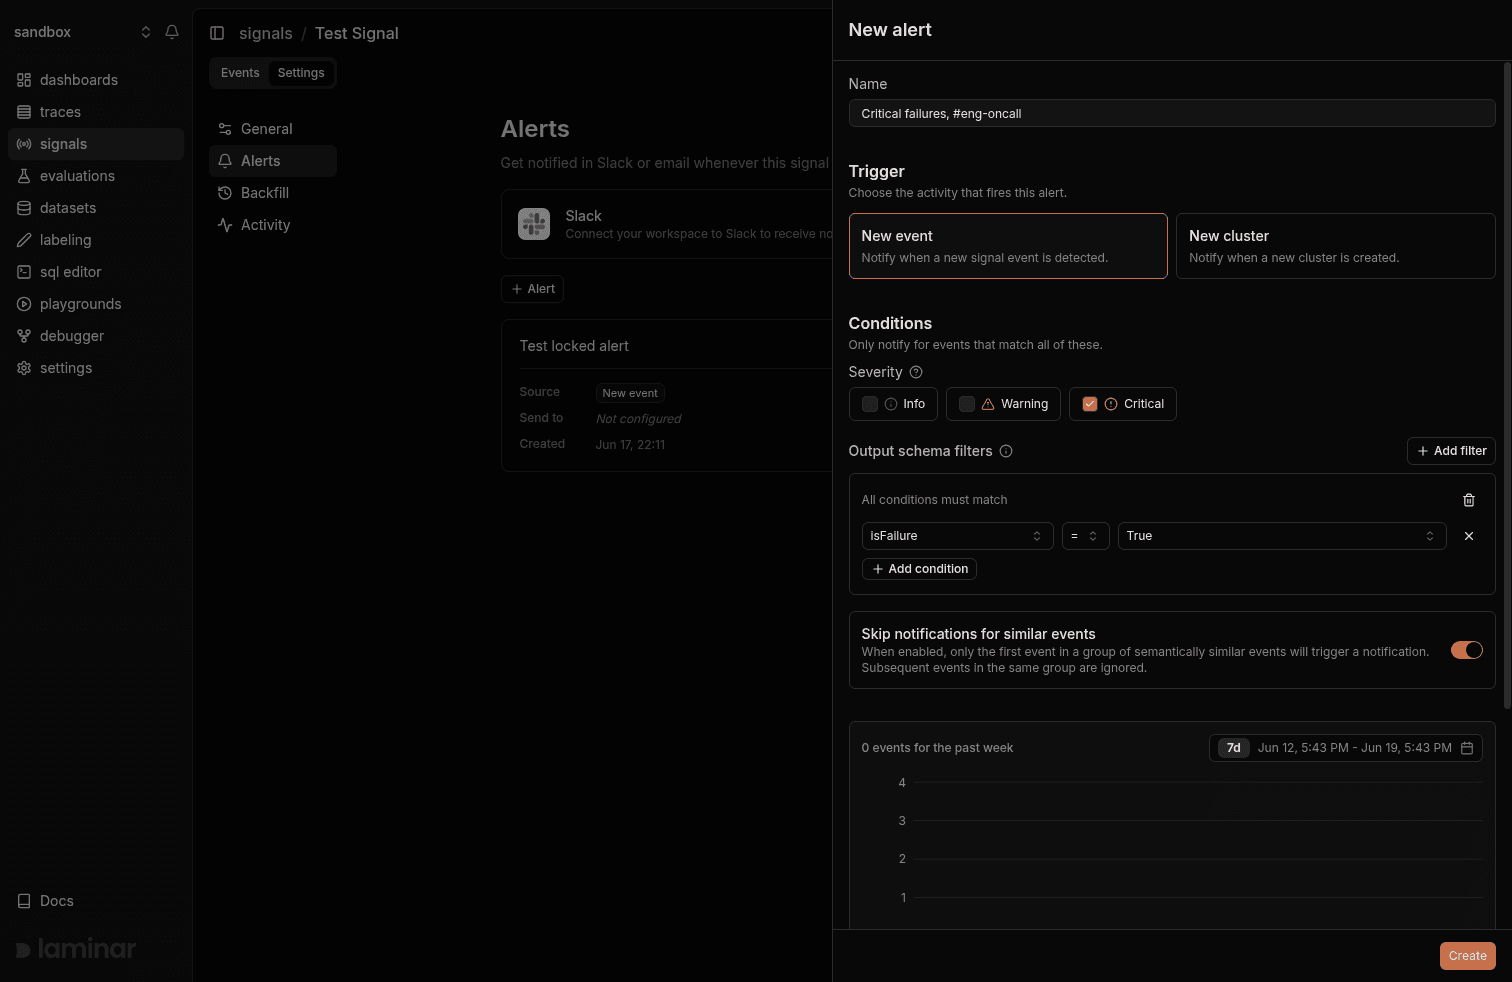
Alerts deliver in-app, to a Slack channel, or by email. Every new Signal starts with a critical-severity alert and, when clustering is on, a new-cluster alert, both in-app, so a brand-new detector is never silent by accident.
In Slack, the alert is where the investigation starts rather than where it ends. Mention @Laminar in the alert thread and the Laminar Agent reads the trace, runs SQL across the project, and answers in the thread: which tool failed, how many other traces hit the same cluster this week, what the user was asking for. For the slower cadence, reports post a weekday and a weekly summary of signal activity to the same channels.
Detection across your history, not only new traces
A live detector answers "is it happening now." The more common question when you first write one is "how often has this been happening." Every Signal can be run as a backfill over a time range and filter set, or over a hand-picked list of traces.
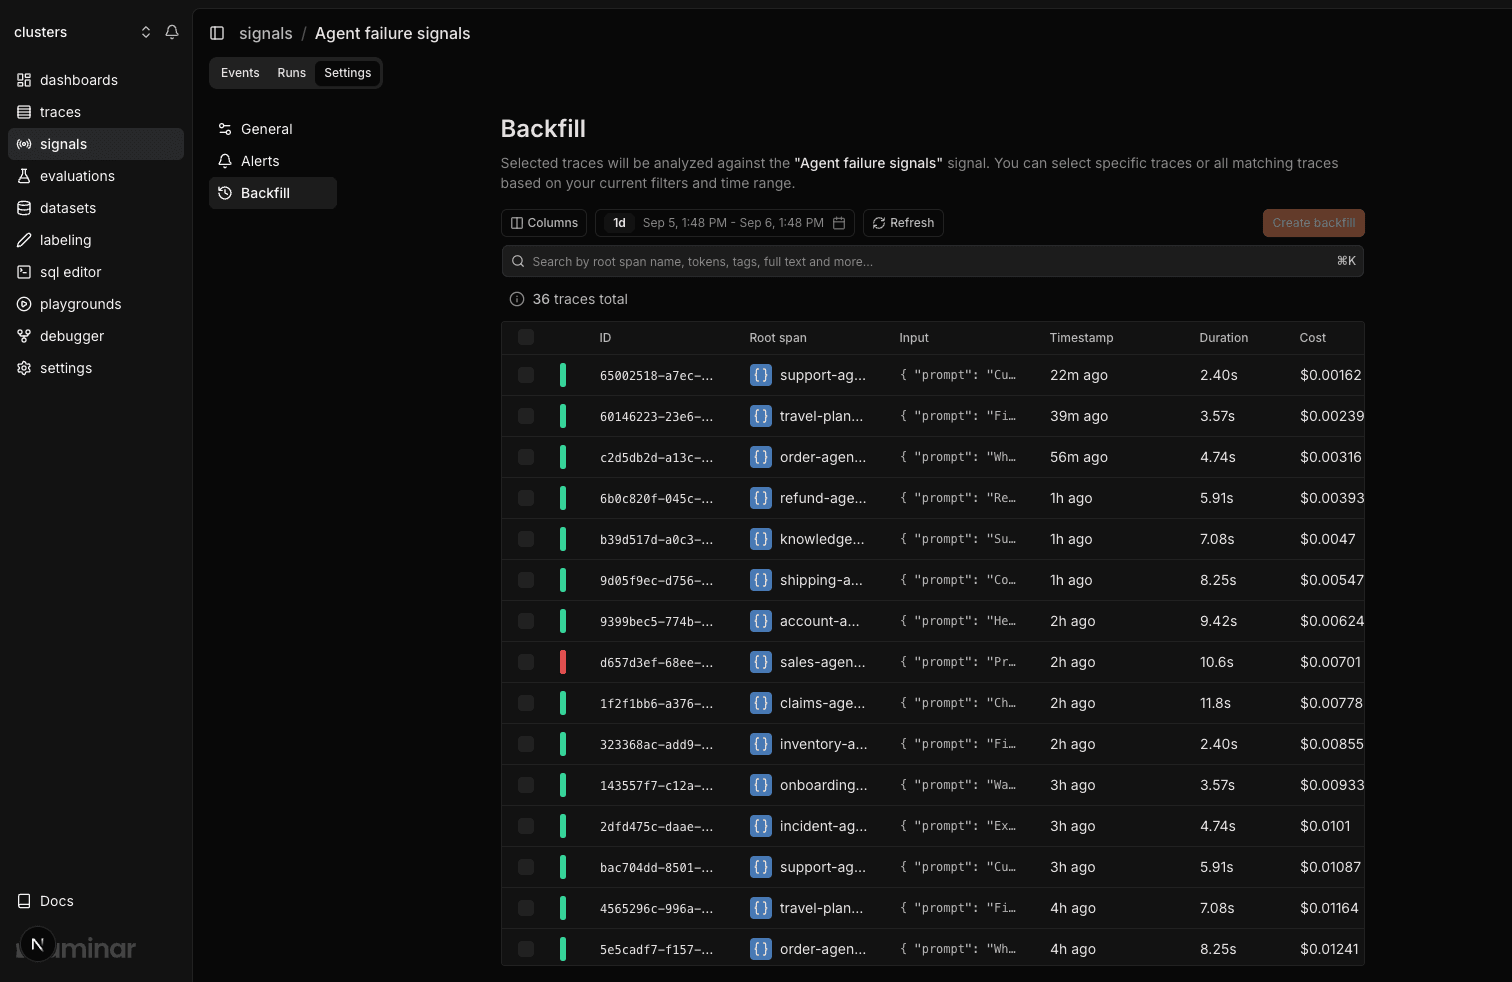
Backfill is also how you calibrate a new definition of failure before you trust it live. Run it over last week's traces, read the events, and if it over-fires, tighten the prompt and run it again. The Runs tab lists every run, live or backfilled, with its outcome, so you can see how many traces the detector read and how many produced findings.
Writing your own failure detector
The built-in detector covers general agent failure. Most teams add two or three detectors for the failures that are specific to their product, and those are usually one sentence each:
- "The agent told the user an action was complete, but no tool call performing that action succeeded in the trace."
- "The agent called the same tool with the same arguments more than three times without a different result."
- "The user repeated or rephrased the same request after the agent's answer, indicating the first answer did not help."
- "The agent produced a final answer containing a number, date, or name that does not appear in any tool result."
Pair the sentence with a schema for the fields you want on every event. A failed_tool field lets you filter and alert per tool; a user_impact field gives a reviewer the consequence without opening the trace; a categorical enum field gives you a breakdown chart for free. Then pick the trigger: when the whole trace finishes (the default), or when a specific span finishes, which is the right choice for one step inside a long workflow.
The same definition can be created from the terminal with the Signals CLI:
lmnr-cli signal create "Claimed action never executed" \
  --prompt "The agent told the user an action was complete (sent, booked, charged, saved), but no tool call performing that action succeeded in the trace. Quote the claim and name the tool that should have run." \
  --schema '{
    "type": "object",
    "properties": {
      "claimed_action": {
        "type": "string",
        "description": "What the agent said it did"
      },
      "expected_tool": {
        "type": "string",
        "description": "The tool that should have succeeded"
      }
    },
    "required": ["claimed_action", "expected_tool"]
  }'
From a detected failure to a fix
Detection is only useful if the distance from event to fix is short. Each event links to its trace, and the same Laminar Agent that answers in Slack is available in the trace view, over MCP from a coding agent, and from the CLI, so the failure can be investigated from wherever the fix will be written.
The events themselves are queryable in the SQL editor: signal_events for one row per finding, clusters for the patterns, and traces.signal_events when the row you want back is the trace. That makes "every trace where the agent charged twice this month" a query, and a query result can be saved as a dataset. A dataset of real failures is the regression suite your next prompt change gets evaluated against, and the debugger replays a failing trace with earlier LLM calls served from cache so the fix can be iterated on without re-running the whole agent.
For how these pieces fit into the wider platform (tracing, transcript view, SQL, dashboards), see What agent observability actually requires.
Manual rules, anomaly detection, and single-answer graders vs. whole-trace detection
Failure detection is not new. What changes with agents is what the detector has to read.
| Approach | What it reads | Catches | Misses |
|---|---|---|---|
| Status and exception monitoring | Span status, error attributes | Crashes, HTTP errors, timeouts that propagate | Any failure the agent absorbs and papers over |
| Metric anomaly detection | Token count, latency, cost, and error rate against a baseline | Spikes, regressions, and runaway loops that show up in the numbers | Content failures whose metrics look normal |
| Keyword and regex rules on outputs | The final message text | Known phrasings ("I'm sorry, I can't") | New phrasings, and failures that produce a fluent answer |
| LLM-as-judge on the final answer | One span: the last model output, sometimes plus the input | Wrong or low-quality final answers when the rubric is fixed | Failures visible only in the middle of the run (a tool that returned nothing, a retry loop, an ignored instruction) |
| Whole-trace Signals | A condensed view of the whole run, plus any span in full on demand | Failures defined by the relationship between tool results, instructions, and what the model said | Failures no plain-language description covers yet |
Metric anomaly detection and status monitoring still belong in the stack. Cost spikes and latency regressions are visible on dashboards and in SQL, and they are cheap to alert on. Single-answer graders belong in offline evaluations, where a fixed rubric over a fixed dataset is exactly what you want before a deploy. Whole-trace detection is the production layer: it runs on real traffic, it does not need the failure to be anticipated in advance, and it produces the dataset the graders run on.
Getting started
- Send traces. Laminar is OpenTelemetry-native, so any integration (Claude Agent SDK, OpenAI Agents SDK, Vercel AI SDK, LangGraph, Mastra, Pydantic AI, and others) or a plain OTel exporter works.
- Open Signals in the project. The Failure Detector is already there, and events appear as traces over 1,000 tokens arrive.
- Connect Slack under workspace integrations and point the detector's critical alert at a channel.
Laminar is open source and can be self-hosted; Signals are part of the licensed tier on self-hosted deployments and available on Laminar Cloud.
FAQ
Does automatic failure detection work with any agent framework?
Detection runs on traces, not on framework hooks, so anything that produces OpenTelemetry spans in Laminar is covered, including agents instrumented by hand. What matters for detection quality is that tool calls and LLM turns are visible as spans with their inputs and outputs. Auto-instrumented integrations do this by default; for manual instrumentation, marking tool functions with the TOOL span type is the single change that most improves what the detector can see.
Does Laminar analyze every single trace?
Only the ones that pass the Signal's filters. Beyond the token threshold, filters can restrict a detector to traces with a given status or containing specific span names, and a per-user sampling rate (5 to 95%) reads a slice of matching traces while keeping coverage spread across your users instead of concentrated on the noisiest one. A support team might run the Failure Detector on everything and a stricter, more expensive detector on a 20% sample.
How quickly do detected failures appear after a trace finishes?
In realtime processing mode, a live run finishes within minutes of the trace completing, and the alert fires as soon as the event is written. Batch processing mode, where it is offered, trades that for results within several hours at half the per-run price. Cluster assignment follows asynchronously, typically within a minute. Backfills over large time ranges complete in the background; the Runs tab shows progress.
Can automatic failure detection run on a self-hosted deployment?
Yes. Signals, clustering, and Slack and email alerts are enabled by an enterprise license key on the Helm chart; the self-hosting overview has the feature comparison between the OSS build, Helm, and Cloud. Each Signal on a self-hosted deployment runs on an LLM profile you configure in the workspace (OpenAI, Anthropic, Gemini, Bedrock, Azure, Groq, Mistral, or a custom OpenAI-compatible endpoint), so the investigating agent uses your provider account and your data stays in your infrastructure.
Does Laminar detect anomalies in AI agent behavior automatically?
Yes, in two senses. Anomaly detection in the usual monitoring sense flags a metric that departs from its baseline: token count, latency, cost, error rate. Laminar covers that with dashboards and SQL over traces and spans. Signal-based detection is complementary: it flags a trace whose content is wrong even when every metric is normal, which is the common case for agents. A duplicate charge and a correct charge have the same latency.
How do I tune a detector that fires too often?
Edit the prompt and backfill it over the same window. The most effective edits are the ones in the built-in detector: state what does not count (a single corrected slip, a skipped check when the evidence sufficed), require a citation for every finding, and ask for repeated identical failures to be reported once with a count. Splitting one broad detector into two narrow ones with distinct schemas also helps, because each can have its own severity rules and alert routing.
Can I get detected failures out of Laminar programmatically?
The same SQL that runs in the editor runs through the SQL API, the CLI (lmnr-cli sql query), and the MCP server, so signal_events and clusters can feed a nightly report, a ticketing system, or a coding agent's context. Slack and email alerts carry the signal name, the extracted payload fields, and a link back to the trace.
Does this cover LLM failure detection for single-call applications, not only multi-step agents?
Yes, though the token filter is worth adjusting. A single completion with a short prompt may sit under the 1,000-token default and never be read; lowering the filter on a dedicated Signal covers it. Detectors for single-call apps tend to be narrower ("the answer cites a source that does not appear in the retrieved context") and pair well with the retrieval step being visible as its own span in the trace.
Can I pause a failure detector without losing its history?
Yes. Switching a Signal to Inactive stops live runs and rejects new backfills but keeps every existing event and cluster, and switching it back on resumes detection on new traces from that point. The same switch exists on each alert, so a noisy alert can be silenced while the detector keeps recording.
Last updated: September 2026.