
AI token cost is what a model provider charges per token of text processed, billed at separate rates for input, output, cached reads, and reasoning. Rates are published per million tokens. Your bill is the sum of every call your application made, so controlling it means measuring tokens per request, not shopping for a cheaper plan.
How AI token cost works
Providers bill per token, not per request. A token is roughly four characters of English, so 1,000 tokens is about 750 words. Every call runs two meters: the tokens you send (input, also called prompt tokens) and the tokens the model generates (output, also called completion tokens).
The cost per token differs between them. Output typically runs 4x to 8x input on the same model. That asymmetry is the most important fact about LLM pricing, because it means a long system prompt is cheap compared to a model that rambles.
The arithmetic is simple:
cost = (input_tokens  / 1_000_000) * input_rate
     + (output_tokens / 1_000_000) * output_rate
A 3,000-token prompt with an 800-token answer on Claude Sonnet 5, at $2 per million in and $10 per million out:
input:   3,000 / 1e6 * $2   = $0.006
output:    800 / 1e6 * $10  = $0.008
                              -------
per call                      $0.014
A cent and a half per call looks like nothing. A million calls a month is $14,000, and that is before the multipliers below.
Prompt tokens vs completion tokens vs cached tokens
Modern providers bill more than two token classes. Ignoring the rest is where most AI token usage estimates go wrong.
| Token type | What it is | Typical rate vs input |
|---|---|---|
| Input (prompt) | Everything you send: system prompt, conversation history, tool definitions, retrieved documents | 1x, the baseline |
| Output (completion) | Text the model generates | 4x to 8x |
| Cache write | First call that stores a prompt prefix in the provider's cache | 1.25x to 2x |
| Cache read | A later call that reuses that stored prefix | 0.1x, sometimes lower |
| Reasoning | Internal tokens a reasoning model spends before it answers | Billed at the output rate |
Two of these catch people out. Cache reads are cheap enough (a tenth of the input rate on Anthropic, OpenAI, and Gemini alike) that a long, stable system prompt costs almost nothing from the second call onward. Reasoning tokens go the other way: they bill at the output rate, they can run into the thousands on a hard question, and nothing in your code asked for them.
Tool definitions count as input on every single call. An agent with twelve tools pays for all twelve JSON schemas each turn, whether it calls one or none.
Current LLM API pricing (September 2026)
Standard-tier text rates in US dollars per million tokens. Cache read is the discounted rate for reusing a cached prefix.
| Model | Input | Cache read | Output |
|---|---|---|---|
| Claude Fable 5.1 | $10.00 | $0.25 | $50.00 |
| Claude Opus 5 | $5.00 | $0.50 | $25.00 |
| Claude Sonnet 5 | $2.00 | $0.20 | $10.00 |
| Claude Haiku 4.5 | $1.00 | $0.10 | $5.00 |
| GPT-5.6 Sol | $4.00 | $0.40 | $20.00 |
| GPT-5.6 Terra | $2.00 | $0.20 | $12.00 |
| GPT-5.6 Luna | $0.20 | $0.02 | $1.20 |
| GPT-5 | $1.25 | $0.125 | $10.00 |
| GPT-5 mini | $0.25 | $0.025 | $2.00 |
| GPT-5 nano | $0.05 | $0.005 | $0.40 |
| Gemini 3.1 Pro Preview (under 200k) | $2.00 | $0.20 | $12.00 |
| Gemini 3.8 Flash | $0.75 | $0.075 | $3.75 |
| Gemini 3.5 Flash-Lite | $0.30 | $0.03 | $2.50 |
Claude Fable 5.1 is the exception to the 10% cache-read rule above: its cached reads are billed at a flat $0.25 per million, 2.5% of its input rate.
Sources: Anthropic pricing, OpenAI pricing, Gemini API pricing. Rates move. Check the source before you build a forecast on any of these numbers.
The table is only the base rate. What moves it:
- Batch tiers cut both rates roughly in half. Anthropic's Batch API is 50% off input and output; OpenAI's Batch and Flex tiers are comparable. Worth it for anything that tolerates async turnaround.
- Long-context rates apply to the whole call. OpenAI roughly doubles input above 272k tokens on several models, and Gemini Pro steps up past 200k. Crossing the threshold reprices the entire request, not just the tokens past the line.
- Promotional rates expire. Gemini 3.x Flash sits at a promotional $0.75 input that doubles on January 1, 2027, and GPT-5.6 Sol's rate is committed only through November 21, 2026.
Why your AI API bill doesn't match your estimate
You multiplied an average prompt by an average answer and got a number. The invoice came in higher. The gap is almost always one of these:
History grows. In a multi-turn conversation you resend the whole transcript every turn. Turn 10 pays for turns 1 through 9 again. Input cost grows quadratically in turn count unless you truncate or cache.
Agents make more calls than you counted. One user request to an agent is not one API call. It is a planning call, a tool call, a call to interpret the tool result, then a subagent with its own loop. A single run can be forty calls.
Retries are invisible. A call that returned a malformed tool argument still billed you for its output tokens. So did the retry that fixed it.
Reasoning tokens are not in your prompt. You cannot estimate them from your own text, because the model decides how many to spend.
Cache misses where you expected hits. Change one character near the top of a system prompt and the whole prefix becomes a cache write instead of a read, on every call, at up to 2x input.
Nothing is per-feature. The provider dashboard gives you one number per API key per day. When three features and two internal batch jobs share a key, you cannot tell which one moved.
The first five are properties of your traffic, and they show up in per-call token counts. The last one is a measurement problem, and it is the one to fix first, because you cannot act on any of the others until you can see them separately.
What to track for AI spend management
A provider invoice tells you what happened. It does not tell you where. AI spend management means recording cost at the same granularity you make product decisions at.
Record these on every model call:
- Model and provider. Not just the family. gpt-5-mini and gpt-5 differ 5x on input.
- Token counts by class. Input, output, cache read, cache write, and reasoning as separate numbers. Collapsing them into one "total tokens" destroys the information you need, because the classes carry different rates.
- Dollar cost per call, resolved at the rate in force when the call happened.
- What the call was for. Feature, endpoint, agent step.
- Who it was for. User, tenant, plan tier.
- Whether it succeeded. Spend on failed calls is waste, and it deserves its own line.
Cost per request, per user, per feature, per agent run
Those fields roll up into the views that actually drive a decision.
| Rollup | Question it answers | Decision it drives |
|---|---|---|
| Per request | What does one call cost? | Model choice, prompt size |
| Per agent run | What does one end-to-end task cost? | Whether the feature is viable at your price |
| Per session | What does a whole conversation or job cost? | Pricing for multi-turn products |
| Per user or tenant | Which customers cost more than they pay? | Pricing, rate limits, plan design |
| Per feature | Which surface is eating the budget? | Roadmap and what to optimize next |
Per agent run is the rollup teams skip and then regret. A $0.01 call is unremarkable. An agent that makes sixty of them per task costs $0.60 per task, and if you charge $0.05 per task you have a problem that no per-call metric will ever surface.
Getting per-run numbers requires grouping calls into runs, which is exactly what tracing does: one trace per run, one LLM span per call, cost summing up the tree. Laminar records token counts and dollar cost on every LLM span and rolls both up, so a run that fans out across tools, subagents, and two providers resolves to a single number (LLM cost tracking).
How to attribute AI token cost to a customer or feature
The cost data already exists on every call. What is missing is the dimension you want to group by: customer, feature, environment, experiment. Provider dashboards cannot supply it, because they never saw those concepts. You attach them yourself, at the point in your code where you know them.
The pattern is the same in any stack. Set the labels once at the top of a request, let every model call underneath inherit them, and grouping becomes a query instead of an export. In Laminar you decorate the entry point and set them on the trace:
from lmnr import Laminar, observe

@observe(name="support-agent")
def handle_turn(conversation_id: str, user_id: str, message: str):
    Laminar.set_trace_session_id(conversation_id)
    Laminar.set_trace_user_id(user_id)
    Laminar.set_trace_metadata({
        "environment": "production",
        "customer": "acme",
        "feature": "inbox-triage",
    })
    # every LLM call inside this trace now carries those dimensions
    return run_agent(message)
@observe takes session_id and user_id as arguments too, which is shorter when the values are constants. Set them inside the function when they arrive per request: decorator arguments are evaluated once, at import.
TypeScript passes all three as observe options, because there the call happens per request:
import { observe } from '@lmnr-ai/lmnr';

await observe(
  {
    name: 'support-agent',
    sessionId: conversationId,
    userId: userId,
    metadata: { environment: 'production', customer: 'acme', feature: 'inbox-triage' },
  },
  async () => await runAgent(message),
);
Per-customer cost then reads straight off the traces table:
SELECT
    simpleJSONExtractString(metadata, 'customer') AS customer,
    round(sum(total_cost), 2) AS cost
FROM traces
WHERE start_time > now() - INTERVAL 30 DAY
GROUP BY customer
ORDER BY cost DESC
Charting the same data as a p90 rather than a sum, grouped by provider, shows which provider produces your expensive tail rather than your average:
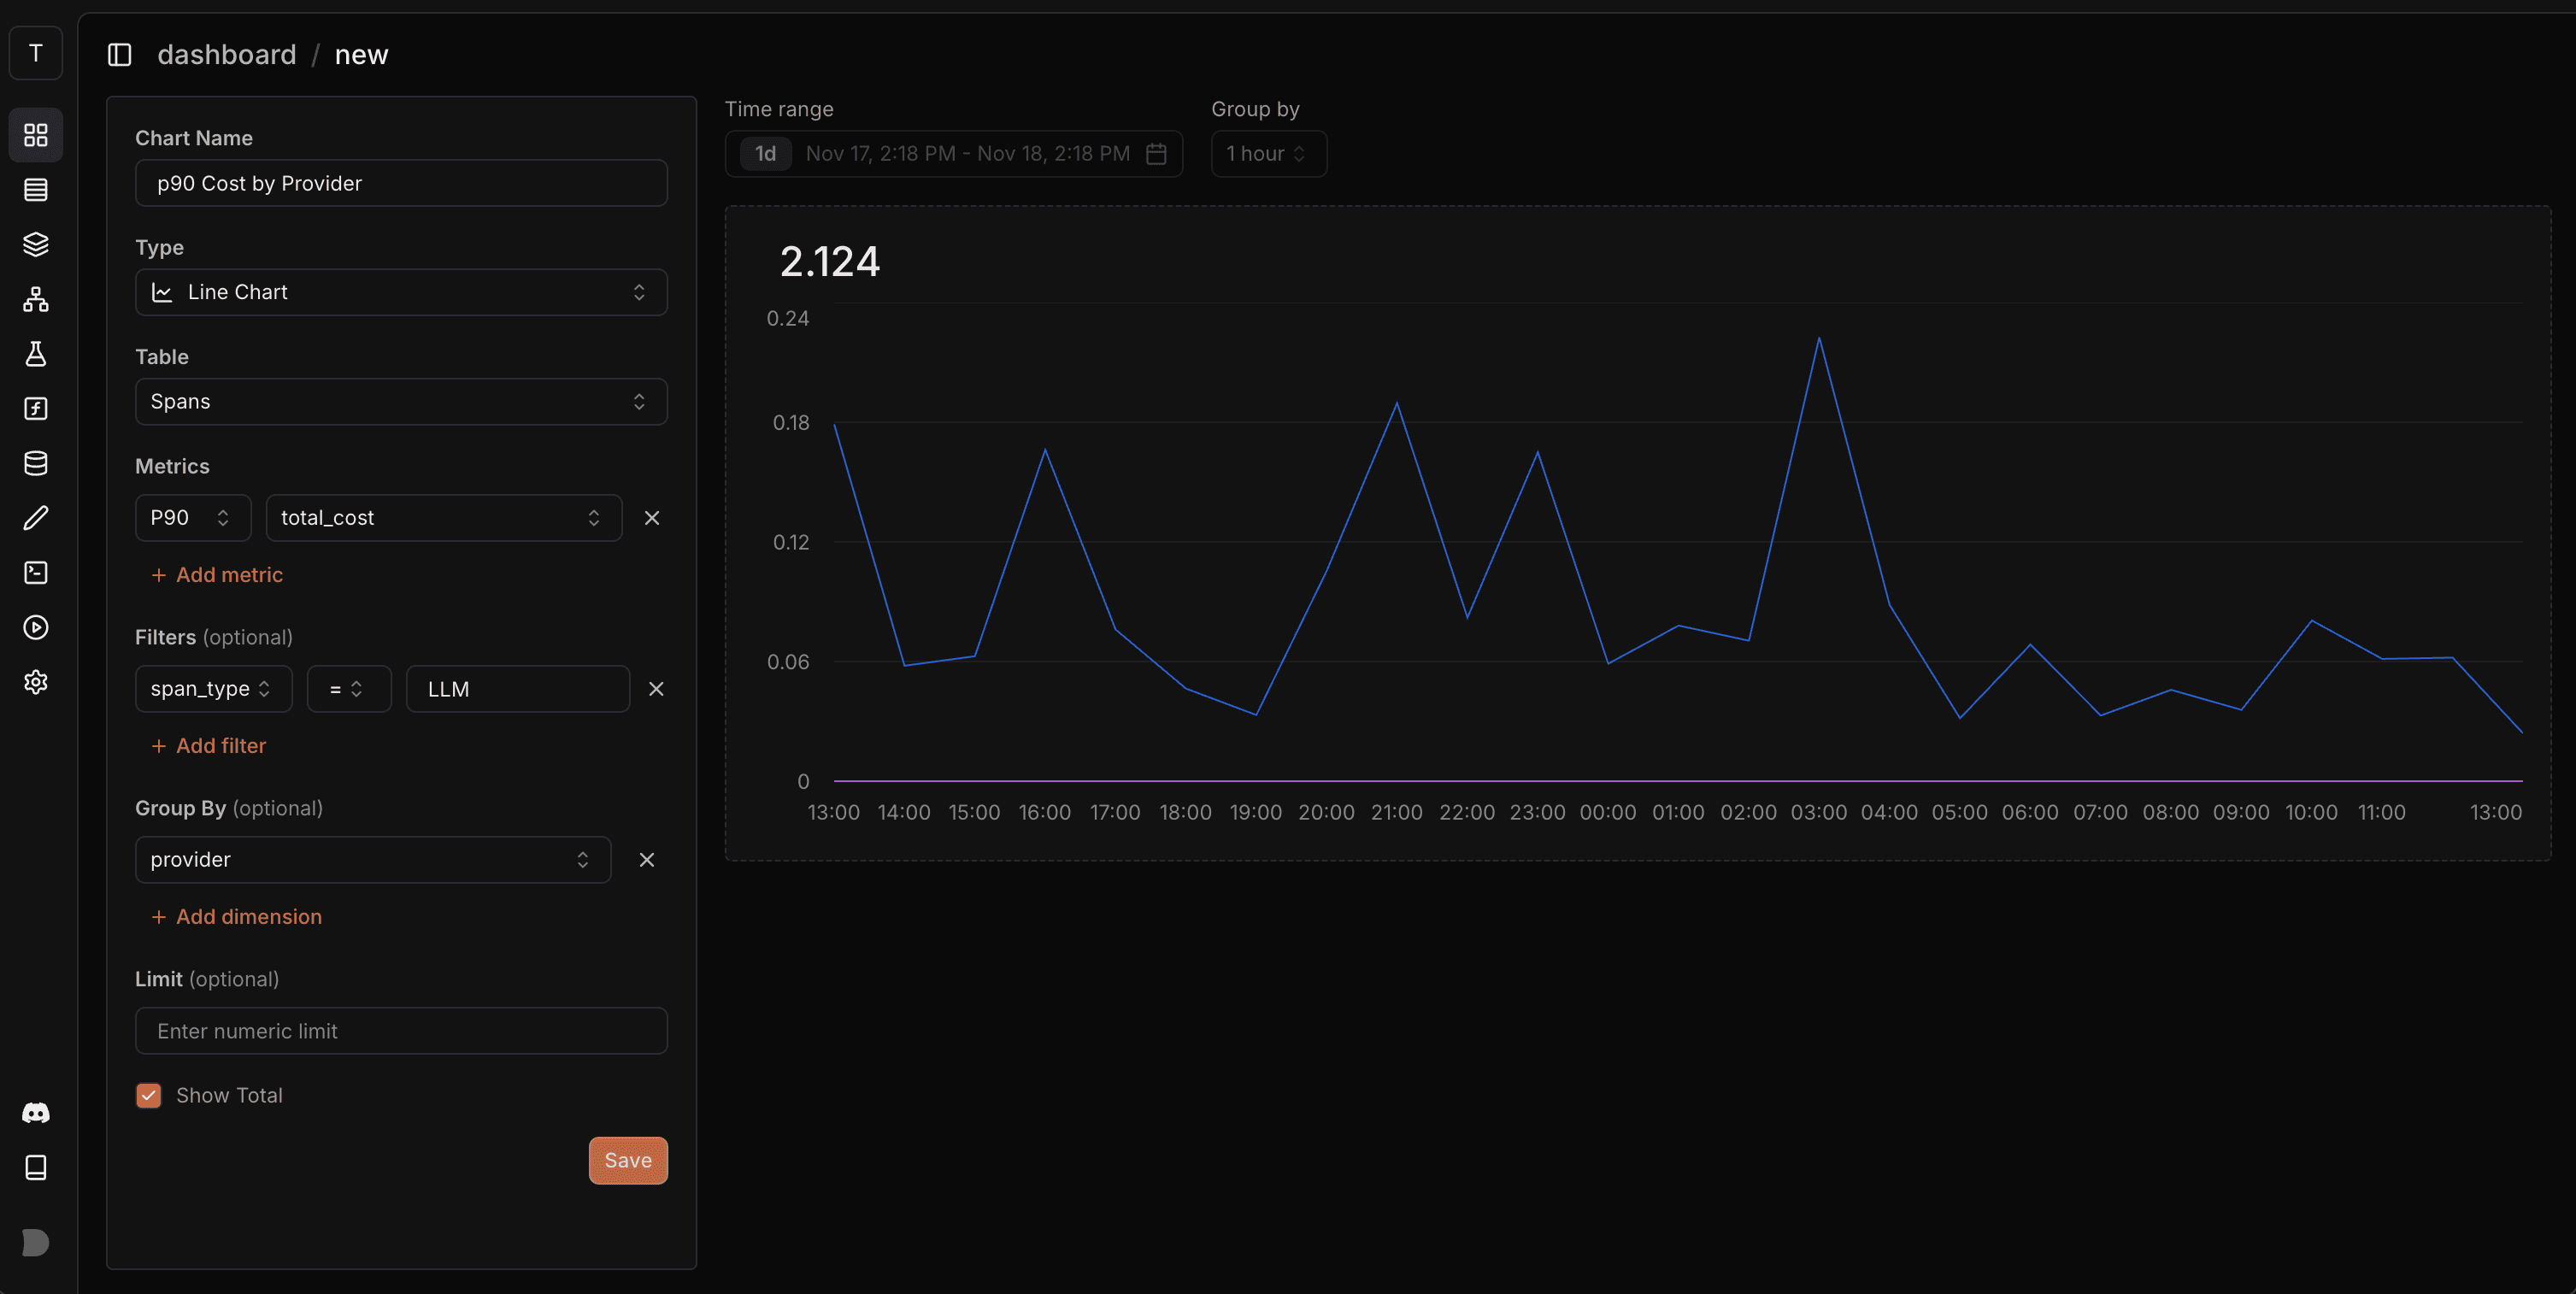
p90 rather than average: the tail is where per-run cost surprises live. Group by model instead and the same chart tells you which model to route away from.
Cost per session: what a whole conversation costs
One trace is one turn. A support conversation is twenty of them, and the number anyone asks about is the conversation. Agents are the same shape: a task re-invoked four times is four traces and one job.
A session is the layer above the trace. Reuse one session id across every turn of the same conversation, let each turn keep its own trace, and cost rolls up twice: calls into the trace, traces into the session. Setting the id is the whole integration, and it is the session id from the example above with the same value every turn.
In Laminar the Sessions tab on the Traces page is one row per session, with duration, total cost, total tokens, trace count, and user id, so sorting by cost surfaces the expensive conversations before anyone opens a ticket. Open a row and each turn is a numbered card (1/5, 2/5) carrying its input and final output, under a header with the session's totals. A conversation that cost twelve times the median is usually one turn that retried, or a history window that grew until every later turn re-sent it.
Sessions covers the setup in both SDKs: for a chatbot the session is the conversation and the trace is one turn, for a workflow the session is the job and the trace is one step.
Where LLM spend gets wasted: 5 common causes
Cost tracking tells you what you spent. Finding what you wasted takes a second pass.
1. Oversized context. Retrieved documents nobody read, a 40-turn history where 6 turns would do, few-shot examples left over from a prototype, tool definitions for tools this endpoint never calls. All of it bills as input on every turn.
2. The wrong model for the step. Classification, routing, extraction, and summarization rarely need a frontier model. A run that uses one model for every step is usually paying Opus rates for Haiku work.
3. Retry loops. The agent calls a tool, the tool errors, the agent tries again with the error in context, which makes the next prompt larger and the next retry more expensive. Three rounds of that can cost more than the successful path.
4. Unstable cache prefixes. A timestamp, a request ID, or a randomly ordered tool list near the top of the prompt invalidates the prefix every call. You pay cache-write rates forever and never collect the 0.1x read.
5. Runs that fail after spending. An agent that burns forty calls and then throws on the last one billed you for all forty. This is the cleanest waste in the list, and the easiest to quantify.
Two queries find most of it. What each model actually costs you:
SELECT model,
       round(sum(total_cost), 2) AS cost,
       count(*) AS calls,
       round(avg(input_tokens)) AS avg_input
FROM spans
WHERE span_type = 'LLM' AND start_time > now() - INTERVAL 7 DAY
GROUP BY model
ORDER BY cost DESC
And what you paid for runs that failed anyway:
SELECT round(sum(total_cost), 2) AS wasted, count(*) AS failed_runs
FROM traces
WHERE status = 'error' AND start_time > now() - INTERVAL 7 DAY
Patterns that queries cannot express, like a tool retried until the agent gave up, are the ones worth describing in plain language and matching across history: that is what Signals do, with an alert that fires when the pattern reappears.
LLM cost optimization: caching, routing, and prompt trimming
In rough order of how much they save per hour of work.
Prompt caching. The largest single lever on any agent with a stable prefix. A cache read costs 10% of input, so a 20,000-token system prompt that used to cost $0.04 per call on Claude Sonnet 5 costs $0.004 on every hit. The write costs 1.25x, which means the 5-minute cache pays for itself after one read. To make it work, put everything stable at the top (system prompt, tool definitions, retrieved documents that do not change within a session) and everything volatile at the bottom. Anything that moves near the top defeats the whole thing.
Model routing. Send each step to the cheapest model that passes on that step. A classifier on GPT-5 nano at $0.05 per million input is 25x cheaper than GPT-5, and a router that escalates only on low confidence keeps quality where it matters. The discipline is evaluating each step separately instead of picking one model for the whole pipeline.
Prompt trimming. Read your rendered prompt, not your template. Count what is in it. Drop few-shot examples the model no longer needs, cut retrieved chunks from ten to three and measure whether anything changed, bound conversation history to a window, and give each endpoint only the tools it can actually use.
Output control. Output is the expensive side. Set max_tokens to something you would actually accept, ask for structured output instead of prose, and turn reasoning effort down on steps that do not need it. On reasoning models this is often the single biggest line item.
Batch what can wait. Evaluations, backfills, nightly summarization, and offline enrichment do not need an interactive response. The batch tier halves both rates.
Order the work by measured spend, not by intuition. Cost per model and per step comes off the tracing data above; when a change lands, the same numbers tell you whether it held. Running an evaluation against the traffic a change touches is how you confirm the cheaper model did not quietly get worse.
Tools for tracking AI token cost
Three kinds of tooling, and most teams end up with two of them.
Provider dashboards are free and authoritative on the invoice. They are scoped to one provider and one API key, with no notion of your users or features, so they answer "how much" and never "which".
Gateways and proxies sit in the request path, so they see every call regardless of SDK and can enforce hard limits. The tradeoff is that they become a dependency of your production traffic.
Tracing and observability backends read the calls your app already makes, attach cost to the run that caused it, and let you group by user, feature, or customer. They cannot block a request, because they are not in the path.
Laminar is in that third category. Customer, feature, and environment attach as metadata you group by later, the cost data is queryable in SQL rather than locked to a dashboard, and it is Apache 2.0 and self-hostable if prompts cannot leave your network.
For a comparison of the observability options, including which ones are open source and which self-host, see Top 6 Agent Observability Platforms (2026): A Developer's Ranking.
FAQ
Claude API pricing: how much does the Claude API cost?
Claude API cost is per million tokens, split by model and token class. As of September 2026: Claude Fable 5.1 is $10 input and $50 output, Claude Opus 5 is $5 and $25, Claude Sonnet 5 is $2 and $10, Claude Haiku 4.5 is $1 and $5. Cache reads cost 10% of the input rate, cache writes 1.25x for the 5-minute tier and 2x for the 1-hour tier, and the Batch API halves input and output. See Anthropic's pricing page for the current table.
How do you calculate AI token cost at scale?
By hand it is arithmetic: tokens in each class times that class's rate, with the counts taken from the provider's response rather than from your own text. That holds for one call and stops holding when one user request becomes forty calls across two providers, each with its own cache hit rate.
At scale the SDK does it. Laminar's Python and TypeScript SDKs auto-instrument the provider clients, so every call carries model, provider, and token counts by class before you write any code, and the session_id, user_id, and metadata you set come along with it. Per-request, per-user, per-feature, and per-run cost become SQL over your own traces rather than arithmetic you maintain. Custom model costs handle private or fine-tuned models.
Does prompt caching reduce API costs?
Yes, substantially. A cache read costs about 10% of the standard input rate on Anthropic, OpenAI, and Gemini. The first call that stores the prefix costs more than a normal input call (1.25x on Anthropic's 5-minute tier, 2x on the 1-hour tier), so caching pays off after a single read on the short tier. Google also bills cache storage per hour, separately from reads. The failure mode is silent: change one character near the top of a prompt and every call pays the write rate instead, with no error to catch it. Laminar records cache_read_input_tokens and cache_creation_input_tokens as separate fields on every LLM span, prices each at the provider's cache rate, and subtracts both from the total input count so the remainder bills at the regular rate. A cache that quietly stopped working becomes a query rather than a surprise on the invoice.
How much does an AI agent cost to run?
More than the sum of its prompts, and the gap is usually an order of magnitude. One task is rarely one API call: a planning call, a tool call, a call to interpret the result, then a subagent with its own loop. Forty calls in a run is ordinary, so the per-call number you were reasoning about is not the number you are billed for.
Laminar captures the agent's spend because the grouping already exists: one run is one trace, every call in it a span, cost summing up the tree. Tools, retries, subagents, and a second provider all land on one row, so cost per run is sum(total_cost) over traces and your expensive tail is the p90 of the same column. When a task spans several runs, reuse a session id and the figure rolls up to the session.
How do I track AI token cost per user?
Set user_id on the trace and group by it (Laminar.set_trace_user_id in Python, the userId observe option in TypeScript). Set it once at the entry point and every LLM span inside the trace inherits it. Cost per user is then a GROUP BY rather than a log-parsing exercise, and attaching feature, environment, and customer as metadata gives you the same breakdown along those. See User ID for where to set it, LLM cost tracking for the attributes involved, and custom model costs if you run a private or fine-tuned model that needs its own rate.
Last updated: September 2026. LLM pricing changes frequently. Verify rates against each provider's pricing page before building a forecast.