
An agent's token spend can be spread across several calls. A single run can call three models from two providers, read a cached prompt prefix at a discounted rate, pay for reasoning tokens that never reach the user, and spawn a subagent that does all of that again. The provider invoice arrives a month later as a total per API key, and nothing in it says which agent, which customer, or which step spent the money.
Cost tracking tools help explain that spend at different levels. A gateway sees every request as it passes through and can stop one. A tracing platform sees every request in the context of the run that made it. A billing or FinOps tool sees the invoice and reconciles it against the rest of your cloud bill. The right layer depends on whether you need to control requests, understand runs, or reconcile invoices.
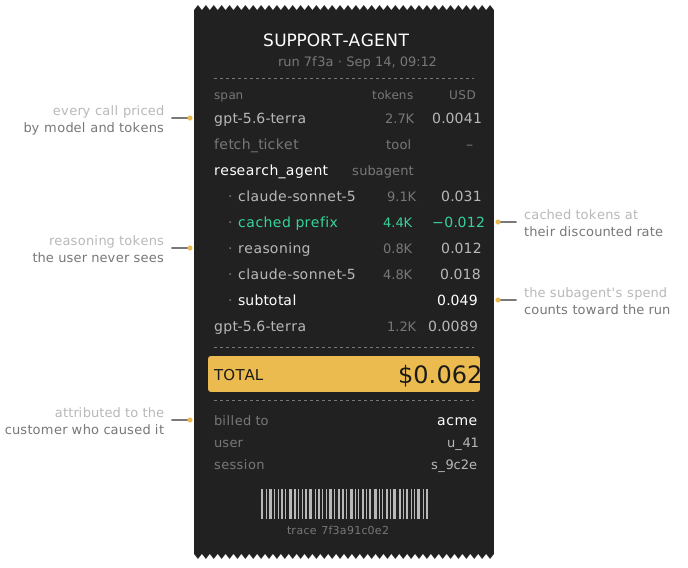
This roundup compares ten tools across the three layers on the criteria that matter once an agent is in production: attribution per agent run, pricing of cached and reasoning tokens, custom prices for models the vendor does not know, cost breakdowns by customer, and alerting. We use Laminar as the main example of the tracing layer, including its limits.
Per-run attribution is the deciding criterion
For per-run attribution, a tool needs to show what an individual agent run cost, which user it served, and how that cost breaks down by step.
That requires three things to be true at once. Every LLM call has to be recorded with its model, its provider, and its full token breakdown, including cached input and reasoning tokens where the provider reports them. Each call has to be attached to the run that made it, so a subagent's calls count toward the parent. And the run has to carry the dimensions you bill or budget by: user, session, customer, feature, environment.
Gateways get the first requirement for free, because every request passes through them. They struggle with the second, because a gateway sees requests, not runs; it only knows two requests belong together if you tag them. Billing tools get neither, because the provider aggregates before they see anything. Tracing platforms capture both when the instrumentation is set up correctly.
Gateway layer: LiteLLM, Portkey, Helicone, OpenRouter
Gateway tools sit between your code and the model provider. Every request is routed through them, so they can count tokens, apply prices, enforce budgets, and cache responses without any instrumentation in your agent. Grouping those requests into agent runs requires additional context.
LiteLLM
LiteLLM is an open-source proxy and Python SDK that normalizes requests across providers behind an OpenAI-compatible interface. Its proxy records spend per virtual key, per user, and per team, applies a built-in price map, and supports budgets that reject requests once a key has spent its limit.
What it does not do on its own is relate requests to each other. A run that makes six calls shows up as six rows. You can add metadata to each request and group on it later, but a proxy cannot infer which calls came from subagents or retries. LiteLLM also emits traces to observability backends, which is the usual way to get the per-run view on top of it; see the LiteLLM integration for the Laminar side of that pairing.
Portkey
Portkey is a commercial AI gateway with an open-source core. It offers the same routing and virtual-key model as LiteLLM plus budget limits, rate limits, and a dashboard of cost by key, model, and metadata.
Portkey's cost view is request-level with metadata grouping. A trace_id you pass on each request gets you closer to a per-run number, but the structure within the run is flat.
Helicone
Helicone is an open-source proxy with a hosted version that logs every request and response, computes cost from its price table, and offers caching and rate limiting. Its dashboard groups cost by model, user, and custom properties attached as request headers. Sessions can be stitched together with a session header on each request.
Like the other gateways, Helicone's cost is accurate per request and only as structured per run as the headers you set.
OpenRouter
OpenRouter is a model marketplace rather than a self-run gateway. You pay OpenRouter, it routes to the provider, and its activity page shows spend per API key and per model. Its pricing is public per model and includes cache discounts where the upstream provider offers them.
OpenRouter helps you see which models an API key is spending on, but its billing view does not include the structure of an agent run. Tracing platforms that recognize the openrouter provider can price its spans from the marketplace rates; the OpenRouter integration covers that for Laminar.
When a gateway is the right layer. Use a gateway to cap spend, set budgets for teams sharing provider keys, or manage provider routing in one place. Gateways are the only layer that can refuse a request. If you also need to know what a run cost and why, pair the gateway with a tracing tool.
Tracing layer: Laminar, Langfuse, LangSmith, Datadog
Tracing tools instrument your agent's code, record each LLM call as a span with its token counts, and nest spans into traces that represent runs. Cost is computed per span and rolled up. This is the layer where attribution per agent run is native rather than reconstructed.
Laminar
Laminar is an open-source, OpenTelemetry-native observability platform for AI agents. Cost tracking is on by default for every auto-instrumented provider and framework: initialize the SDK once and every LLM span carries input, output, cache-read, cache-write, and reasoning token counts, each priced at its own rate. Costs roll up from the span to the trace, so a run that fans out across tools, subagents, and providers resolves to one number, and the same total appears at the session level above it.
Three design choices matter for attribution. Prices are resolved on the server at ingestion from a built-in table that is kept current, so a new model is priced with the SDK version you already have. A project can define custom prices for fine-tuned or self-hosted models, entered in dollars per million tokens and matched exactly on model and provider. Cost attributes set by your own code take precedence, so a provider Laminar does not know can still be priced correctly.
The dimensions come from ordinary trace structure. A session id, a user id, and trace metadata set at the entry point are inherited by every span inside:
from lmnr import Laminar, observe

@observe(name="support-agent")
def handle_ticket(conversation_id: str, user_id: str):
    Laminar.set_trace_session_id(conversation_id)
    Laminar.set_trace_user_id(user_id)
    Laminar.set_trace_metadata({
        "environment": "production",
        "customer": "acme",
        "feature": "inbox-triage",
    })
    run_agent()
Token counts and costs are stored as columns in the spans and traces tables, so you can query spending per customer directly:
SELECT
    simpleJSONExtractString(metadata, 'customer') AS customer,
    round(sum(total_cost), 2) AS cost
FROM traces
WHERE start_time > now() - INTERVAL 30 DAY
GROUP BY customer
ORDER BY cost DESC
Dashboards ship with Total cost, Expensive traces, and Expensive spans presets, and any SQL aggregate can become a chart. For alerting, a Signal describes a condition in plain language, such as "the run cost more than a dollar and the task was not completed." An alert on that Signal posts to Slack or email when an event fires.
Laminar cannot cap spend because it does not proxy requests. It reports costs afterwards. If you need a hard budget, pair it with a gateway.
Langfuse
Langfuse is an open-source tracing platform with a mature cost model. Each generation records usage details by token type and cost details computed from model definitions you can extend. It infers usage from the response when the provider does not report it, and supports pricing tiers so a model with different rates above a context threshold is priced correctly. Cost is shown per trace and aggregated on dashboards by model, user, and tag.
Langfuse attributes cost per trace, with user and session grouping. Its detailed model definitions are useful when you run many fine-tuned variants, though they take some work to maintain. Teams that run Langfuse and want Laminar's transcript view or SQL access alongside it can send the same spans to both; the Langfuse integration documents that setup.
LangSmith
LangSmith is LangChain's hosted tracing and evaluation platform. Cost per run is computed from a model price map that includes the common providers and can be extended with custom entries. Runs nest, so a graph's cost includes its nodes' calls. Cost appears on each run and in monitoring charts by project.
LangSmith's cost tracking is strongest inside the LangChain ecosystem, where every LLM call is already a run. For code outside LangChain you instrument with its SDK. Its attribution is per run with metadata filters, and the price map handles the standard providers out of the box.
Datadog LLM Observability
Datadog's LLM Observability product adds traces of LLM calls to a general-purpose monitoring platform, with estimated cost per span from a built-in price list and rollups per trace. The appeal is having agent cost next to infrastructure cost and application traces in one tool, with Datadog's monitors available for threshold alerts.
The cost side is an estimate against Datadog's model list, with attribution per run through its trace structure. Datadog's own pricing scales with volume, which is worth modelling for high-traffic agents.
When the tracing layer is the right one. You need to know what a run cost, which step spent it, and which customer to attribute it to. Tracing cannot block a request, and it only sees calls your instrumentation sees.
Billing and FinOps layer: Finout, CloudZero, and the provider consoles
The third layer starts from the invoice. Provider consoles show spend per key and per model for their own service. FinOps platforms like Finout and CloudZero ingest those invoices alongside AWS, GCP, and Azure bills and allocate the total to teams and products using tags and rules.
These tools answer the finance team's question: how much did we pay for AI this month, and which cost center owns it? They reconcile to the dollar because they read the bill. They cannot attribute cost to an agent run because the provider has already aggregated it before they see it, and they lag by hours to days.
Use the billing layer as a check on the other two: if tracing and the invoice disagree, either some traffic is uninstrumented or a price in your table is stale.
Comparison: what each tool can attribute
| Tool | Layer | Per-run attribution | Cache / reasoning pricing | Custom model prices | Alerts | Can cap spend | Self-host |
|---|---|---|---|---|---|---|---|
| LiteLLM | Gateway | Per request, grouped by key/user/team | Per provider report | Yes | Budget limits | Yes | Yes |
| Portkey | Gateway | Per request, trace id if sent | Per provider report | Yes | Budget limits | Yes | Core only |
| Helicone | Gateway | Per request, session header | Per provider report | Limited | Threshold | Yes | Yes |
| OpenRouter | Marketplace | Per key and model | Upstream rates | No | No | Per-key limits | No |
| Laminar | Tracing | Span, trace, session, customer | Separate rates for each token type | Yes, per project | Signals to Slack/email | No | Yes |
| Langfuse | Tracing | Trace, user, session | Usage and cost details per type | Yes, model definitions | Via integrations | No | Yes |
| LangSmith | Tracing | Run tree, project | Per provider report | Yes, price map | Monitoring rules | No | Enterprise |
| Datadog LLM Obs | Tracing | Trace | Estimated | Limited | Monitors | No | No |
| Finout | FinOps | Cost center, team | Not visible | Not applicable | Budget alerts | No | No |
| CloudZero | FinOps | Cost center, team | Not visible | Not applicable | Budget alerts | No | No |
Vendor features move quickly; treat the table as a map of which layer to look in, not a substitute for current docs.
How to choose: start from the question you cannot answer today
"Which customer is costing us the most?" This is a tracing question. The answer has to come from a dimension attached to the run, and only instrumentation can attach it. Laminar, Langfuse, and LangSmith all do it; the difference is how you query the answer afterwards. Laminar exposes the full traces and spans tables to SQL, so the customer breakdown above is one statement.
"Why did this run cost a dollar?" Tracing again, and specifically a tool that prices cached and reasoning tokens separately. Reasoning models can put most of their spend into tokens the user never sees. A tool that shows one output number hides that.
"Stop this key at a hundred dollars a day." A gateway. Nothing in the tracing or billing layers can refuse a request.
"Reconcile AI spend with the rest of the cloud bill." FinOps. Let the finance tool own the invoice, and use the tracing tool to explain the parts of it that surprise anyone.
"Which model should we switch to?" Use tracing to compare model costs on the same workload alongside evaluation results, so you can assess both cost and quality.
FAQ
What are the best tools for tracking AI token costs?
It depends on whether you need budget limits, per-run attribution, or invoice reconciliation. For spend per API key and hard budgets, gateways like LiteLLM, Portkey, and Helicone measure every request and can refuse one. For cost per agent run, per customer, and per step, tracing platforms like Laminar, Langfuse, and LangSmith attach cost to the run that incurred it. For reconciling AI spend with the cloud bill, FinOps tools like Finout and CloudZero read the invoice. Most production teams end up with a gateway or provider console plus a tracing tool; the AI token cost guide covers how to set up the tracing side.
Which platforms show cost attribution per agent run?
Tracing platforms do, because they record each LLM call inside the run that made it. Laminar rolls cost from each LLM span up to the trace and the session, prices cached and reasoning tokens at their own rates, and exposes the result as columns you can query; see the cost tracking docs. Langfuse attributes cost per trace with user and session grouping, and LangSmith attributes it per run tree. Gateways attribute per request and can approximate per-run grouping only if you tag every request with a run id.
What is the best way to set up cost alerts for AI agents?
For a hard limit, set a budget on a gateway such as LiteLLM or Portkey so requests beyond it are refused. To flag waste that a cost threshold alone would miss, define the condition on the traces themselves. In Laminar, a Signal describes the pattern in plain language, such as a run that cost more than usual without completing the task, and an alert on that Signal notifies Slack, email, or the in-app center when an event fires. Cost thresholds can also flag long conversations that are working as expected.
Which AI agent observability tools track token cost?
Laminar, Langfuse, LangSmith, Arize Phoenix, Braintrust, and Datadog LLM Observability all record token usage on traced LLM calls and compute a cost from a price table. The differences are in whether cached and reasoning tokens are priced separately, whether you can add prices for your own models, and how you query the result. Laminar prices each token type at its own rate, supports per-project custom model costs, and makes the cost columns available in the SQL editor. For a broader comparison of the platforms themselves, see the agent observability platforms roundup.
Can an observability tool cap my AI spend?
No. Tracing tools observe requests after the fact and cannot stop one. To enforce a budget, route requests through a gateway with budget limits, or use the per-key limits your provider or marketplace offers. Use the tracing tool to explain what the gateway blocked and why the spend was heading there.
How do I track costs for a fine-tuned or self-hosted model?
Make sure the LLM span carries a model name, then give the tool a price for it. In Laminar, add an entry under Settings and Model costs with the exact model and provider strings your spans report, in dollars per million tokens. If you compute the cost yourself, set the cost attributes on the span and Laminar uses them directly without consulting any table. The cost tracking docs describe both paths and the provider identifiers to use.