
Langfuse is a good open-source LLM observability tool. It was built for single LLM calls and short prompt chains: prompt versioning, typed observations, an eval harness that plugs into notebook workflows. The industry has moved past single calls. Teams ship agents now, and an agent is a different shape of problem.
An agent now can run for hours, calls fifteen tools, spawns a sub-agents, and fails in a subtle, unexpected ways. You open the Langfuse trace and get a blank tree of spans and then spend hours sifting through tons of prompts and tool calls just to understand what the agent was doing. Understanding agents simply requires a new type of tooling.
This article ranks the top Langfuse alternatives for 2026, ordered by how well they handle agents rather than prompt-first logging. TLDR: the best Langfuse alternative in 2026 is Laminar, because Laminar was built for AI agents from the ground up.
Best Langfuse alternatives in 2026
| Tool / Platform | License / Source | Key Features & Architecture | Best Used For |
|---|---|---|---|
| Laminar | Open-source (Apache 2.0) | OpenTelemetry-native, built for AI agents, 20x trace compression, lowest pricing on market, Signals, Agent Debugger, raw SQL over platform data, code-first eval SDK. | Best Langfuse alternative if you are shipping agents and looking for an OSS solution |
| LangSmith | Closed source | LangChain-first architecture. | Best Langfuse alternative if you are locked into the LangGraph stack. |
| Arize Phoenix | Open-source (Elastic 2.0) | OpenTelemetry-native via OpenInference. | Best Langfuse alternative for notebook and eval-heavy research workflows. |
| Braintrust | Closed source | Eval-first workflow and testing architecture. | Best Langfuse alternative when your single bottleneck is evaluation regression testing. |
| Weights & Biases Weave | Closed source | Deep integration with W&B ecosystem. | Best Langfuse alternative for ML teams already living in W&B. |
| Helicone | Open-source | Proxy logging. | Best Langfuse alternative for quick request/response capture on raw LLM calls. |
| Traceloop / OpenLLMetry | Vendor-neutral | OpenTelemetry instrumentation. | Best Langfuse alternative when portability of instrumentation matters more than the backend. |
Why Laminar is the best Langfuse alternative
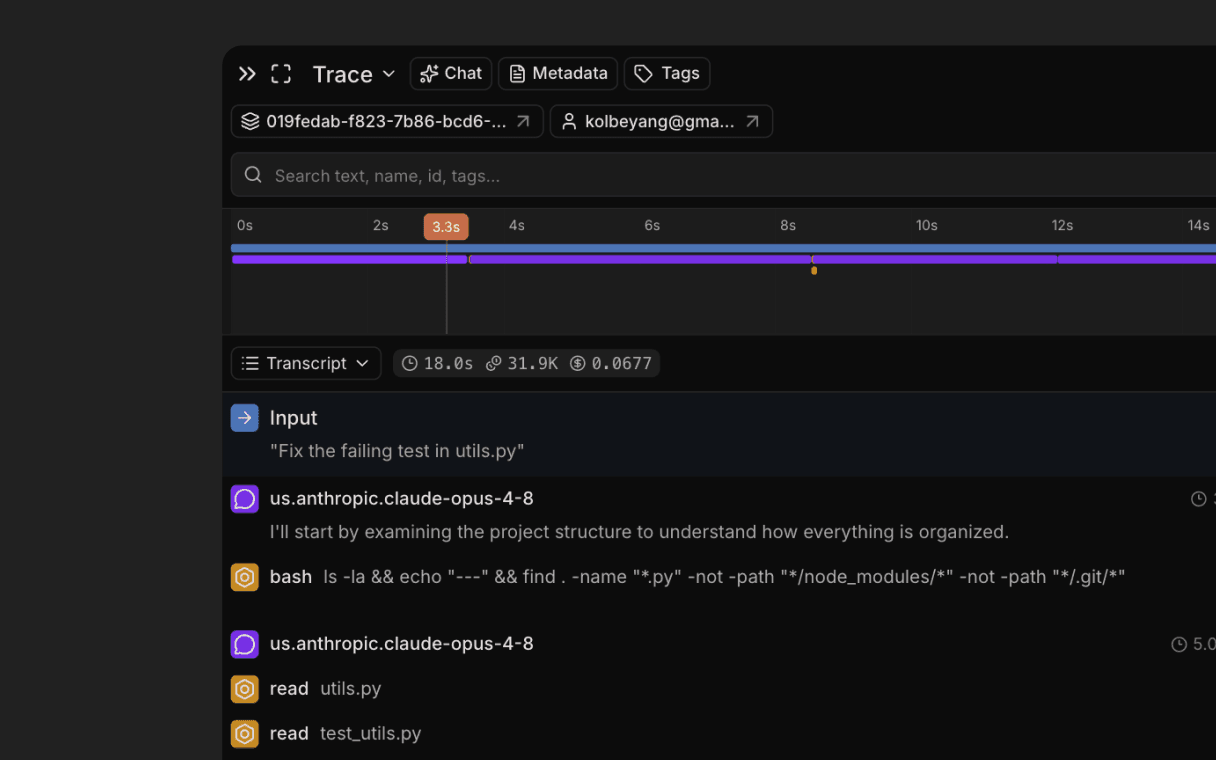
Laminar is an open-source, OpenTelemetry-native observability platform purpose-built for AI agents. Where Langfuse organizes around observations and prompts, Laminar organizes around the agent: how its traces are shaped and stored, how you read them, and how understand agent failure modes and you fix them.
Open-source and easy to self-host
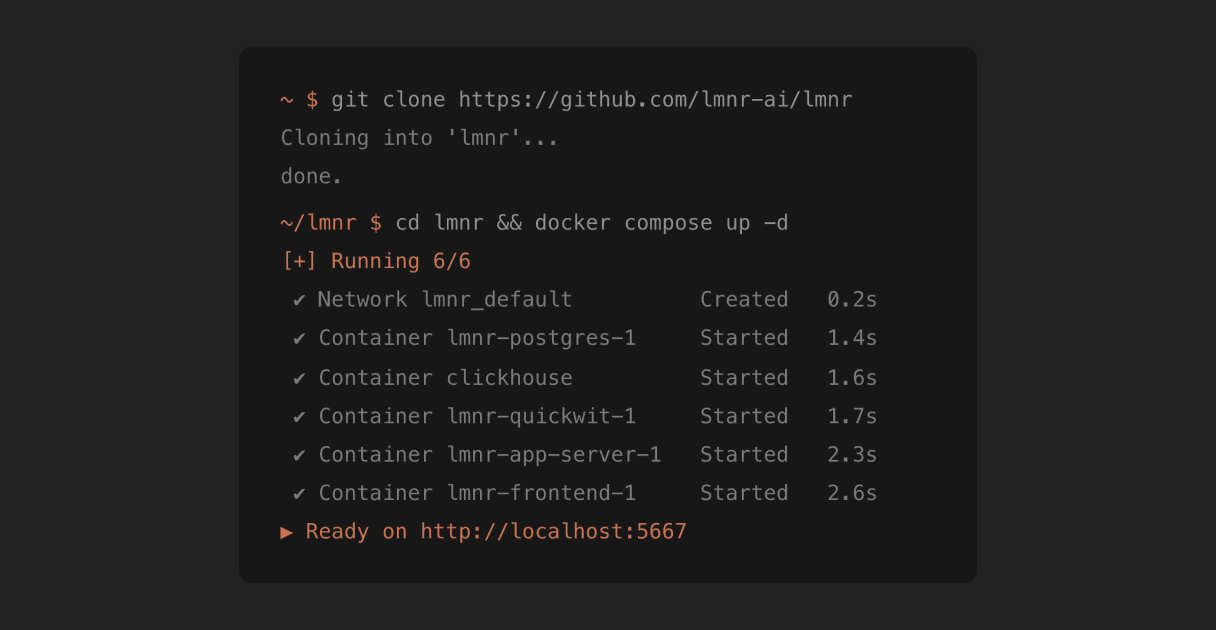
Laminar is Apache 2.0 and can be easily self-hosted with Docker compose with a single command or with a production-ready Helm chart for high scale applications.
20x trace compression and the best data pricing on the market
Agents re-send the whole conversation every turn, so Laminar stores each unique message once and reconstructs traces on read. This results in 20x less storage on average, and up to 50x on long runs. We go into details of trace compresssion in this blog post.
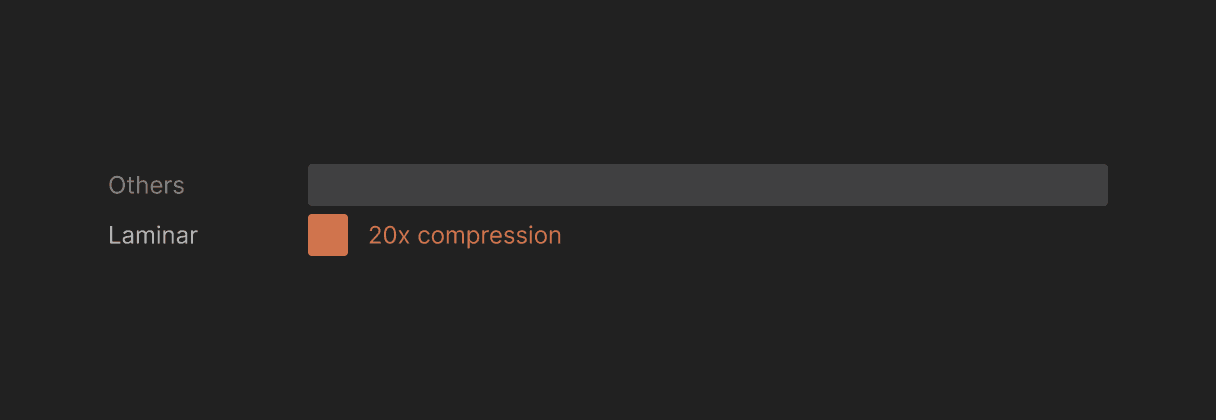
That's why our data pricing is the lowest on the market, twice over. You pay per GB of unique data, not for the copies your agent re-sends on every turn. And the per-GB rate itself is lower, because the storage layer costs us less to run.
Start on a generous free tier and scale without a surprise bill. See the pricing page.
Signals: track agent failures in plain language
A Signal is a prompt that runs against every trace. "Agent used tools inefficiently." "User asked for the same thing twice." "Tool failed and the agent made up the data instead." Laminar agent analyzes each and every trace and if it finds what you described, it produces a structured event: queryable via SQL, clustered with similar events from other runs. You can also connect Slack and recieve a realtime alert when certain event is detected.
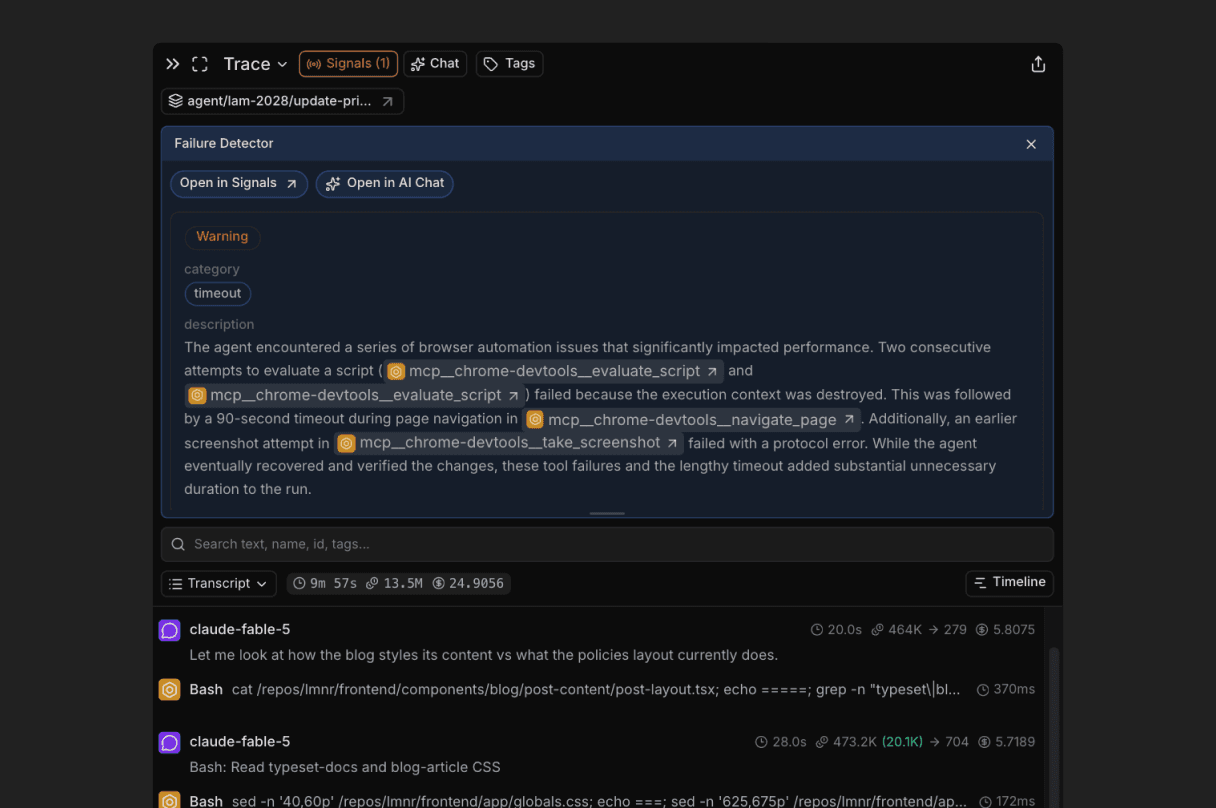
A Signal reads the whole trace, every LLM turn and tool call from first span to last, because most agent failures are only make sense in the context of the entire agent run. On Laminar Cloud, that agent runs on flow-1, our own model for understanding agent traces: it matches GPT-6-sol in failure detection quality at about 1/20th of the cost, so reading every trace end to end stays affordable.
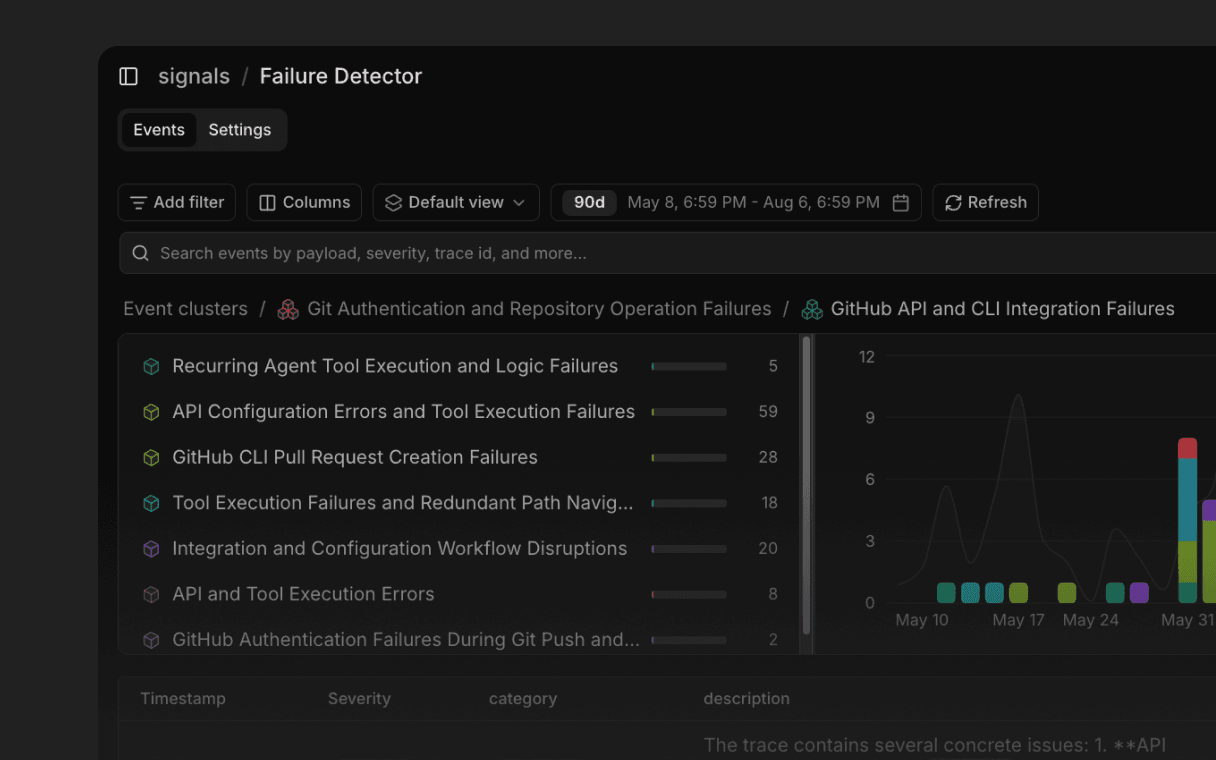
Then we go one step further. Laminar runs a proprietary online clustering algorithm over all extracted signal events, so instead of scrolling ten thousand individual events you see the ten behaviors your agent actually has. Clusters are a high-level map of your agent in production: what fails, how often, and which failures are the same failure.
Evals: a code-first, barebones SDK
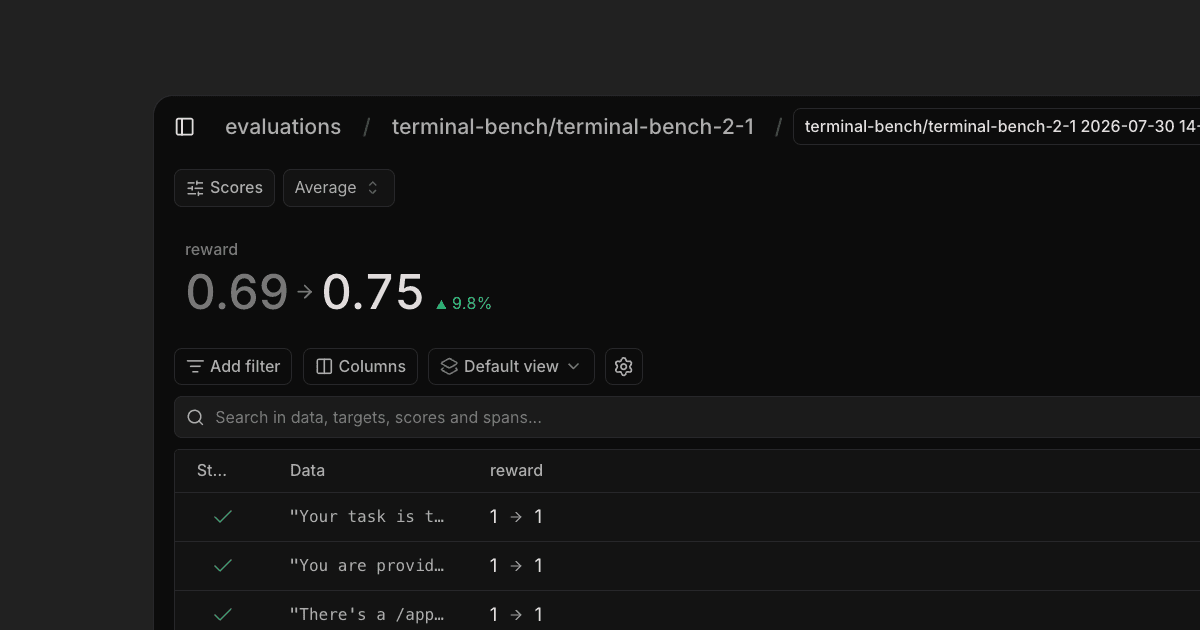
Laminar's evaluations follow a code-first philosophy: a small, unopinionated SDK that makes versatile evals easy to write, because agent behavior is too varied for a rigid eval form. You define datapoints, an executor function that produces an output, and one or more evaluator functions that score it. Laminar runs them in parallel, traces every call, and stores the scores so you can compare runs over time.
Your coding agent can use Laminar to improve your agent
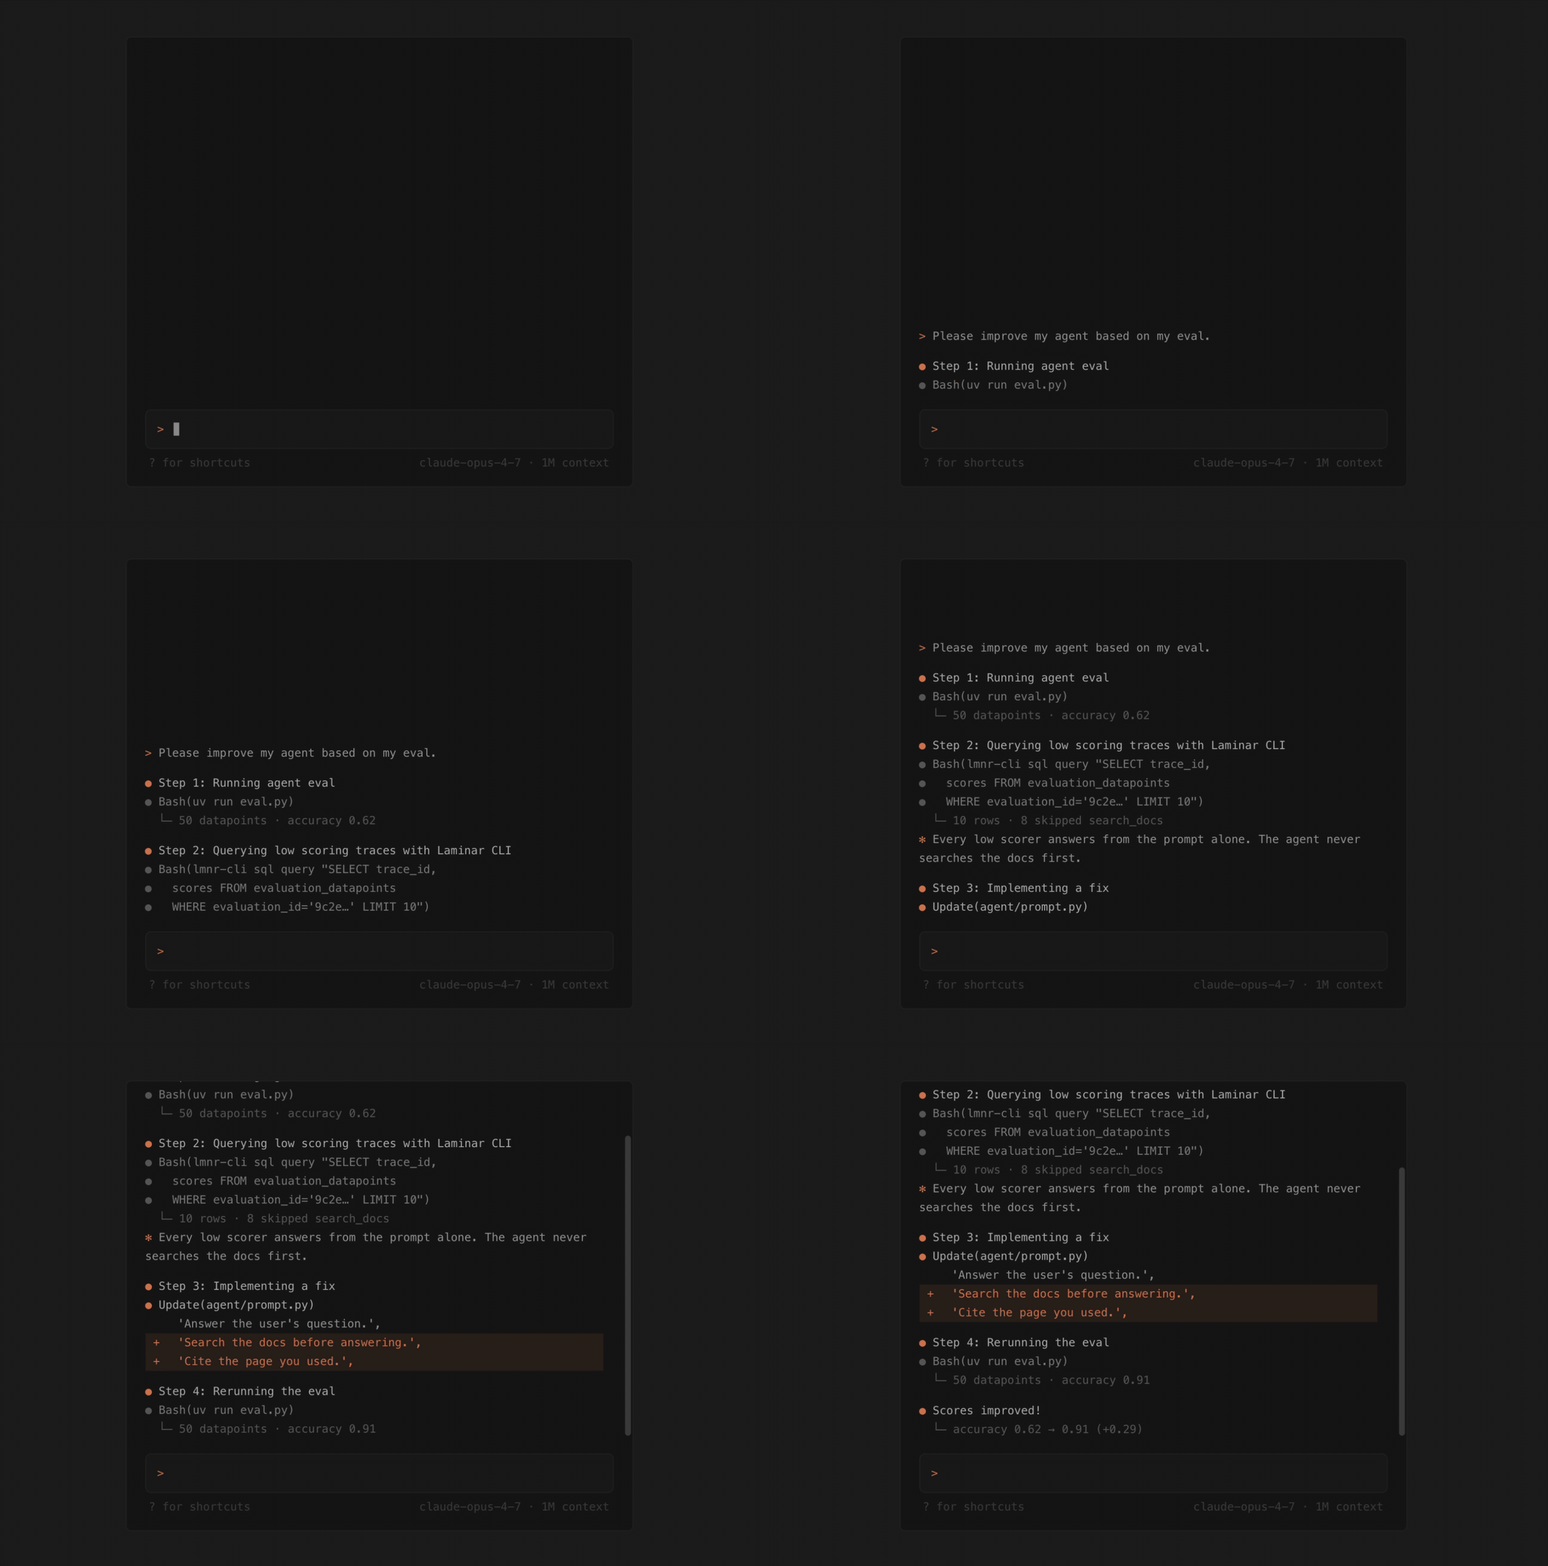
Building an agent is a loop: run it, read what it did, change something, run it again. Laminar is built so a coding agent can drive that loop, because all platform data, traces, spans, signal events, and eval scores, is exposed through raw SQL. Your coding agent queries it from the CLI (lmnr-cli sql query) or the MCP server, and you get the same SQL in the UI and API.
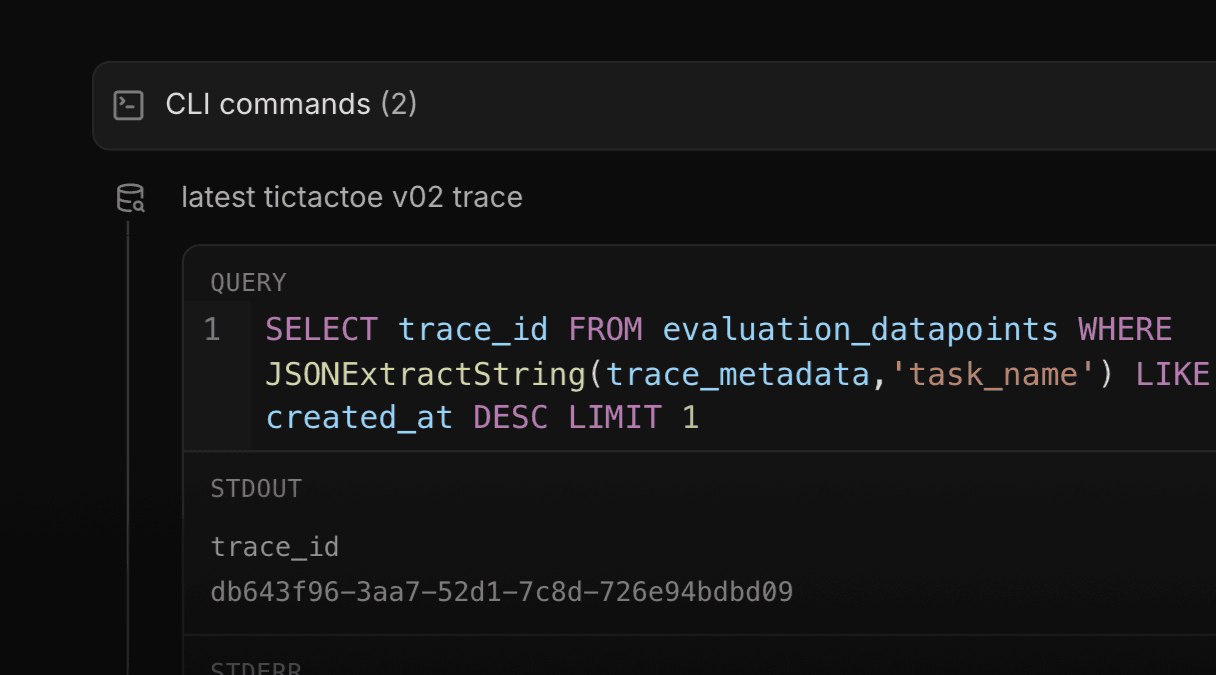
The loop it runs: query the worst failures, read the traces, fix the code, rerun, measure against the same eval. The debugger captures every trace, eval, CLI command, and note in one session, and replays cached responses on reruns so each iteration is cheap.
Where Laminar might not the right pick
- Your entire workflow is versioning and testing prompts on single LLM calls. Langfuse still fits that better.
- You have no tool use, no sub-agents, and no multi-step runs. A single-call logging tool is enough.
2. LangSmith
License: Closed source. Deployment: Cloud, hybrid, self-hosted (Enterprise only).
If your stack is LangChain or LangGraph, LangSmith fits like a glove. One environment variable and runs are traced. LangGraph Studio is the best agent IDE available for that stack: visualize the graph, set breakpoints, modify state mid-run, resume from a checkpoint.
Strengths:
- LangGraph Studio (a real agent IDE, not just a viewer).
- Managed deployment with checkpointing and memory.
- OpenTelemetry support added in 2026.
Weaknesses:
- Closed source. Self-hosting is Enterprise-only.
- Seat-based pricing ($39/seat/month on Plus) gets expensive with larger teams.
- Tightest fit is still LangChain. Teams on other frameworks get less.
Pricing: Developer free with 5k base traces/month. Plus $39/seat/month plus $0.50 per 1k base traces. Extended-retention traces cost $2.50 per 1k.
3. Arize Phoenix
License: Elastic License 2.0. Deployment: Self-host (pip install), Arize AX managed option.
Phoenix is the open-source side of Arize. It uses OpenInference, a widely adopted set of OTel semantic conventions for LLM spans.
Strengths:
- OpenTelemetry-native with OpenInference. Instrument once, send anywhere.
- Strong evaluation harness (Phoenix Evals).
- Notebook-friendly; runs in Colab or locally.
Weaknesses:
- Trace UX is span-tree-first. No transcript view.
- Less purpose-built for agents than Laminar.
- Commercial Arize AX has a different cost curve. Plan ahead if you need to graduate.
Pricing: Phoenix is free. Arize AX pricing is custom.
4. Braintrust
License: Closed source. Deployment: Cloud, on-prem for Enterprise.
Braintrust is eval-first. Tracing exists to feed the eval loop, not to stand alone.
Strengths:
- Mature scorers, comparisons, regression detection.
- Clean prompt playground tied to eval sets.
- Strong if your bottleneck is "did this change break behavior X."
Weaknesses:
- Not a debugger. You will not be faster at finding what broke in production.
- Lighter agent-specific UX.
- Closed source.
Pricing: Free tier available. Pro scales with usage. Enterprise custom.
5. Weights & Biases Weave
License: Closed source. Deployment: Cloud, on-prem for Enterprise.
Weave plugs tracing into the existing W&B console. If your ML team already lives there, it is the path of least friction.
Strengths:
- Native W&B integration.
- Strong eval framework with scorers and comparisons.
- Good for teams evaluating models and agents on the same platform.
Weaknesses:
- Trace UX borrowed from ML experiment tracking. Not agent-first.
- Weak on realtime trace viewing during long runs.
- Closed source.
Pricing: Free tier with limited storage. Paid plans scale with volume and seats.
6. Helicone
License: Apache 2.0. Deployment: Cloud, self-host.
Helicone is a proxy that sits in front of the LLM provider and logs every request. Simplest integration of any tool in this list: change a base URL.
Strengths:
- Zero-code proxy integration.
- Caching, rate-limit, and retry built into the proxy.
- Cheap to get started.
Weaknesses:
- Request/response focused, not span-based. Multi-step agents are stitched after the fact.
- No transcript view, no Signals, no debugger.
- Proxy model adds a hop to every LLM call.
Pricing: Free tier. Paid plans scale with request volume.
7. Traceloop / OpenLLMetry
License: Apache 2.0 (OpenLLMetry SDK). Deployment: Cloud backend, vendor-neutral SDK.
Traceloop's value is the OpenLLMetry SDK: vendor-neutral OpenTelemetry instrumentation for LLMs. Traceloop's own backend is one place the traces can go. Most backends in this list (Laminar, Langfuse, Phoenix, LangSmith) can also ingest OpenLLMetry spans, which makes it the safest instrumentation choice for teams that want portability.
Strengths:
- OTel-native. Works with any compatible backend.
- Active open-source community.
Weaknesses:
- The backend UX is less agent-specific than Laminar or LangSmith.
- Primary value is the SDK, not the product.
Head-to-head: where each Langfuse alternative wins
| Criterion | Winner | Why |
|---|---|---|
| Built for agents | Laminar | 20x trace compression, Signals, coding-agent debugger, raw SQL over all data. |
| Trace storage cost | Laminar | 20x average compression of agent traces, billed by data volume, not span count. |
| Pricing for agents | Laminar | Data-volume pricing with no per-span units and no seat fees. |
| LangGraph integration | LangSmith | LangGraph Studio is the best agent IDE for that stack. |
| Open-source self-host | Laminar | Apache 2.0, Helm chart, all features on the OSS image. Langfuse (MIT) is a close second. |
| OpenTelemetry support | Laminar / Phoenix | Both OTel-native from day one. |
| Evaluation harness | Laminar / Braintrust | Code-first eval SDK (Laminar) and purpose-built regression scorers (Braintrust). |
| Vendor-neutral instrumentation | OpenLLMetry / OpenInference | Instrument once, switch backends later. |
Pricing comparison for 2026
| Platform | Free tier | Paid entry | Enterprise / self-host |
|---|---|---|---|
| Laminar | 1GB, 7-day retention | $30/mo Hobby (3GB), $150/mo Pro (10GB, 6-month retention) | Custom, on-premise. Self-host free via Helm chart |
| Langfuse | 50k observations, 30-day retention | $29/mo Core, $199/mo Pro | $2,499/mo Enterprise, self-host all features |
| LangSmith | 5k base traces | $39/seat/mo + $0.50 per 1k traces | Enterprise self-host |
| Phoenix | Free open-source | Arize AX (custom) | Arize AX / self-host |
| Braintrust | Free tier | Pro scales with usage | Custom, on-prem |
| Weave | Limited storage | Scales with volume and seats | On-prem for Enterprise |
| Helicone | Free tier | Scales with requests | Self-host |
Laminar's data-volume pricing tracks compressed payload size, and 20x trace compression means each gigabyte holds far more agent traffic. Unit-based pricing (Langfuse) counts traces plus observations plus scores, so an agent run with 40 to 75 spans burns 8 to 15 units against a single call's one. Seat-based pricing (LangSmith) scales with team size independent of usage.
Open-source scorecard
Matters if you self-host, run in air-gapped environments, or want to own the trace data.
| Platform | License | Self-host | All features on self-host |
|---|---|---|---|
| Laminar | Apache 2.0 | Yes, Helm chart, one command | Yes |
| Langfuse | MIT | Yes | Yes |
| Phoenix | Elastic 2.0 | Yes | Yes |
| Helicone | Apache 2.0 | Yes | Yes |
| OpenLLMetry SDK | Apache 2.0 | N/A (SDK) | N/A |
| LangSmith | Closed | Enterprise only | N/A |
| Braintrust | Closed | Enterprise only | N/A |
| Weave | Closed | On-prem Enterprise | N/A |
How to pick a Langfuse alternative in 5 minutes
Answer these in order. Stop at the first yes.
- Are you building AI agents and want low-cost optimized trace storage, Signals, a coding-agent debugger, and SQL over all your data? → Laminar.
- Are you committed to LangChain or LangGraph and want an agent IDE? → LangSmith.
- Is your only pain regression testing, not debugging? → Braintrust.
- Do you live in notebooks or already use Arize? → Phoenix.
- Does your ML team live in W&B? → Weave.
- Do you just need cheap request/response logs for raw LLM calls? → Helicone.
- Do you want vendor-neutral instrumentation and will decide the backend later? → OpenLLMetry plus any of the above.
Migrating from Langfuse to Laminar
If you are on Langfuse and the friction above applies, the migration is straightforward:
- Switch the instrumentation. Laminar's Python and TypeScript SDKs follow the same auto-instrumentation pattern. If you are already on OpenLLMetry or OpenInference, point the OTLP endpoint at Laminar and traces flow in. See the Laminar quickstart.
- Map the data model. Langfuse observations map to OTel spans in Laminar. Sessions map to trace sessions. Scores map to Signals or explicit events.
- Run both side by side during the transition. Send traces to both backends until you trust the new pipeline.
- Move prompt management. Laminar is a debugger and observability platform, not a prompt registry. Keep prompts in Langfuse or your registry of choice during the transition.
Why we recommend Laminar
We built Laminar because the industry moved from single LLM calls to agents, and the prompt-first tools did not move with it. Compression came from understanding that agent traces repeat themselves. Signals came from understanding that nobody can read ten thousand agent traces by hand, and flow-1 from making it affordable for a model to read all of them. The debugger came from understanding that a coding agent should drive the fix-and-rerun loop. Raw SQL came from understanding that complex traces raise questions only a query can answer. Each one is a thing you get because the platform was built for agents.
If you are looking at alternatives to Langfuse because your agents broke the prompt-first model, that is the reason to try Laminar first. Start with the free tier: 1GB of traces, 7-day retention. Instrument one agent. If you do not see the difference in the first hour, come back and tell us why.
Try Laminar free · Read the docs · Star on GitHub
FAQ: Langfuse alternatives in 2026
What is the best Langfuse alternative in 2026?
Laminar is the best Langfuse alternative in 2026. It is open-source (Apache 2.0), OpenTelemetry-native, and built for AI agents, with 20x trace compression, the lowest data-volume pricing on the market, Signals for plain-language outcome tracking, a coding-agent debugger, and raw SQL over all platform data. LangSmith is the best alternative if you are committed to LangGraph; Braintrust is the best alternative for eval-first regression testing.
What is the best open-source Langfuse alternative?
Laminar is the best open-source Langfuse alternative. It is Apache 2.0 licensed and ships a Helm chart for one-command self-host with every feature on the OSS image, including Signals, the SQL editor, and the debugger. Phoenix (Elastic 2.0) and Helicone (Apache 2.0) are also open-source options.
Which Langfuse alternative is cheapest for agents?
Laminar is the cheapest Langfuse alternative for agents. It prices by data volume rather than per trace, observation, or seat, and compresses agent traces by 20x on average, so each gigabyte of quota holds far more agent traffic. Langfuse's unit-based pricing counts an agent run's 40 to 75 spans as 8 to 15 billing units, where Laminar counts only the compressed payload.
How does Laminar make agent traces cheaper to store?
Agents re-send the full conversation on every turn, so a trace repeats most of its content. Laminar hashes each message, stores every unique message once per trace, and reconstructs the full trace byte-for-byte at query time. This yields 20x storage reduction on average and up to 50x on the longest agent runs, which is why Laminar's data-volume pricing is the lowest for agent workloads.
Can I query my agent traces with SQL in Laminar?
Yes. Laminar exposes all platform data, traces, spans, signal events, and evaluations, through SQL. You can run queries from the SQL editor in the UI, the lmnr-cli sql query command, the MCP server (so a coding agent can query your data directly), or the SQL API. No warehouse export is needed.
Is Laminar a drop-in replacement for Langfuse?
Close, but not identical. Laminar ingests OpenTelemetry, so if you already use OpenLLMetry or OpenInference you can point the exporter at Laminar without re-instrumenting. Langfuse observations map cleanly to OTel spans. Prompt management is the one area where Laminar does not overlap with Langfuse; treat that workflow separately.
What is the difference between Langfuse and Laminar?
Langfuse is optimized for prompt versioning, evaluation, and structured observation logging on single LLM calls or short chains. Laminar is built for AI agents: 20x trace compression and data-volume pricing, Signals for outcome tracking across history, a coding-agent debugger with cached reruns, raw SQL over all platform data, and a code-first eval SDK. Full comparison: Laminar vs Langfuse.
What is agent observability?
Agent observability is the practice of capturing and debugging the full execution of an AI agent, including every LLM call, tool call, retrieval, and sub-agent invocation. It differs from classical LLM observability because agent runs are long, non-deterministic, and deeply nested. Agent-specific tooling renders the run as a transcript, tracks outcomes in plain language, and lets a coding agent rerun the agent from a cached point. See our ranked list of the top agent observability platforms for the full field.
How much does a Langfuse alternative cost?
Pricing varies by model. Laminar: data-volume pricing, free 1GB with 7-day retention, Hobby $30/month for 3GB, Pro $150/month for 10GB with 6-month retention. LangSmith: seats plus traces, $39/seat/month plus $0.50 per 1k base traces. Phoenix: free open-source, Arize AX custom. Braintrust: free tier plus usage-based Pro. Weave: scales with volume and seats. Helicone: free tier plus request-based plans. For agents with large traces, Laminar's data-volume pricing with 20x compression is the most predictable. Self-hosting Laminar is free.
Last updated: June 2026. Verify features and pricing against each vendor's current documentation before committing.