
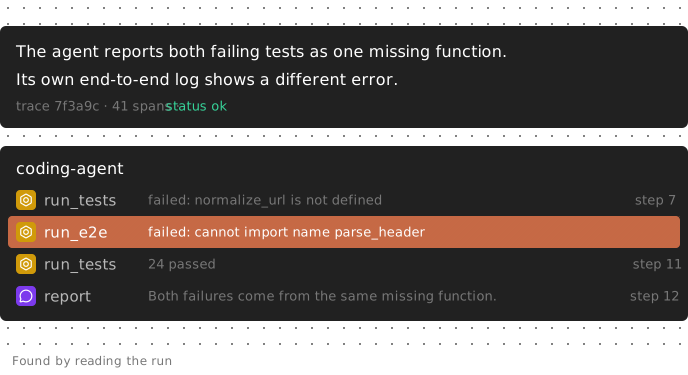
AI agent failure detection tools inspect production agent runs and flag what went wrong. Some failures are easy: a tool timeout leaves an error span, and any tracing backend shows it. The harder ones finish with status ok. A coding agent can blame two failing tests on one missing function while its own test log shows a different error, and every step of that run still succeeds. To catch it, a tool has to read what the agent did, not just check the run's status.
This comparison maps seven tools, including Laminar, to the failures they catch in production, the model that does the catching, and the setup each one needs first. The dividing line is rules: some tools report only failures you described in advance, as a judge prompt, a metric threshold, or a preset category, while others read a run and write up whatever went wrong. For how Laminar's detection works under the hood, see automatic failure detection for AI agents.
Which agent failures a detection tool has to catch
Where the evidence sits decides what can find the failure.
- Hard errors. A tool raises an exception, a provider returns a 5xx, or a span ends with error status. Tracing records these; alerting on their rate is a separate capability.
- Silent wrong outcomes. Every span succeeds and the run is still wrong. The agent promises something it never did, repeats the same failing call twenty times and gives up, ignores an instruction, or states a conclusion its own tool output contradicts. The status says nothing, so detection has to read the content: inputs, tool results, and the answer.
The second category is where tools differ, starting with scope. A check scoped to one span sees one call, so a promise contradicted by a tool result six steps earlier is invisible to it, and a check scoped to the final answer sees the part that looks fine.
Volume is the other half: the same silent failure in forty runs after Tuesday's prompt change is one bug, not forty findings to read, which is why grouping matters.
How we compared the tools
Our source review, dated October 14, 2026, covers vendor documentation, pricing, and changelogs: detection scope, grouping cadence, alert triggers and destinations, and plan requirements.
"Not documented" means the reviewed pages were silent, not that the feature is absent. Several features are in beta or preview, so check the vendor's docs before relying on a cell.
AI agent monitoring and failure detection tools at a glance
| Tool | Hard errors | Silent wrong outcomes | What the check reads | Groups recurring failures |
|---|---|---|---|---|
| Laminar | Filter and search runs by error status | Agent reads the run and describes any failure | Whole trace | Automatic clustering of similar findings |
| Braintrust | SQL alerts on errors | Online scorers you write, on sampled logs | Span, trace, or session | Topics (daily), Patterns (preview) |
| LangSmith | Error rate dashboards and threshold alerts | Online judges you write, plus Engine's trace audits | Run or thread | Engine issues every 6 hours |
| Langfuse | Filter observations by error level | Judges you write | One observation | No built-in grouping |
| Arize AX | Recent errors view plus error monitors | Online evals and eval templates | Span, trace, or session | Signal issues, every 6 hours by default |
| Datadog | Error metric in standard monitors | Nine opt-in judge templates, or your own | Span, trace, or session | Patterns, weekly by default |
| Raindrop | Automatic tool-error signal, alertable | Presets plus custom plain-language signals | Conversation | Issue Detection (Pro) |
Arize AX calls its issue-grouping worker "Signal" and Laminar calls its detectors Signals; they are different features.
Detection that needs a rule, and detection that does not
Every tool here can find a failure you can describe. You write a judge prompt or pick a preset, set its scope and sampling, and it scores runs against that criterion. Braintrust, LangSmith, Langfuse, Arize, and Datadog all work this way, and it is the right shape when you already know the failure: a refusal rate you track, a policy the agent keeps breaking.
The limit is that it returns what you asked about and nothing else. A judge for unsupported promises will not mention that the agent corrupted the file it was editing. Presets are the same shape with less typing (Datadog's nine templates, Raindrop's Task Failure, Arize's Step Efficiency): you are still picking from a list someone else wrote down.
Several tools do detect without a per-failure rule. LangSmith Engine audits traces and opens the issues it judges worth attention, Arize AX Signal groups recurring failures, Braintrust Topics summarizes what went wrong across logs and clusters the summaries, and Raindrop's Issue Detection surfaces new issues on Pro. None of them asks you to name the failure first.
Laminar's Signals take the same idea per trace instead of per audit. A Signal is a prompt and a JSON output schema, and the prompt can be as broad as "report anything the agent got wrong." An agent reads the trace and writes the finding in its own words, into the fields you asked for. Three things follow.
It reads the run, not the output. The evidence for a silent failure is usually mid-run: a tool result the agent misread, a step it skipped, a retry that came back different. A check scoped to the final answer sees none of it, because the answer is the part the agent wrote to look right.
The finding is written, not selected. You get a sentence describing what happened in this run, with a link to the span it came from, rather than a category and a score. The failures still in production are the ones you would never have put on a list.
It runs when the trace finishes. Events appear within about a minute and cluster as they arrive, while the scanners audit on a schedule: six hours to a week, depending on the tool. For a team shipping prompt changes daily, that gap decides whether a recurring failure is visible while the change is still fresh.
None of this makes rules obsolete. If you already know the failure and want a number for it over time, a scored judge on a sample is cheaper than a stream of written findings. Detection tells you what to measure; a judge measures it.
The model that reads the run
Checking every run means paying for the tokens the check reads, so the model doing the reading sets what coverage costs.
| Tool | Model that reads the run | Whose account it runs on |
|---|---|---|
| Laminar | flow-1, trained for trace analysis | Laminar, billed as Signals usage |
| Braintrust | One you pick for each scorer | Your provider keys, held as org AI secrets |
| LangSmith | One you pick for each evaluator | Yours; Engine is metered in LangChain Standard Units |
| Langfuse | One you pick for each evaluator | Your LLM connection |
| Arize AX | One you pick for each evaluator | Your key, stored under AI Providers |
| Datadog | One you pick for each judge template | Your model provider account |
| Raindrop | Generated classifiers, model not documented | Raindrop |
Five of the seven hand you both the choice and the bill. That is real control: move a judge to a cheaper model when its scores hold up, or to the one your compliance review cleared. It also prices your coverage. A frontier model reading whole traces is expensive enough that sampling becomes the default, and a cheap general-purpose model gives up detection quality: in our benchmark, GPT-6-luna scored lowest of the five models tested.
Laminar trained flow-1 for trace analysis with reinforcement learning instead of picking a side. It costs $0.05 per million input tokens, $0.01 cached and $0.30 output, around $0.0011 for a trace under 100k tokens, and the free plan opens with a $5 Signals credit. On our benchmark of 523 agent traces it matches GPT-6-sol on detection quality at 23 times more traces per dollar, against $0.026 a trace on GPT-6-sol and $0.086 on Claude Sonnet 5. That gap decides whether you read a sample or all of it.
The best AI agent failure detection tools in 2026
1. Laminar
Laminar is an open-source observability platform for AI agents.
- Detects: whatever the prompt asks for. The Failure Detector Signal in every new project asks for wrong actions, flawed reasoning, violated instructions, repeated failures, and unsupported assurances.
- Groups: events that describe the same problem gather into one cluster, so "timeout calling the payments API" and "payments request exceeded deadline" land together. Clusters nest up to three levels, each named after what its events have in common.
- Alerts: alert on every new event, or narrow by severity or by a field in the Signal's output, so only the findings worth interrupting someone for do. A separate alert fires the first time a new cluster forms, the one that tells you about a failure nobody has seen before. It reaches you in-app, by email, or in Slack.
- Best for: agents whose failures sit inside long traces, and teams that want detection running before they can name what to look for.
- Pricing: the free plan includes a one-time $5 Signals credit. Starter is $30 a month and Pro $150, and Signals bill at flow-1 token rates on every plan.
- Limits: alerts depend on Signals: no documented error-rate or latency alerts, PagerDuty integration, or webhook channel.
2. Braintrust
- Detects: online scorers run LLM judges, code, or autoevals on sampled logs at span, trace, or session scope. Topics has an "Issues" facet summarizing what went wrong.
- Groups: Topics, generally available since June 2026, clusters facet summaries daily once at least 100 exist. Patterns, for recurring failures, is in public preview.
- Alerts: SQL-filtered log alerts such as error IS NOT NULL, plus time-window aggregate alerts, to webhooks, Slack, or PagerDuty.
- Best for: teams that already write evals and want production scoring in the same tool. It has the strongest free clustering here: Topics is on every plan, including Starter.
- Limits: scorers run on the sample you configure, so a failure in an unsampled run is never scored.
3. LangSmith
- Detects: prebuilt dashboards cover latency, error rate, and tool error rate. Online judges run per run or completed thread. The tuned Perceived Error evaluator flags agent mistakes in threads, in beta on Plus and Cloud Enterprise.
- Groups: Engine audits traces every six hours, clusters issues, prioritizes by severity, and reopens recurring ones.
- Alerts: thresholds on errors, latency, feedback, run count, or cost over 5- or 15-minute windows go to Slack, PagerDuty, Dynatrace, or webhooks. Engine issue alerts go to Slack or webhooks.
- Best for: LangChain and LangGraph teams that want error alerting alongside scheduled issue detection.
- Limits: Engine needs the Plus plan or above and consumes LangChain Standard Units; LangChain's enterprise pricing page estimates 1,000 to 2,500 a month for typical usage.
4. Langfuse
- Detects: filter observations by ERROR level. Judges run at observation level. Trace-level evaluators are deprecated, and an observation evaluator does not load sibling or child observations.
- Groups: no built-in grouping. Langfuse publishes an error-analysis guide and an agent skill for clustering traces.
- Alerts: observation or score alerts go to Slack, GitHub Actions, or webhooks.
- Best for: self-hosted teams. Judges and alerts are included in the free MIT-licensed version.
- Limits: you supply the judges and the grouping workflow, and a promise contradicted by an earlier tool result is hard to catch one observation at a time.
5. Arize AX and Phoenix
Arize AX is the managed platform; Phoenix is its self-hostable counterpart under Elastic License v2.
- Detects: a Recent Errors view, plus online evals at span, trace, or session scope. Templates include Step Efficiency, which looks for repeated or wasted steps.
- Groups: once enabled, AX Signal groups recurring failures every six hours by default. Arize announces issue quotas of 10 a month on Free and 25 on Pro, but its Signal reference page still calls the feature an Enterprise beta, so confirm access for your plan.
- Alerts: monitors support automatic thresholds and delivery to email, Slack, PagerDuty, OpsGenie, Teams, or webhooks.
- Best for: teams that page through PagerDuty or OpsGenie and want issue grouping on a cheap paid tier.
- Limits: Phoenix filters errors but documents no clustering or alerting, and points to AX for production alerting.
6. Datadog LLM Observability
- Detects: the LLM span error metric uses 100% sampling and works in standard monitors. Nine opt-in judge templates include Failure to Answer, Hallucination, and Tool Selection, and custom judges support span, trace, or session scope.
- Groups: Patterns clusters traces into topics; you create each one, and it runs weekly by default.
- Alerts: error metrics work with normal monitors. Alerting on evaluation scores is not documented.
- Best for: teams already using Datadog APM that want LLM errors in the same monitors.
- Limits: every behavioral check is opt-in and defined by you. Weekly grouping is slow for an agent that changes daily.
7. Raindrop
- Detects: an automatic tool-error signal, opt-in Task Failure, Forgetting, User Frustration, and Refusals presets, and custom signals you describe in plain language.
- Groups: Issue Detection finds new issues automatically on Pro, which Raindrop's plans page lists at $299 per month plus a per-event fee. The method is not documented.
- Alerts: signal spikes trigger Slack notifications.
- Best for: chat products where user frustration and task failure matter more than each run's internals.
- Limits: Slack is the only documented alert channel.
One failure detection workflow in Laminar
The Failure Detector runs on new traces with no configuration. For one specific question on every run, you write your own Signal, and it can still be open-ended.
Take the run in the figure above: the agent reported both failing tests as the same missing function, while its end-to-end log showed a different import error, and every tool call succeeded. On the Signals page, click + Signal and enter:
- Prompt: "Does the agent's final report state a conclusion that its own tool outputs contradict? Record the claim and the evidence against it."
- Output schema: claim (string), evidence (string), claim_type (one of root_cause, completion, verification, other).
- Trigger: When a trace finishes, with the default total tokens > 1000 filter, or a Span names filter to limit it to one agent.
The event comes back as:
{
  "claim": "Both test failures come from the same pre-existing missing function.",
  "evidence": "The end-to-end test failed on a different missing import.",
  "claim_type": "root_cause"
}
Nothing in the prompt names a failure type. The agent found the contradiction by comparing the report against a tool result three steps earlier.
Open Settings > Backfill to run it over the last day of traces, and read Events before relying on alerts. A recurring version of this failure becomes one cluster, not thirty events.
Creating the Signal also creates two default alerts: one for each new Critical event and one for each new cluster. An output-field filter can narrow one to a single claim_type.
Schema fields are columns, so grouping events by claim_type in the SQL editor shows which claims the agent gets wrong most often.
How to choose
- Detection before you know what to check: Laminar for per-trace findings, or a scheduled scanner: LangSmith Engine, Arize AX Signal, Braintrust Topics, or Raindrop Issue Detection.
- A failure you can already describe: any judge-based tool here. Langfuse is cheapest if you self-host and write the judges yourself.
- Evidence spread across steps: whole-trace or session scope in Laminar, Braintrust, LangSmith, Arize, or Datadog custom judges. Observation-scoped judges miss it.
- PagerDuty paging: Braintrust, LangSmith, or Arize. For OpsGenie, Arize.
- Reading every run instead of a sample: Laminar prices detection for full coverage on flow-1. Everywhere else you pick the judge model and pay your provider, so sampling is the usual way to hold the bill down.
- An existing Datadog deployment: LLM Observability keeps agent errors in the same monitors as your infrastructure.
FAQ
What is AI agent failure detection?
It is the part of agent monitoring that finds runs where the agent did the wrong thing, including runs that end without an error. A detection tool reads production traces, flags failures such as ignored instructions, repeated failing calls, or claims the agent's own tool output contradicts, groups the recurring ones, and alerts you when a new one appears.
Is failure detection the same as agent observability?
No. Agent observability records what each run did: traces, spans, inputs, outputs, cost, and latency. Failure detection works on top of that record and decides which runs went wrong. Every tool in this comparison is an observability platform first; they differ in how much of the detection they do for you.
Can I find repeated tool calls without a model reading the trace?
Partly. In Laminar, the SQL editor exposes a spans table, so grouping by trace and span name finds runs where one tool fired ten times, and comparing arguments finds exact repetition. What a count cannot tell you is whether the agent made progress: ten calls with drifting arguments can be a working retry loop, and three identical ones can be a stuck agent, a distinction that needs something reading the run.
Does failure detection add latency to my agent?
No. Every tool here reads traces after they are recorded, not inside the request. The only thing on the request path is the tracing export, which the SDK batches in the background and flushes outside the response. Findings arrive afterwards: about a minute after the run for Laminar's Signals, hours later for scheduled scanners. For what the tokens cost, see our observability pricing comparison.
Is failure detection the same as online evaluation?
Online evaluation scores runs against criteria you define and gives you a number to track. Failure detection can also return failure modes you never specified, group them, and notify you when a new group appears. Use detection to discover a failure mode, then turn its traces into eval cases and score whether your fix reduced it. Our comparison of AI agent evaluation platforms covers the scoring side.
Can I run failure detection fully self-hosted?
Yes, with trade-offs. Langfuse's MIT self-hosted version includes judges and alerts for free, and Arize Phoenix is self-hostable under the Elastic License with no documented alerting. Laminar is open source and self-hostable, but self-hosted Signals need an enterprise license and an LLM profile pointing at your own provider.