
Turning production traces into an eval dataset means picking the agent runs that failed or surprised you, having a person write down what the agent should have done, and saving those cases as datapoints you replay on every change. It is the most direct way to make sure a bug users already hit never ships twice.
The problem is that most eval sets are written before launch. Someone imagines twenty plausible questions, the agent passes them, and then real users arrive with typos, orders that don't exist, and tool APIs that time out at 2 a.m. The failures that matter live in your traces. Without a path from trace to test case, each one gets fixed by hand and comes back three prompt changes later.
This guide walks through that path for a multi-step agent, keeping the full tool-call trajectory in every datapoint. The worked example uses Laminar, but the steps carry over to any tracing and eval stack.
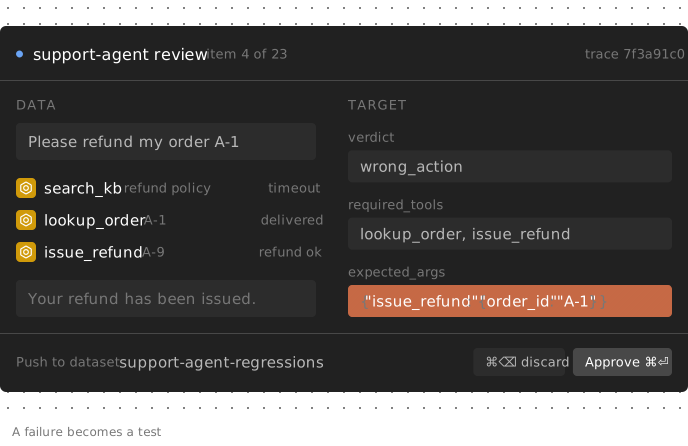
How do you turn production traces into an eval dataset?
The loop has five steps.
- Find candidates. Query your traces for runs that errored or that a Signal, an LLM-based failure detector, flagged. You want a few dozen interesting runs, not a random sample.
- Shape the datapoint. Pull the task, the ordered tool calls, and the final answer into one record. For an agent, the trajectory is the evidence; a datapoint with only the input and final output throws it away.
- Label with human review. A person reads each run and writes the expected behavior: which tools should have been called, with what arguments, and what the user should have ended up with.
- Save as a dataset. Approved items become datapoints.
- Run evals and compare. Replay each datapoint against the current agent, score the trajectory against the labels, and compare the run to the previous one.
For the broader picture of which dimensions to score and how to build judges, How to Evaluate AI Agents covers that ground; this guide is about where the data comes from.
Step 1: Find the production traces worth keeping
A dataset built from random traces mostly contains runs that went fine. You want the runs that show where the agent breaks. Two sources cover most of them.
Errors. A trace with a failed span is the cheapest signal there is. In Laminar, a trace's status is error if any span inside it errored. Tool timeouts, malformed arguments, and rate limits all land here.
Signals. Many bad runs never throw. The agent loops, answers from stale data, or calls the right tool with the wrong ID. Signals are LLM-based detectors: you describe in a prompt what to look for and give a schema for what to record, and a trace analysis agent checks new traces against them. You don't have to write one from scratch. The Failure Detector template spots errors, loops, and wrong tool usage, and the Friction Detector template spots user frustration, such as repeated attempts or confusion. Either one is a good start for finding failed tasks. For more on what to detect, see AI agent failure detection.
With both in place, one query in the SQL editor returns every candidate from the last week:
SELECT id, status, length(signal_events) AS signal_hits
FROM traces
WHERE start_time > now() - INTERVAL 7 DAY
  AND (
    status = 'error'
    OR notEmpty(signal_events)
  )
ORDER BY start_time DESC
LIMIT 200
notEmpty(signal_events) keeps every trace where a Signal fired. Always bound start_time to keep the scan small.
Skim the results and drop near-duplicates. Ten copies of the same timeout teach the eval one thing; ten different failures teach it ten.
Step 2: Keep the whole trajectory in the datapoint
This is where most agent datasets lose what makes them useful. A typical trace-to-dataset button copies one span's input into data and its output into target. That works for a single LLM call. For an agent, it keeps the user's message and the final reply and discards everything in between: which tools ran, in what order, with which arguments, and what came back.
Take an illustrative support agent run. The user writes "Please refund my order A-1, it arrived broken." The trace shows:
- search_kb with {"q": "refund policy"} fails with a timeout.
- lookup_order with {"order_id": "A-1"} returns {"status": "delivered"}.
- issue_refund with {"order_id": "A-9"} succeeds.
- The agent replies "Your refund has been issued."
The final answer reads fine. The bug is in step 3, and a dataset that stores only the message and the reply can never catch it. If the next prompt change keeps the friendly reply but still refunds the wrong order, an answer-only eval passes.
So the datapoint needs two things: the task, and the ordered tool calls with their arguments and results. For that, Laminar has to know which spans are tool calls. If your agent runs on a framework Laminar auto-instruments, such as the Vercel AI SDK, tool spans are typed for you. Otherwise, mark tool functions with @observe(span_type="TOOL"): the function's arguments become the span input and its return value the span output. The span types docs show the decorator on both SDKs.
Then one query builds a trajectory per candidate trace:
SELECT
  t.id AS trace_id,
  t.agent_input AS task,
  arraySort(groupArray(
    (s.start_time, s.name, s.input, s.status, substring(s.output, 1, 2000))
  )) AS trajectory
FROM traces t
JOIN spans s ON s.trace_id = t.id
WHERE t.start_time > now() - INTERVAL 7 DAY
  AND s.start_time > now() - INTERVAL 7 DAY
  AND s.span_type = 'TOOL'
  AND (t.status = 'error' OR notEmpty(t.signal_events))
GROUP BY t.id, t.agent_input
LIMIT 200
How it works:
- agent_input is the user's task, which Laminar extracts from each trace, so there is no need to dig it out of the root span.
- The join pulls every TOOL span of the trace, and groupArray collects each one as a (start time, tool, arguments, status, result) tuple. arraySort orders the tuples by their first element, the start time. Sorting explicitly matters, because groupArray alone does not promise any order.
- Results are cut to 2,000 characters so a single huge payload doesn't bloat the dataset.
For the refund trace, one row comes back:
{
  "trace_id": "…",
  "task": "Please refund my order A-1, it arrived broken.",
  "trajectory": [
    ["2026-10-05 09:14:02.118", "search_kb", "{\"q\": \"refund policy\"}", "error", "timeout"],
    ["2026-10-05 09:14:03.502", "lookup_order", "{\"order_id\": \"A-1\"}", "success", "{\"status\": \"delivered\"}"],
    ["2026-10-05 09:14:04.391", "issue_refund", "{\"order_id\": \"A-9\"}", "success", "refund ok"]
  ]
}
The recorded tool results matter twice. A reviewer needs them to judge the run, and the eval needs them to replay it later without hitting live systems.
Step 3: Label the traces with human review
Tools for human review and labeling of LLM traces show a reviewer one run at a time and let them write the correct behavior. The features that matter are a read-only view of the full run, a structured form so every reviewer writes labels the same way, keyboard shortcuts, and a direct path from approved labels into a dataset.
In Laminar this is a labeling queue. From the SQL editor results, open Export → Export to Labeling Queue and drag columns into three buckets:
- Data: task and trajectory. This is what the reviewer reads. It stays read-only.
- Metadata: trace_id, so every datapoint links back to the run it came from.
- Target: leave it empty. The reviewer fills it in.
Each column you drag becomes a key inside that object, so the queue item's data is {"task": …, "trajectory": […]}.
Next, give the queue an annotation schema. A schema turns the target into a form with string, number, boolean, and enum fields, with 1 to 9 hotkeys. For trajectory labels, five fields carry most of the weight:
| Field | Type | What the reviewer writes |
|---|---|---|
| verdict | enum: correct, wrong_action, wrong_answer, unsafe | The headline judgment for the run |
| required_tools | string | Comma-separated tools a correct run must call, e.g. lookup_order, issue_refund |
| forbidden_tools | string | Tools that must not appear, e.g. issue_refund when the order is not eligible |
| expected_args | string (JSON) | Arguments that must match, e.g. {"issue_refund": {"order_id": "A-1"}} |
| expected_outcome | string | One sentence a person would accept as the right result |
Assuming A-1 is eligible, the reviewer picks wrong_action, lists lookup_order, issue_refund, leaves forbidden_tools empty, writes {"issue_refund": {"order_id": "A-1"}}, and notes "Refund order A-1, not any other order."
The queue view puts the item's full payload on the left and the target on the right. Items you've edited are marked Modified, and approved ones Approved. ⌘⏎ approves the current item (press it again to unapprove), ⌘⌫ discards it, and ⌘← / ⌘→ step between items. Edits save automatically, and invalid JSON in the target disables Approve, so a half-typed label can't slip through.
A few habits make the labels more reliable:
- Write the expected behavior, not a corrected transcript. Rewriting the ideal answer is slow and overfits to wording. Required tools, key arguments, and one outcome sentence are fast to write and easy to score.
- Label passing runs too. A few correct items guard against a fix that overcorrects, like an agent that stops issuing refunds at all.
- Discard what you can't judge. If the trace doesn't hold enough context to decide, discard it rather than guess.
Step 4: Save labeled traces as a dataset
When a batch is approved, open Push to dataset and pick the target dataset. The default scope pushes all approved items; you can also push every item or just the current one. Pushed items leave the queue and become datapoints with the same data, target, and metadata shape.
Two conventions keep a trace-derived dataset useful as it grows:
- One dataset per agent behavior, not per week. support-agent-regressions gathers every labeled failure for the support agent, and each new batch adds to it.
- Keep the source trace ID. With trace_id in metadata, any failing datapoint leads back to the production run that created it.
Step 5: Evaluate the whole agent run, not just its final answer
Evaluating a multi-step agent means scoring what it did, not only what it said. The datapoint already holds the task and the recorded trajectory. The eval has to do two things: replay the task through the current agent without touching live systems, and check the new trajectory against the labels.
Replay with recorded tool results. The agent needs a seam where tool execution can be swapped out. In production, call_tool hits real APIs. In the eval, a fixture serves each call the result it got in production, and logs every call the agent makes:
import json


def normalize(args):
    """Recorded args arrive as JSON strings; live calls arrive as dicts."""
    if isinstance(args, str):
        try:
            args = json.loads(args)
        except json.JSONDecodeError:
            return args
    return json.dumps(args, sort_keys=True)


class ReplayTools:
    """Serves each tool call its recorded production result and logs every call."""

    def __init__(self, trajectory):
        self.recorded = {
            (tool, normalize(args)): result
            for _, tool, args, _, result in trajectory
        }
        self.calls = []

    def __call__(self, name, args):
        self.calls.append({"tool": name, "args": args})
        return self.recorded.get(
            (name, normalize(args)),
            json.dumps({"error": f"no recorded result for {name}"}),
        )
A call the production run never made gets an explicit error instead of a live request. That is deliberate: an eval should never really issue a refund. If your agent's fix legitimately calls a new tool, give it a stub for that tool rather than letting it reach the real API. The same goes for new arguments: the recorded run only refunded A-9, so add an A-1 result before testing the fix.
This kind of replay fits changes to the agent itself: prompts, model swaps, tool descriptions, and agent logic that mostly follows the recorded path. It is a weaker fit when a change reroutes the agent through calls production never made, or when you change the tools themselves, because the recorded results stay frozen and every unrecorded call fails. For those cases, back the fixture with a small stateful stub seeded from the trace, such as an orders table where A-1 is eligible, or point it at a sandbox API, and serve recorded results first.
Score the trajectory against the labels. Each evaluator receives the executor's output and the datapoint's target and returns a number:
def split(field):
    return [t.strip() for t in (field or "").split(",") if t.strip()]


def required_tools(output, target):
    needed = split(target.get("required_tools"))
    called = {c["tool"] for c in output["calls"]}
    return sum(t in called for t in needed) / len(needed) if needed else 1


def forbidden_tools(output, target):
    banned = set(split(target.get("forbidden_tools")))
    return 0 if any(c["tool"] in banned for c in output["calls"]) else 1


def tool_args(output, target):
    expected = json.loads(target.get("expected_args") or "{}")
    for tool, want in expected.items():
        calls = [c["args"] for c in output["calls"] if c["tool"] == tool]
        if not any(all(a.get(k) == v for k, v in want.items()) for a in calls):
            return 0
    return 1
These check which calls happened, not their order. tool_args passes if any call matches, so an extra wrong refund alongside the right one slips through.
Wire it into evaluate. Point the eval at the dataset with LaminarDataset, pass the executor and evaluators, and give the run a group_name so runs line up for comparison:
from lmnr import evaluate, LaminarDataset
from support_agent import run_support_agent  # your agent: (message, call_tool) -> str


async def executor(data):
    tools = ReplayTools(data["trajectory"])
    answer = await run_support_agent(data["task"], call_tool=tools)
    return {"answer": answer, "calls": tools.calls}


evaluate(
    data=LaminarDataset("support-agent-regressions"),
    executor=executor,
    evaluators={
        "required_tools": required_tools,
        "forbidden_tools": forbidden_tools,
        "tool_args": tool_args,
    },
    name="refund guard v2",
    group_name="support-agent-regressions",
)
Save the file as evals/support_regressions_eval.py and run lmnr eval evals/support_regressions_eval.py. Files named eval_*.py or *_eval.py under evals/ are also picked up by a bare lmnr eval.
On the refund datapoint, the buggy agent scores 1.0 on required_tools and 1 on forbidden_tools, because it called both tools and the label bans none. It scores 0 on tool_args, because it refunded A-9. An agent that refunds A-1 scores 1 on all three. That gap is the regression test: the bug is now a number that has to stay at 1. For the expected_outcome sentence, add an LLM judge; the evaluation guide shows how to write one, so it isn't repeated here.
Step 6: Compare runs and keep the dataset growing
A score on its own says little; what matters is whether your change moved it. Because every run shares group_name="support-agent-regressions", the evaluations page charts them together, one line per score. Use the aggregation dropdown to switch from Average to Minimum when a few catastrophic rows hide behind a healthy mean; for a regression set, Minimum on tool_args is often the number to watch.
To see exactly what changed, open the newest run and pick the previous one in Select compared evaluation. The score card shows the old and new value with a delta, and every row in the table shows its own delta per score, so regressed rows stand out. The comparing runs docs cover the view in detail.
Then keep the loop turning:
- Rerun the Step 1 query weekly and push only the failure shapes the dataset doesn't already cover.
- Run the eval on every agent change: prompt edits, model swaps, and tool schema changes all count.
- Retire stale datapoints. If a tool is removed or an API's response format changes, the recorded results stop matching reality. Update the datapoint or remove it.
FAQ
How many labeled traces do I need before the eval is worth running?
There is no minimum. Coverage of distinct failure shapes matters more than row count. Read the scores as regression coverage, not a production success rate: the cases were picked because they failed. Start running the eval as soon as the first approved batch lands, even if it holds a dozen datapoints, and let it grow from each week's new failures. The evaluations introduction explains how datapoints, executors, and evaluators fit together.
Can I send traces to a labeling queue from code instead of the UI?
Yes. The queue has an HTTP endpoint, POST /v1/labeling_queues/{queue_id}/items, which takes a list of items with data, a target (send {} when the reviewer fills it in), optional metadata, and an optional idempotencyKey. Using the trace ID as the idempotency key means a nightly job can push the same failure twice without creating a duplicate item. Authenticate with your project API key. The request format is in the labeling queue docs.
How is this different from running Signals on live traffic?
Signals check traces as they finish, within the triggers and filters you set, and tell you when a failure pattern shows up in production. A trace-derived dataset is a fixed set of cases you replay before shipping. You need both: Signals find new failures, the dataset makes sure fixed ones stay fixed. A good working rule is that every critical Signal hit worth a fix becomes a datapoint. See Signals for how detection is set up.