
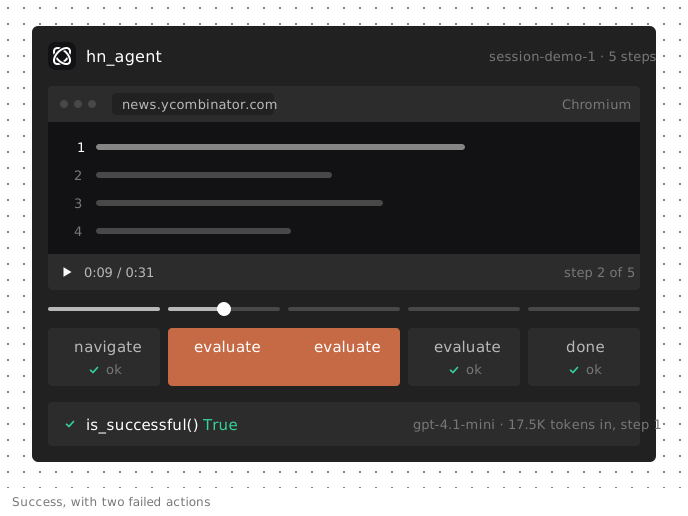
Browser Use agent observability records the model calls, browser actions, and page state needed to explain a run after it ends. In our Hacker News test, the agent returned the correct top-story title and history.is_successful() was True. Two of its five actions had still failed with JavaScript errors. A login task failed differently: the agent stopped at a reCAPTCHA, explained that it could not finish, and history.errors() recorded no errors at all.
Neither the final answer nor an exception counter tells you what happened between the first navigation and done.
This guide shows what to capture, how Laminar connects model calls to browser actions, and how to debug production failures. We tested browser-use 0.13.11 with lmnr 0.7.64, Browser Use's ChatOpenAI, and real Chromium.
What Browser Use agent observability has to show
Browser Use runs an observe-and-act loop. Each step sends the model a serialized page with numbered interactive elements and, by default, a screenshot (use_vision=True). The model chooses actions such as click, input, navigate, or evaluate. Browser Use executes them in Chromium over the Chrome DevTools Protocol (CDP).
The loop stops when the model calls done, the run reaches its step limit, or a stopping condition fires, such as too many consecutive failures.
You need visibility into each part:
- Model calls: the page state the model received, its response, chosen actions, and token usage.
- Actions: the parameters passed to each action and its result or error.
- Browser state: what the page showed when the action ran.
The AgentHistoryList returned by agent.run() exposes final_result(), errors(), action_names(), urls(), is_done(), is_successful(), and screenshot_paths(). These help with local debugging. Production also needs retained runs, search, and context that connects each run to a user and deployment.
Browser state matters because an action result can omit the fact you need. A search API returns readable JSON. A click on element 1330 might return "Clicked button" without proving it clicked the intended button. You need the page state alongside that action to investigate.
For the fields shared with other agent architectures, see agent observability.
What to capture from every Browser Use run
Our Hacker News run took five steps: navigate, three evaluate actions, and done. It produced one trace with 19 spans: 5 LLM, 5 TOOL, and 9 DEFAULT spans.
| Layer | In a Browser Use run | In the trace |
|---|---|---|
| Run | Task and final result | Your @observe root span (Browser Use's agent.run sits beneath it and records neither) |
| Step | One observe-and-act cycle | agent.step |
| Model call | Page-state prompt, output, token usage | openai.chat, type LLM |
| Action | navigate, click, input, evaluate, done | TOOL span named after the action, input {"action", "params"}, output with an error field |
| Browser | DOM changes and rendered page | Session recording attached to the trace |
| Context | User, session, deployment, outcome | User/session IDs, metadata, and tags |
Action spans preserve parameters. In the login run, an input span recorded {"action":"input","params":{"index":1330,"text":"demo-user","clear":true}}. The index refers to the element list for that step. By itself, it does not identify a field you can inspect later.
Page state accounts for substantial token usage. The first Hacker News model call used 17,534 input tokens and 204 output tokens with gpt-4.1-mini. Browser Use sends its system instructions and page context to the model on every step. Per-call token counts help you find expensive steps instead of attributing everything to the final answer. See AI token cost for attribution.
Browser Use can make calls beyond action selection. In 0.13.11, use_judge defaults to True. The judge evaluates the finished run and adds a _judge_trace span and another model call. Account for that work when reading the trace.
Tracing a Browser Use agent with Laminar
Install the SDK, Browser Use, and its Chromium bundle:
pip install lmnr browser-use python-dotenv
uvx browser-use install
Put LMNR_PROJECT_API_KEY and your model provider key in .env. Call Laminar.initialize() before creating the agent. Browser Use emits step spans through the SDK, Laminar instruments the model client, and Laminar attaches a session recorder to the CDP session Browser Use opens.
This Python example ran unchanged and completed the task:
import asyncio
from dotenv import load_dotenv
from browser_use import Agent, ChatOpenAI
from lmnr import Laminar, observe

load_dotenv()
Laminar.initialize()


@observe(name="hn_agent")
async def run_task(task: str, user_id: str, session_id: str):
    Laminar.set_trace_user_id(user_id)
    Laminar.set_trace_session_id(session_id)
    Laminar.set_trace_metadata({"env": "production", "agent_version": "2026-10-08"})

    llm = ChatOpenAI(model="gpt-4.1-mini", temperature=0.0)
    agent = Agent(task=task, llm=llm)
    history = await agent.run(max_steps=8)

    if not history.is_successful():
        Laminar.add_span_tags(["task_failed"])
    return history.final_result()


if __name__ == "__main__":
    asyncio.run(run_task(
        "Go to https://news.ycombinator.com and return the title of the top story.",
        user_id="user-42",
        session_id="session-demo-1",
    ))
@observe creates the root span and records the function arguments. Browser Use's spans nest beneath it. The user and session setters attach request context; metadata identifies the environment and agent version.
The failure tag needs special attention. is_successful() returns False when the agent finishes unsuccessfully and None when it has not finished, including after exhausting its step budget. The condition catches both, so the tag marks runs that failed without raising anything. If agent.run() raises instead, the tag line never runs; @observe records the exception and marks the root span as an error.
In the login test, the root span carried task_failed, and spans carried the supplied IDs and metadata. Laminar builds trace tags from the union of span tags, so a root-span tag is queryable at trace level.
Use Browser Use's chat classes, not LangChain's. Laminar's debugger guide uses ChatAnthropic the same way: swap the import and the model. See the Browser Use integration docs.
Seeing LLM calls and browser actions in one trace
Laminar supports combined model and browser tracing through its Browser Use and Playwright integrations. The useful requirement is shared trace context: the model call that selected an action, the action's parameters, and the resulting browser state must belong to the same run.
The transcript view displays model turns followed by their actions, with inputs and outputs inline. The browser recording plays alongside the trace. Its timeline is synchronized with agent steps, and the trace timeline shows the replay playhead.
That lets you check a claim such as "I clicked the login button" against the page at that moment. A cookie banner covering the button would explain more than a successful click result alone.
In our runs, the CDP session spans carried lmnr.internal.has_browser_session=True. Laminar turns that attribute into the has_browser_session column on the traces table, which is how you find browser runs in SQL.
For agents that drive the browser directly, Laminar documents Playwright instrumentation in Python and JavaScript, plus Puppeteer and Stagehand integrations. These attach recordings to the surrounding agent trace.
Without Browser Use, you supply the agent's step boundaries. Wrap each observe-and-act cycle in your own spans so model calls and browser work have a useful parent, rather than appearing as an undifferentiated sequence.
Failure modes specific to browser agents
A browser agent acts on a live page, not a fixed API response. Separate observed failures from patterns you need to test for in your own application.
Errors absorbed by retries
The Hacker News run succeeded after two evaluate actions returned JavaScript execution error: Uncaught. A third evaluation worked. Browser Use fed the errors back to the model, which recovered.
These errors remained in history.errors() and in the action spans' output, as TOOL spans whose error field is set. The second SQL query below selects exactly those. Track them even on successful runs: recovery still consumes time and model calls.
Failure reported in prose, not in errors
The login run called done with success: false and an explanation citing reCAPTCHA. is_done() was True, is_successful() was False, and errors() held only None, one entry per step with no error.
Exception-only monitoring would miss this outcome. The example's task_failed tag caught it. In a recorded production run, inspect the page as well as the agent's explanation; the explanation alone is not independent confirmation.
Running out of steps
Agent.run() defaults to max_steps=500. A stalled agent can make many page-heavy model calls before reaching that limit.
When it exhausts the budget without completing, is_done() is False and is_successful() is None. Set a task-appropriate limit and track step counts, including for successful runs.
Model provider failures
Browser Use stops after max_failures consecutive failures, defaulting to 5. Its fallback_llm is unset by default.
In one run, our model endpoint rejected the temperature parameter on every call. The agent executed one navigate, logged Stopping due to 5 consecutive failures, and returned final_result() as None. Inspect model errors before assuming the browser stalled.
Loops and stagnation
That provider-failure run also logged Loop detection nudge injected (repetition=0, stagnation=5). Its urls() list repeated the same URL six times.
Browser Use's loop detector flagged it, but the cause was the provider, not the page. Repeated URLs flag a run to inspect; they do not prove the model kept clicking the same element.
Stale element indices
Actions reference indices from the page state supplied to the model. A re-render between observation and execution (a modal opens, a list loads more rows, an A/B test swaps the layout) can invalidate that state or change the intended target.
When investigating this possibility, compare the model's element list with the page around the action. A successful click result does not establish that the intended target received it.
For failures outside the browser layer, see AI agent failure detection.
How to debug a Browser Use agent that fails in production
1. Find the failing runs
Use the SQL editor to find browser runs tagged as failed or incomplete by the wrapper, ordered by cost:
SELECT id, session_id, user_id, duration, total_cost
FROM traces
WHERE start_time > now() - INTERVAL 7 DAY
  AND has_browser_session = true
  AND has(tags, 'task_failed')
ORDER BY total_cost DESC
LIMIT 20
Runs that raised never got the tag. To include them, replace the tag filter with (has(tags, 'task_failed') OR status = 'error').
Then look for action errors that an overall success verdict could hide:
SELECT trace_id, name, start_time, JSONExtractString(output, 'error') AS error
FROM spans
WHERE start_time > now() - INTERVAL 7 DAY
  AND span_type = 'TOOL'
  AND JSONExtractString(output, 'error') != ''
ORDER BY start_time DESC
LIMIT 50
The second query finds all TOOL spans with nonempty error fields. It does not restrict results to successful runs or browser traces; inspect the parent trace to determine the outcome.
Keep the time bounds: spans are ordered by start_time, and unbounded scans can be expensive.
2. Read the trace next to the recording
Find the first step where the chosen action diverged from the task. Read the page state in the model input, then inspect the recording at that point.
If the page changed after observation, investigate timing and page handling. If the intended element was visible but the model selected another, inspect its instructions and action output. If the page blocked access with a CAPTCHA or login wall, repeated retries may not help.
Choose the fix from the evidence. A prompt change will not resolve a provider rejecting request parameters.
3. Rerun with earlier model calls cached
The Laminar Browser Use debugger guide describes recording a run, then serving earlier model calls from that trace while you test changed code:
LMNR_DEBUG=true python agent.py 2>&1 | tee run.log
grep 'LMNR_DEBUG_RUN' run.log

npx lmnr-cli sql query "
  SELECT span_id, name, start_time
  FROM spans
  WHERE trace_id = '<trace-id>' AND span_type = 'LLM'
    AND start_time > now() - INTERVAL 1 DAY
  ORDER BY start_time ASC"

LMNR_DEBUG=true \
LMNR_DEBUG_REPLAY_TRACE_ID=<trace-id> \
LMNR_DEBUG_CACHE_UNTIL=<span-id> \
python agent.py
This is not a browser-state checkpoint. Only model calls are cached; browser actions execute live. If the page changed, cached model output may no longer match it.
The guide documents caching for ChatAnthropic and ChatOpenAI. Other providers, including ChatBrowserUse, make live calls during reruns. Each rerun becomes a new trace in the same debug session.
4. Turn the failure into a check
Use outcome tags and saved queries for failures the agent reports. For unreported mistakes, such as returning the wrong product's price, define a check against the task and trace evidence.
Laminar's Signals analyze traces using a prompt and record structured events for matches. Treat those events as another detection layer, rather than assuming the agent's success flag establishes correctness.
Keeping credentials out of traces and replays
In the unprotected login run, the password appeared in plain text in the input action span's input and output, and again in the agent's done text. Browser Use defaults sensitive_data to None.
Protect span data and browser recordings separately:
import os

agent = Agent(
    task="Log in to https://news.ycombinator.com/login as demo-user with password hn_password",
    llm=llm,
    sensitive_data={"hn_password": os.environ["HN_PASSWORD"]},
)
With this setting, the input span contained <secret>hn_password</secret>. The full 371 KB span dump, including model prompts, contained zero occurrences of the password.
Browser Use substitutes the real value into the page when the action executes, so the model only ever sees the placeholder. Only listed secrets receive this treatment. Other typed values, such as names or addresses, can still appear in spans.
For recordings, Laminar masks form fields through initialization options:
Laminar.initialize(
    session_recording_options={
        "mask_input_options": {
            "text": True, "textarea": True, "email": True, "tel": True, "number": True,
        }
    }
)
These options mask fields in the recording. They do not redact span inputs or outputs, so they cannot replace sensitive_data. Before deploying, inspect both captured spans and a recording made with test credentials. The available controls are listed in the browser agent observability docs.
FAQ
Which Browser Use versions does Laminar support?
Laminar's Python SDK has hooks for pre-0.5 releases and later 0.x versions. Older releases receive action spans from Laminar's instrumentation; from 0.6 onward, Browser Use emits step spans while Laminar adds recording and maintains span context across its event bus. Our tests cover browser-use 0.13.11 with lmnr 0.7.64, not every supported combination. Check the Browser Use integration page.
Why does my Browser Use trace have an extra LLM call after done?
The post-done call comes from Browser Use's judge. If you do not use its verdict, pass use_judge=False to Agent to disable that evaluation. Leaving it enabled means its token usage contributes to the run's cost, even though the browser task has already finished. Per-span and per-trace accounting is documented in cost tracking.
Can I record a Browser Use agent running on a cloud browser?
Yes, through a remote-browser provider that integrates with Laminar. Kernel is one: agents that drive Kernel browsers are traced down to the LLM calls and browser actions, with the session recording synced to the agent's steps. Kernel's reusable sessions and cookies can also preserve login state between runs. For other remote setups, confirm a test recording reaches its trace before relying on it. See the Kernel integration guide.
Do I need to call Laminar.flush() at the end of my script?
The SDK registers an exit handler that flushes pending spans on normal process exit. Call Laminar.flush() explicitly when a long-running worker needs pending spans exported before handing off a job, or before a serverless function can be frozen without running exit handlers. Normal-exit behavior does not guarantee delivery after abrupt termination. See flushing and shutdown.
How do I see every run a user's request triggered, including retries?
Choose the session ID at the request boundary and pass it into each run, rather than generating a new ID inside the agent function. Laminar groups traces with that ID, keeping retries and follow-up tasks together. To retrieve the group in SQL, filter with session_id = '<id>'. The grouping behavior is described in sessions.