
Claude Code can read a repository, edit files, run tests, and delegate work to subagents in a single turn. When a run fails or costs more than expected, its final response may not explain why. Claude Code observability lets you inspect the model calls, tool activity, and token usage behind the result.
This guide shows how to trace Claude Code with Laminar's plugin, inspect each turn and subagent, and query activity across sessions. It also covers how the plugin compares with Claude Code's native OpenTelemetry metrics, events, and beta tracing, plus how to configure tracing in CI.
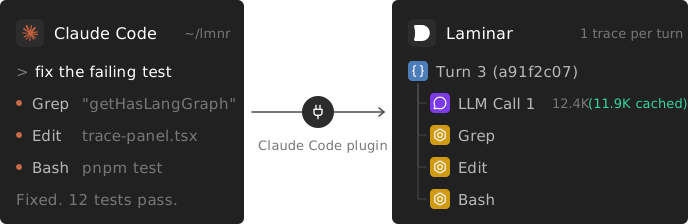
What "observability" means for a coding agent
A Claude Code session contains a sequence of turns. A turn begins with a user prompt, runs through model calls and tool calls, and produces an assistant response. To understand the result, you need visibility into four parts of that work:
- Model calls: which model responded, what it said, and the token usage reported for the response, including cache reads and writes.
- Tool calls: operations such as Read, Edit, Bash, Grep, Agent, and MCP tools, with their arguments and recorded results.
- Subagents: delegated work and the model calls and tool calls made within it.
- Turn metadata: the working directory, branch, and other available context that help you find the run later.
Metrics summarize usage across runs. Traces connect the steps within a run so you can inspect how the agent reached its result. Claude Code provides native OpenTelemetry export, and Laminar's plugin builds traces from the session transcript. The sections below cover both approaches, then walk through tracing with Laminar in local sessions and CI.
Option 1: native OpenTelemetry metrics and events
Claude Code's built-in OpenTelemetry support is useful when you already collect telemetry in a backend such as Grafana or Datadog. Enable metrics and log events with:
export CLAUDE_CODE_ENABLE_TELEMETRY=1
export OTEL_METRICS_EXPORTER=otlp
export OTEL_LOGS_EXPORTER=otlp
export OTEL_EXPORTER_OTLP_PROTOCOL=grpc
export OTEL_EXPORTER_OTLP_ENDPOINT=http://localhost:4317
Point the endpoint at your OTLP collector. Claude Code can report session counts, token usage, cost, code changes, tool decisions, and active time, along with events for prompts, tool results, API requests, and errors. Use OTEL_RESOURCE_ATTRIBUTES to attach team or environment context.
This answers team-wide questions such as monthly Claude Code spend, model usage, and sessions per developer. Prompt content is off by default and enabled separately.
Native distributed tracing
Claude Code also supports distributed tracing in beta. Add these variables to the configuration above:
export CLAUDE_CODE_ENHANCED_TELEMETRY_BETA=1
export OTEL_TRACES_EXPORTER=otlp
Native traces link an interaction to its model calls and tool executions, including nested subagents. Content is gated separately: OTEL_LOG_USER_PROMPTS controls prompt text, OTEL_LOG_TOOL_DETAILS enables tool details, and OTEL_LOG_TOOL_CONTENT enables supported tool-content events. Capture limits and supported fields vary by tool and Claude Code version. See Anthropic's monitoring documentation for the current behavior.
Native metrics can complement transcript-based tracing. The next section uses Laminar's plugin to send turns directly to a UI built for reading agent traces. If you also enable native trace export, account for the two representations when comparing totals.
Option 2: per-turn traces from the transcript
Claude Code writes session activity to a JSONL transcript and exposes hooks at lifecycle events. Laminar's Claude Code plugin uses those hooks to reconstruct turns as traces, with model calls, tool executions, and nested subagent activity. It exports them directly to Laminar, where you can read the transcript, browse sessions, and query activity across runs.
Install the plugin
With Node.js and Claude Code installed, run:
npx lmnr-cli@latest plugin add claude-code
The command signs you in through a browser, lets you choose a Laminar project, creates a project API key, and writes the configuration to ~/.config/lmnr/claude-code-plugin.json. It then installs the plugin through Claude Code's plugin marketplace.
Choose a dedicated project for coding-agent traces so they are easy to separate from your application's traces. The installation applies across repositories.
Run /reload-plugins in an open Claude Code session, or quit Claude Code and start it in a new terminal window. Use Claude Code as usual, then open the selected project in Laminar to inspect the exported turns.
If you prefer to install through Claude Code directly:
claude plugin marketplace add lmnr-ai/lmnr-claude-code-plugin
claude plugin install lmnr@lmnr --scope user
Then set LMNR_PROJECT_API_KEY in the environment that starts Claude Code. For a self-hosted Laminar instance, pass --base-url (the API URL, including its port) and --frontend-url to the installer, or set LMNR_BASE_URL. Environment variables override the plugin's saved configuration. The Claude Code integration docs cover both installation methods and self-hosting.
How the plugin works
The plugin uses Stop to process a turn after the assistant finishes responding, and SessionEnd to flush remaining work when the session ends.
The hook runs a Node.js script that reads new transcript content from a saved byte offset in ~/.claude/state/lmnr_state.json. It assembles the rows into turns, creates spans, and exports them as OTLP JSON to /v1/traces on the configured Laminar endpoint.
It captures the current prompt, assistant text, tool arguments and results, and reported token usage. This reconstructs the turn's activity; it does not retain a complete copy of each API request, its full message history, or non-text content such as images and thinking blocks.
Three behaviors affect when traces appear:
- Fail-open. Export failures return zero to Claude Code. The hook runs synchronously with a bounded export wait, so it can add time.
- Retries. After a failed export, the next hook invocation can retry from the saved transcript position. Delivery is best effort: interrupted sessions can lose traces and retries can produce duplicates.
- Async subagents. Turns can be deferred until a background agent's completion notification arrives. SessionEnd flushes remaining turns with the data available.
Set CC_LMNR_DEBUG=true to write debug logs to ~/.claude/state/lmnr_hook.log. Captured text, including tool-result text, is truncated at 20,000 characters by default; adjust it with CC_LMNR_MAX_CHARS.
What a turn looks like as a trace
By default, the plugin gives each exported turn its own trace, named Claude Code - Turn N (<short session id>). The root span carries the captured user prompt as input and final assistant text as output. Model calls and tools sit underneath it, with subagent activity nested under the launching Agent or legacy Task tool call.
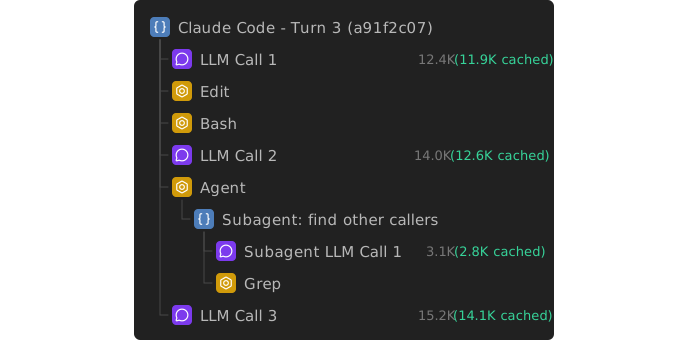
LLM spans record the model, captured messages, and reported input, output, cache-read, and cache-write token fields. Laminar uses token usage and model rates to calculate estimated cost. Cache accounting matters because Claude Code relies on prompt caching: verify the integration's cache-token accounting before using these estimates for billing or cache-hit reporting. The cost tracking docs explain the fields and pricing model.
Tool spans use the TOOL type. In Laminar's transcript view, you can read the prompt, assistant responses, and tool calls in sequence, expanding their inputs and outputs. Switch to the tree view to follow subagent nesting.
Trace metadata includes source: "claude-code", the turn number, transcript filename, and operating system. It also includes cwd, git_branch, and claude_code_version when available. The optional skills field stores distinct skills invoked in the turn as a comma-separated string. You can filter this metadata in the traces list and query it in SQL.
Sessions
Turns from the same Claude Code session share a session ID. The sessions view groups their traces, tokens, and recorded costs so you can inspect the work across prompts. The plugin uses the identity from lmnr-cli login when available; set LMNR_USER_ID to override it, for example to distinguish CI activity from a developer's sessions.
Reading a bad turn
Start with the final assistant message to see what the agent believed it had done. Then inspect the tool results that support that claim. If the message says tests passed, find the relevant Bash span and check the captured output. Follow the Edit spans to see which paths and old/new strings the agent supplied.
Check the result itself: the current plugin does not map tool errors to error span statuses, and long results can be truncated.
For delegated work, expand the Agent span and inspect the subagent's calls. The timeline can help locate long stretches of activity, though its durations are reconstructed from transcript timestamps and can include waiting as well as execution.
Claude Code in CI: visibility into what it did on each run
Running Claude Code non-interactively in CI (claude -p "..." in a GitHub Actions job, for example) makes observability especially useful. Nobody watches the terminal, and the local transcript may disappear with the runner. Exported traces give you visibility into what the coding agent did on each run, including its edits, test commands, and subagent activity.
The following GitHub Actions step assumes the repository is checked out, Node.js and Claude Code are installed, and pnpm test can run with the project's dependencies already installed:
- name: Run Claude Code
  env:
    ANTHROPIC_API_KEY: ${{ secrets.ANTHROPIC_API_KEY }}
    LMNR_PROJECT_API_KEY: ${{ secrets.LMNR_PROJECT_API_KEY }}
    LMNR_USER_ID: ci-${{ github.repository }}
    CLAUDE_CODE_SESSIONEND_HOOKS_TIMEOUT_MS: "10000"
  run: |
    claude plugin marketplace add lmnr-ai/lmnr-claude-code-plugin
    claude plugin install lmnr@lmnr --scope user
    claude -p "Investigate the failing tests, make a fix, run pnpm test, and summarize the changes" \
      --allowedTools "Read,Edit,Glob,Grep,Bash(pnpm test*)"
LMNR_USER_ID gives this repository's CI traces a consistent identity for filtering. The plugin also captures working-directory and branch metadata when available. You can then find exported turns, inspect their changes and test output, and compare recorded costs across jobs.
Allow Claude Code and its hooks to finish before tearing down the runner. The example raises the SessionEnd budget to ten seconds on recent Claude Code versions; see the timeout documentation for version-specific behavior. Interrupted jobs or export failures can still leave missing traces.
If an upstream Python or TypeScript orchestrator already uses Laminar tracing, pass its serialized span context through LMNR_SPAN_CONTEXT. Claude Code's turn roots then become children of that span and share the orchestrator's trace. In this mode, one trace can contain multiple turns and other pipeline work, so its total cost and trace count are no longer per-turn measures.
Querying tool calls across sessions
Laminar's SQL editor exposes both traces and spans. Use traces for session totals, turn duration, and whether a tool appears. Use spans when you need individual call counts, timings, arguments, or results.
The examples below assume the plugin's default one-trace-per-turn mode. Time filters bound the scans, and the queries use metadata and numeric fields without reading large input or output columns. Recorded costs are estimates, and trace counts include any duplicate exports.
Cost per Claude Code session
Aggregate the trace-level totals directly. A session may visit several branches, so collect the observed branch names instead of choosing an arbitrary one:
SELECT
    session_id,
    groupUniqArrayIf(
        simpleJSONExtractString(metadata, 'git_branch'),
        notEmpty(simpleJSONExtractString(metadata, 'git_branch'))
    ) AS branches,
    count() AS captured_traces,
    sum(total_cost) AS recorded_cost
FROM traces
WHERE start_time > now() - INTERVAL 30 DAY
  AND simpleJSONExtractString(metadata, 'source') = 'claude-code'
  AND notEmpty(session_id)
GROUP BY session_id
ORDER BY recorded_cost DESC
LIMIT 50
The result covers traces that started within the last 30 days. A session that began earlier may have additional activity outside that window.
Find turns that launched subagents
The span_names column contains the distinct span names in a trace. Use it to find turns containing Agent or the older Task tool without joining the spans table:
SELECT
    id AS trace_id,
    session_id,
    top_span_name,
    duration AS turn_seconds,
    total_cost AS recorded_turn_cost
FROM traces
WHERE start_time > now() - INTERVAL 7 DAY
  AND simpleJSONExtractString(metadata, 'source') = 'claude-code'
  AND (has(span_names, 'Agent') OR has(span_names, 'Task'))
ORDER BY recorded_turn_cost DESC
LIMIT 50
This reports the whole turn's recorded cost. To calculate the subagent's share, you would need to aggregate its LLM spans. To find turns that ran shell commands instead, replace the final condition with has(span_names, 'Bash').
Tool-call frequency and recorded duration
Counting calls requires spans: the distinct names on a trace do not tell you whether Bash ran once or fifty times. The plugin's tool-name attribute scopes this query to its tool spans, even in a shared project:
SELECT
    name,
    count() AS calls,
    quantile(0.5)(toFloat64(duration)) AS p50_recorded_seconds
FROM spans
WHERE start_time > now() - INTERVAL 7 DAY
  AND span_type = 'TOOL'
  AND simpleJSONHas(attributes, 'claude_code.tool.name')
GROUP BY name
ORDER BY calls DESC
LIMIT 50
The median uses durations reconstructed from transcript timestamps. It can help identify tools associated with long waits, but does not isolate execution time. In a project used exclusively for this plugin, the attribute filter can be omitted.
Which turns ran Bash more than fifty times?
Count shell-tool invocations to find turns worth inspecting. This query uses the tool name and plugin attributes, without searching command output:
SELECT
    trace_id,
    count() AS bash_calls
FROM spans
WHERE start_time > now() - INTERVAL 7 DAY
  AND span_type = 'TOOL'
  AND name = 'Bash'
  AND simpleJSONHas(attributes, 'claude_code.tool.name')
GROUP BY trace_id
HAVING count() > 50
ORDER BY bash_calls DESC
LIMIT 50
Open a returned trace to inspect its commands and results. A high call count can help you find repeated work, but does not establish that the turn failed. Calls are counted within the selected time window.
The aggregate queries can also power custom dashboards, turning session costs or tool frequency into charts you can revisit.
Catching bad runs automatically
Reading traces works well for individual runs. For a team's sessions and CI jobs, Signals can check the captured instructions, actions, and final response automatically. Write the behavior to look for in plain language and define the event's output schema. Useful checks for coding agents include:
- The agent reported success, but the captured test output shows failures.
- The agent edited a file outside the directory specified in the request.
- The agent repeated the same shell command more than three times with the same arguments.
- The agent finished without making the requested code change.
Configure a trigger and filters to choose which traces a Signal evaluates, then connect matching events to alert rules for notifications. The failure detection guide covers how to choose and phrase these checks.
What to redact
Claude Code traces can contain source code, prompts, file paths, and shell output. Before sending them to a backend, decide three things.
Which project receives them. Personal exploration and company CI may need different projects, with different access and retention settings. The plugin's configuration and the CI key determine the destination.
Whether prompts leave your network. Native OpenTelemetry keeps prompt content off by default. Transcript-based tracing captures it as part of the turn. For a private deployment, point the plugin at your self-hosted Laminar API with LMNR_BASE_URL or the installer's --base-url option. The self-hosting overview covers deployment.
What to strip. Avoid printing secrets in commands and tool output. CC_LMNR_MAX_CHARS limits captured text length; it does not remove secrets. Laminar's PII redaction redacts span inputs and outputs during backend ingestion, after transmission. Metadata and user IDs are outside that redaction scope, so remove sensitive values upstream when needed.
Claude Code vs the Claude Agent SDK
If you build your own application on the Claude Agent SDK, use Laminar's SDK integration. In Python, Laminar.initialize() auto-instruments the Agent SDK when the package is importable. In TypeScript, initialize Laminar and wrap the original query function with Laminar.wrapClaudeAgentQuery(originalQuery). Both integrations capture agent activity without the Claude Code plugin. The Claude Agent SDK integration docs show the setup in both languages.
Laminar also has integrations for Codex and OpenCode, with setup instructions for each agent.
FAQ
How do I get Claude Code observability and tracing?
Install Laminar's plugin with npx lmnr-cli@latest plugin add claude-code, select a project, and reload the plugin or restart Claude Code in a new terminal. The plugin reconstructs turns from the session transcript and exports them to Laminar. For an existing OpenTelemetry setup, Claude Code also offers native metrics, events, and beta traces.
Our team runs coding agents in CI and we need visibility into what they did on each run. How?
Install the plugin in the job and pass LMNR_PROJECT_API_KEY through your CI secret store. Set LMNR_USER_ID to identify the CI workload, then inspect the exported turns and tool results in Laminar. Allow time for hooks to finish before runner teardown; interrupted jobs and failed exports can leave incomplete telemetry.
Does Claude Code's built-in OpenTelemetry support export traces?
Yes, distributed tracing is available in beta. Enable CLAUDE_CODE_ENABLE_TELEMETRY=1, CLAUDE_CODE_ENHANCED_TELEMETRY_BETA=1, and OTEL_TRACES_EXPORTER=otlp, along with an OTLP endpoint and protocol. Native traces include model calls, tool calls, and nested subagents. Prompt and tool content require separate settings.
How do I see the cost of a Claude Code session?
Open the sessions view for recorded token and cost totals, or group the traces table by session_id with metadata source = 'claude-code'. Treat the figures as estimates based on captured usage and model rates. The cost tracking docs explain input, output, and cache-token pricing.
Can I trace Claude Code against a self-hosted backend?
Yes. Point the plugin at your Laminar API with LMNR_BASE_URL, or pass --base-url and --frontend-url to the installer. Include the API port if your deployment requires one. See the self-hosting overview.
Does this work for Codex, OpenCode, or the Claude Agent SDK?
Laminar has integrations for Codex and OpenCode. For the Claude Agent SDK, Python uses Laminar.initialize() with the SDK installed, and TypeScript also wraps the query function with Laminar.wrapClaudeAgentQuery(). Those SDK integrations do not require the Claude Code plugin.