
LLM tracing records an AI application's model calls and surrounding execution as timed spans, with prompts, outputs, token counts, and cost estimates attached. Agent tracing extends that record to tool calls, subagent handoffs, and sessions.
Consider a support agent that tells a customer their order shipped. Your APM shows three requests, all 200 OK, all under two seconds. The order lookup returned not_found, but the model answered "shipped" anyway. To find that mismatch, you need the tool result and the model's response in the same trace.
This guide compares eight LLM tracing tools using vendor documentation checked on October 6, 2026, plus a tested Laminar example.
What an agent trace has to capture that a backend trace doesn't
Backend traces expose latency and service failures. Agent traces also need to preserve the evidence behind an answer. Six capabilities matter:
- Tool calls with arguments and results. A successful HTTP request can return not_found. Recording only its status hides what the model received.
- Subagent hierarchy. Each subagent's input and output should stay attached to the call that spawned it.
- Long-running sessions. A conversation or resumed task can span several traces. Session grouping connects those runs; live tracing lets you inspect one before it finishes.
- Token usage and cost per span. A run can mix models across many calls. Price each model call before calculating trace and session totals.
- Non-text actions. A text trace of click(#submit) cannot show that a cookie banner covered the button. Browser agents need visual context.
- Queries across traces. Finding every run that received the same bad tool result requires searchable span data.
Our agent observability guide covers these execution-level requirements.
OpenTelemetry provides a shared span model, but OTLP acceptance alone does not guarantee equivalent traces. Backends differ in transports, attribute mappings, and which spans they retain. See the OpenTelemetry for AI agents guide for instrumentation details.
How we compared the LLM tracing tools
The comparison uses vendor docs, pricing pages, and license files checked on 2026-10-06. "Not documented" means those sources were silent, not that a feature is absent.
We checked OTLP transports, framework integrations, agent reading views, automatic cost calculation, trace queries, and self-hosting terms. Laminar publishes this guide; the numbered order does not represent benchmark scores. The executable example was tested on Laminar Cloud only. The competitor comparison is documentation-based.
The best agent tracing tools at a glance
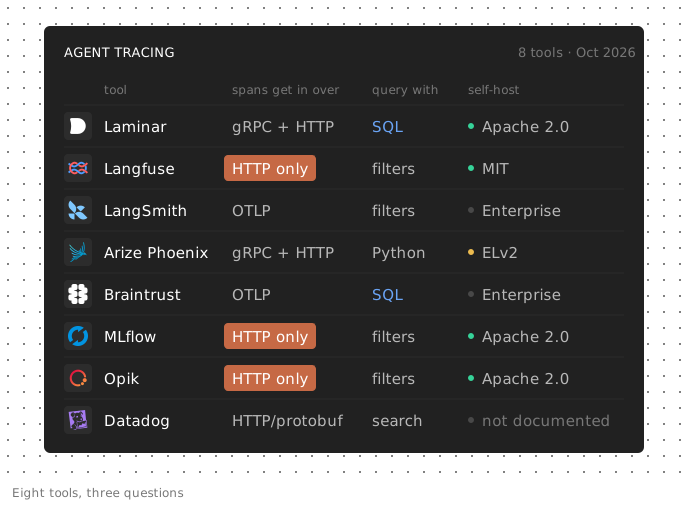
| Tool | OTLP ingest | Agent reading view | Cost per span | Query traces with | Self-host / license |
|---|---|---|---|---|---|
| Laminar | gRPC, HTTP/proto, HTTP/json | Transcript view (default), browser session replay | Automatic, rolls up to trace and session | SQL (UI, API, CLI, MCP) | Yes, Apache 2.0 |
| Langfuse | HTTP only | Agent Graphs, Sessions | Automatic on generation/embedding observations | field:value filters, API | Yes, MIT (EE folders excluded) |
| LangSmith | Yes (OTel endpoint) | Threads: Trajectory, Turns, Details | Automatic, rolls up to trace and project | Filter query language, API | Enterprise add-on only |
| Arize Phoenix | HTTP and gRPC | Sessions | Automatic | Python filter expressions, SpanQuery | Yes, Elastic License 2.0 |
| Braintrust | Yes (OTel endpoint) | Spans, Thread, Timeline, Debugger, custom views | Automatic per span | SQL (/btql, bt sql) | Enterprise only (data plane) |
| MLflow Tracing | HTTP only (3.6+) | Span tree and timeline | Automatic (3.10+, [genai] extra) | SQL-like filter DSL | Yes, Apache 2.0 |
| Opik | HTTP only | Threads, Agent Graph | Automatic for listed providers | Opik Query Language | Yes, Apache 2.0 |
| Datadog LLM Observability | HTTP/protobuf (agentless) | Execution Graph, flame graph | Automatic, summed per trace | Trace Explorer search, Export API | Self-hosting not documented |
Framework support also needs a closer check. An integration for one language does not establish support for another, and a framework-specific graph may require configuration.
1. Laminar
Laminar is an Apache 2.0, OpenTelemetry-native observability platform for AI agents. The tracing docs cover instrumentation setup.
The default transcript view displays the agent's input, LLM turns, and tool calls with arguments and results. Subagents appear as collapsed cards with an input prompt, output preview, and token and cost badges. Tree view and timeline are also available.
Live tracing fills in a trace while the agent is still running. Spans appear as they finish, so you can debug a long-running workflow without waiting for the root span to end.
For browser agents, Laminar records the browser session and syncs it with spans. Scrubbing the recording moves the timeline, placing a failed click beside the frame that explains it. The session replay docs list Browser Use, Stagehand, Playwright, Puppeteer, and Skyvern integrations.
LLM cost tracking runs server-side for each LLM span, including cache read/write and reasoning tokens. Totals roll up to traces and sessions.
The SQL editor supports SELECT queries over spans and traces through the UI, API (POST /v1/sql/query), CLI, and MCP.
Signals evaluate finished traces against a prompt and JSON schema, producing structured events for clustering and Slack alerts.
Limits. Signals, clustering, and alerts require Cloud or Helm with an enterprise license. The self-hosting overview explains deployment options. OTel support covers traces and limited log ingestion, not metrics.
Best for: long-running or browser agents where transcript reading, replay, and SQL are priorities.
2. Langfuse
Langfuse combines tracing, prompt management, and evals. It accepts OTLP at /api/public/otel over HTTP using JSON or protobuf. gRPC is not supported yet. It aims to follow OTel GenAI conventions and reads OpenInference attributes.
Agent Graphs infer workflow structure from observation types, timing, and nesting. Sessions group traces into a multi-turn replay.
Langfuse calculates cost from model prices when you do not supply it, but only generation and embedding observations carry cost. Queries use field:value filters, the public API, or SDKs; SQL is not documented.
The repository uses MIT licensing outside its ee/ directories. Check those exclusions against the features you need to self-host.
Best for: teams that want prompt management and tracing together under a mostly MIT-licensed codebase.
3. LangSmith
LangSmith is LangChain's tracing and evaluation platform. Its /otel endpoint accepts OTLP and maps GenAI, OpenInference, Traceloop, and Logfire attributes.
Threads offer three reading modes: Trajectory displays turns and tool calls as chat, Turns shows a card per turn, and Details supports run-level inspection. Tokens and model-priced costs appear per run and roll up to trace and project.
Queries use comparator functions such as eq, has, and search, plus the list_runs SDK method. Bulk Parquet export is Enterprise-only for customers who signed up after August 3, 2026. Earlier customers keep it on Plus or Enterprise until February 1, 2027.
Self-hosting requires an Enterprise add-on and a license key from sales.
Best for: LangChain or LangGraph teams comfortable with proprietary hosting terms.
4. Arize Phoenix
Phoenix is Arize's source-available tracing and evaluation tool. It accepts OTLP over HTTP at /v1/traces and over gRPC. OpenInference is its native format; GenAI spans are accepted, with reduced support for some UI features.
Sessions provide a chat-style view of multi-turn conversations. An agent graph is not documented. Cost comes from a built-in pricing table and appears per span, trace, session, and project.
Queries use Python boolean expressions compiled into database queries. You can use them in the UI filter bar and through SpanQuery for pandas exports.
Phoenix is free to self-host under Elastic License 2.0. That is a source-available license with restrictions on offering the software as a hosted service.
Best for: Python-heavy teams using OpenInference that can accept ELv2 terms.
5. Braintrust
Braintrust combines evaluations with tracing. It accepts OTLP at https://api.braintrust.dev/otel/v1/traces and implements GenAI semantic conventions.
The trace tab offers Spans, Thread, Timeline, and Debugger layouts, plus custom views generated from a description. Thread puts messages, tool calls, and scores in order. Cost is estimated per span from token counts and a model registry.
Braintrust documents SQL over traces through /btql and the bt sql CLI. That distinguishes its query interface from the filter languages used by several tools here.
Self-hosting is Enterprise-only and covers the data plane. Braintrust still hosts the control plane.
Best for: teams whose tracing workflow feeds an evaluation loop and who need SQL queries.
6. MLflow Tracing
MLflow Tracing is part of the Apache 2.0 MLflow platform. Version 3.6.0 added OTLP over HTTP at /v1/traces, using an experiment ID header. gRPC is not supported yet. It reads GenAI conventions and translates OpenInference attributes.
The UI provides a span tree and timeline. Sessions are metadata you can filter and group by; a dedicated session view is not documented.
Cost estimation arrived in 3.10.0, uses LiteLLM's pricing table, and requires the [genai] extra on the server.
search_traces() accepts a SQL-like filter DSL and returns a pandas DataFrame. It supports notebook workflows but does not expose SQL over a spans table.
Best for: teams already operating MLflow that want agent traces in the same server.
7. Opik
Opik, from Comet, is an Apache 2.0 tracing and evaluation platform. It accepts OTLP over HTTP at /api/v1/private/otel, without gRPC support. Its OTel documentation describes Opik-specific attributes rather than GenAI conventions.
Threads group conversations. Agent Graph renders automatically for Google ADK, uses a graph parameter for LangGraph, and requires an attached Mermaid diagram otherwise.
Cost is calculated for listed providers, including OpenAI, Anthropic, Google, Bedrock, and Groq. Unsupported models have empty cost fields.
Opik Query Language combines conditions with AND only. Self-hosted Opik lacks user management, which matters for shared production deployments.
Best for: teams that can work within those query and access-control limits, or start with the free cloud tier of 25k spans per month.
8. Datadog LLM Observability
Datadog's tracing product, now called Agent Observability in its docs, sits alongside APM. Its agentless endpoint accepts OTLP over HTTP/protobuf using GenAI conventions 1.37+ or OpenInference.
The docs warn that spans without a gen_ai.* attribute are dropped. Verify attribute mapping before assuming an existing exporter will preserve every agent step. Framework integrations are Python-only except for the Vercel AI SDK on Node.js.
The Execution Graph shows agents and their connections within a trace; a flame graph provides timing detail. session_id groups traces. Per-LLM-span cost estimates are summed at trace level.
Queries use Trace Explorer syntax such as @key:value and Boolean operators, plus a span Export API. SQL and self-hosting are not documented. Billing is per LLM span ingested.
Best for: existing Datadog APM users who want agent and service traces together.
Which LLM tracing tools track token usage and cost per span
All eight document automatic cost calculation, but a model name and token counts are not sufficient in every configuration. Check these limits:
- Priced observations. Langfuse prices generation and embedding observations. Opik limits coverage to listed providers. MLflow requires 3.10+ and the [genai] server extra.
- Rollups. Laminar, LangSmith, Phoenix, Opik, and Datadog document span-to-trace totals. Laminar and Phoenix also total costs by session. Braintrust's cost docs describe SQL aggregation rather than an automatic trace total.
- Token categories. Laminar's cost tracking handles cache reads, cache writes, and reasoning tokens, including Anthropic's 5-minute and 1-hour cache tiers. It also accounts for long-context and service-tier pricing.
These are estimates based on recorded usage and pricing rules. Compare them with provider billing before using them for customer charges.
For spend by customer or feature, verify that queries can group by your metadata. Laminar and Braintrust support SQL GROUP BY. The AI token cost guide covers attribution, and our AI agent cost tracking tools comparison covers the tooling in more depth.
Tracing a tool-calling agent: a tested example
This example was tested on 2026-10-06 with lmnr 0.7.64 and gpt-5-mini on Laminar Cloud. Its tool stub returns shipped; it does not reproduce the illustrative not_found error from the opening.
import json
from lmnr import Laminar, observe
from openai import OpenAI

Laminar.initialize()  # reads LMNR_PROJECT_API_KEY; instruments the OpenAI client
client = OpenAI()

TOOLS = [{
    "type": "function",
    "function": {
        "name": "get_order_status",
        "description": "Look up an order by id",
        "parameters": {
            "type": "object",
            "properties": {"order_id": {"type": "string"}},
            "required": ["order_id"],
        },
    },
}]

@observe(name="get_order_status", span_type="TOOL")
def get_order_status(order_id: str) -> dict:
    return {"order_id": order_id, "status": "shipped", "eta": "2026-10-09"}

@observe(name="support-agent")
def run_agent(question: str, session_id: str) -> str:
    Laminar.set_trace_session_id(session_id)
    messages = [{"role": "user", "content": question}]
    while True:
        response = client.chat.completions.create(
            model="gpt-5-mini", messages=messages, tools=TOOLS
        )
        message = response.choices[0].message
        if not message.tool_calls:
            return message.content
        messages.append(message)
        for call in message.tool_calls:
            result = get_order_status(**json.loads(call.function.arguments))
            messages.append({
                "role": "tool",
                "tool_call_id": call.id,
                "content": json.dumps(result),
            })

print(run_agent("Where is order A-1042?", session_id="demo-session-1"))
Laminar.flush()
Laminar.initialize() instruments the OpenAI client. @observe creates the root span and captures the tool's arguments and return value.
The test produced one trace with four spans. The SQL API returned:
SELECT name, span_type, input_tokens, output_tokens, total_cost
FROM spans
WHERE trace_id = '<trace id>'
  AND start_time > now() - INTERVAL 1 DAY
ORDER BY start_time
| name | span_type | input_tokens | output_tokens | total_cost |
|---|---|---|---|---|
| support-agent | DEFAULT | 0 | 0 | 0 |
| openai.chat | LLM | 135 | 92 | 0.00021775 |
| get_order_status | TOOL | 0 | 0 | 0 |
| openai.chat | LLM | 197 | 315 | 0.00067925 |
The corresponding traces row carried session demo-session-1, 332 input tokens, 407 output tokens, and total_cost of 0.000897, exactly the sum of the two LLM spans.
For production, add an iteration limit and explicit timeout handling. Those behaviors are outside this test.
How to choose an agent tracing tool for production
For long-running or multi-agent runs, inspect a representative trace first. Check whether you can follow tool results and subagent handoffs without opening every span. Verify live updates separately: open a trace mid-run and confirm spans arrive before the root span closes. Laminar's trace view docs describe its transcript and alternate views.
For browser agents, test replay against a failed action. Confirm that the recording and spans stay aligned. Laminar documents this for Browser Use, Stagehand, Puppeteer, Playwright, and Skyvern.
For OpenTelemetry portability, check transport and attributes. Langfuse, MLflow, and Opik accept HTTP only. A gRPC pipeline needs an HTTP exporter at that boundary. Laminar accepts gRPC, HTTP/protobuf, and HTTP/JSON at /v1/traces; see its OpenTelemetry docs.
For self-hosting, check license and feature availability separately. Laminar, MLflow, and Opik are Apache 2.0. Langfuse excludes enterprise directories from MIT licensing. Phoenix uses ELv2. LangSmith self-hosts only as an Enterprise add-on. Braintrust self-hosts only the data plane, on Enterprise plans.
For cross-run debugging, try the actual query you need. Searching for failures is different from grouping a particular tool result by customer over a week. Confirm whether filters can express it or whether you need SQL. For broader platform requirements, see the agent observability platforms roundup.
FAQ
What are the best agent tracing tools for production AI systems?
The tools most often compared are Laminar, Langfuse, LangSmith, Arize Phoenix, Braintrust, MLflow Tracing, Opik, and Datadog LLM Observability. Choose against a representative production run. Verify that the trace captures tool results and subagent handoffs, then test cost coverage and cross-run queries. Deployment terms and data export limits can rule out an otherwise suitable tool.
Which tools can trace AI agent execution flow?
Look for instrumentation that records model calls and tool results with correct parent-child relationships. Subagent spans must remain connected to their caller. Then check whether the reading view makes that structure understandable across retries and conversation turns.
Which LLM tracing tools track token usage and cost?
All eight compared here document automatic cost calculation, subject to model coverage and configuration. Verify input/output token capture first, then check cache and reasoning-token pricing. An empty cost field should not be treated as zero spend.
What is the difference between LLM tracing and agent tracing?
LLM tracing often focuses on model requests and responses. Agent tracing extends that record to tool execution, subagent handoffs, and sessions. Browser agents may also need replay to explain actions that text spans cannot show.
Can I trace agents with OpenTelemetry instead of a vendor SDK?
Yes, when the backend accepts your OTLP transport and understands your attributes. Check semantic-convention mappings and span-retention rules. Successful export does not guarantee that every tool span appears or that token counts populate correctly.
Is there an open-source LLM tracing tool I can self-host?
Yes. Check both the license and what the self-hosted distribution includes. Apache 2.0 and MIT differ from source-available licenses such as ELv2. Also verify user management and whether required features need an enterprise license.