
The OpenAI Agents SDK ships with tracing enabled by default in server-side applications. Model calls, tool calls, handoffs, and guardrails are recorded as spans you can inspect in the OpenAI Traces dashboard. That makes it straightforward to follow an individual run: which agent handled the request, which tools it called, and where execution failed.
Production monitoring adds questions across runs. How often does the triage agent skip a handoff? Which customers account for the most spend? Which tools fail repeatedly? OpenAI Agents SDK tracing supports external trace processors, so you can send those records to an observability backend for SQL analysis, customer-level cost tracking, and failure detection.
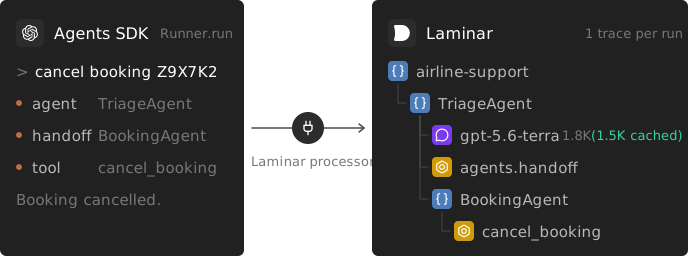
This guide explains how OpenAI Agents SDK tracing works, what the built-in trace contains, how trace processors export it, what a handoff and a sub-agent look like in an exported trace, and how to answer production questions once the traces land in an OpenTelemetry backend. Laminar is the worked example for the export side, in Python and TypeScript.
What the built-in tracing records
A trace in the Agents SDK is a tree of spans for a workflow. A Runner.run creates a trace when there is no active one; a surrounding trace() context can group multiple runs. Common span types include:
| Span | Created by | Carries |
|---|---|---|
| Task span | Each runner invocation in current SDK versions | Run boundary and usage |
| Agent span | Each agent that takes control | Agent name, tools, handoffs, output type |
| Turn span | Each model-loop turn in current SDK versions | Turn number, agent, usage |
| Generation or response span | A model call, depending on the model adapter | Model, recorded input and output, token usage when available |
| Function span | Each tool invocation | Tool name, arguments, return value |
| Handoff span | Each transfer to another agent | Source and destination agent |
| Guardrail span | Each input or output guardrail | Guardrail name, whether it tripped |
| Custom span | Your code, via custom_span() | Whatever you attach |
Traces have a workflow name (defaults to "Agent workflow"), an optional group_id you can set to link the traces of a multi-turn conversation, and optional metadata. In Python, configure them with RunConfig(workflow_name=..., group_id=..., trace_metadata=...) or trace(workflow_name=..., group_id=..., metadata=...). Task and turn spans depend on the SDK version and tracing configuration.
Two things about the defaults to know before you rely on them. First, the SDK records model and tool inputs and outputs by default. Set trace_include_sensitive_data=False in RunConfig to omit that content from its model and function spans. External integrations and application spans have their own capture behavior, covered in the privacy FAQ below. Second, tracing exports to OpenAI by default. To turn SDK tracing off entirely, set OPENAI_AGENTS_DISABLE_TRACING=1 or call set_tracing_disabled(True). To keep tracing on and change its destination, configure the trace processors instead.
How trace processors work
The SDK keeps a TraceProvider that creates traces and spans, and a list of processors that receive lifecycle events: trace started, span started, span ended, trace ended. The default processor batches spans and ships them to OpenAI. You can register your own alongside it or in place of it:
from agents import add_trace_processor, set_trace_processors

add_trace_processor(my_processor)     # keep OpenAI export, also send to mine
set_trace_processors([my_processor])  # replace the default entirely
The TypeScript SDK exposes the same pair as addTraceProcessor and setTraceProcessors.
A Python processor implements on_trace_start, on_trace_end, on_span_start, on_span_end, shutdown, and force_flush. That small interface supports external integrations such as Weights & Biases, Arize Phoenix, MLflow, Braintrust, LangSmith, Langfuse, Datadog, AgentOps, Opik, PromptLayer, Galileo, HoneyHive, and Laminar. Their setup and supported features vary by integration and language.
This design lets you add an observability backend without rewriting the agent loop. With Laminar, install the SDK and initialize it before the first Runner.run; it registers the processor for you.
Exporting to an OpenTelemetry backend
Laminar's processor converts SDK spans into OpenTelemetry spans and connects them to the surrounding application trace. It adds the attributes the Laminar UI reads, including span type, recorded input and output, model, and token usage, and exports over OTLP. It registers with add_trace_processor, so the OpenAI Traces dashboard keeps working alongside Laminar.
Python
Requires lmnr 0.7.49 or later and openai-agents 0.7.0 or later:
pip install -U lmnr openai-agents
export LMNR_PROJECT_API_KEY=your-laminar-project-api-key
export OPENAI_API_KEY=your-openai-api-key
import asyncio

from agents import Agent, Runner
from lmnr import Laminar, observe

Laminar.initialize()


@observe(name="math-homework")
async def main():
    agent = Agent(
        name="MathHelper",
        instructions="You are a patient math tutor. Explain each step clearly.",
    )
    result = await Runner.run(agent, "A train leaves Boston at 9am at 60 mph...")
    print(result.final_output)


if __name__ == "__main__":
    asyncio.run(main())
Laminar.initialize() detects that agents is installed and registers the processor. The @observe decorator is optional; it gives the trace a root span with a name of your choosing, and it is the natural place to attach a session id or user id, covered below.
The examples use the SDK's default model. Set the agent's model explicitly to pin a model available to your application.
For Laminar-only export, clear the SDK's existing processors before the first Laminar initialization:
from agents import set_trace_processors
from lmnr import Laminar

set_trace_processors([])
Laminar.initialize()
This removes all previously registered SDK trace processors, including OpenAI's default exporter, then lets Laminar register its own. Keep SDK tracing enabled. Clearing the processors after initialization would remove Laminar too.
TypeScript
Requires @lmnr-ai/lmnr 0.8.21 or later. The example passes the Agents SDK module explicitly so it also works in an ESM project:
npm install @lmnr-ai/lmnr@latest @openai/agents@latest
import * as agents from '@openai/agents';
import { Laminar, observe } from '@lmnr-ai/lmnr';

Laminar.initialize({ instrumentModules: { openAIAgents: agents } });

await observe({ name: 'math-homework' }, async () => {
  const agent = new agents.Agent({
    name: 'MathHelper',
    instructions: 'You are a patient math tutor. Explain each step clearly.',
  });
  const result = await agents.run(agent, 'A train leaves Boston at 9am at 60 mph...');
  console.log(result.finalOutput);
});
In ESM, passing instrumentModules lets Laminar instrument the already-imported module. The OpenAI Agents SDK integration docs cover the version requirements and module-loading options.
What the exported trace looks like
With task and turn spans enabled, the single-agent example has the following structure. The model name shown in a trace depends on the model used for that run:
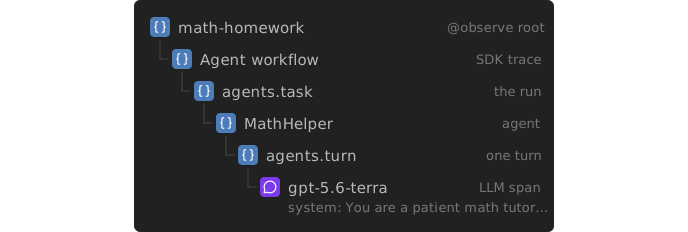
One detail that is easy to miss: agent instructions can be supplied separately from the model's message list. For the built-in OpenAI model adapters, Laminar captures those instructions and prepends them as a system message in the LLM span's input. That puts the instructions alongside the recorded messages when you debug a prompt, without having to look up the agent definition separately.
The default view in Laminar is the transcript view, which reads the run as a conversation: user input, each model response, each tool call and result, in order. For an agent run that is usually what you want. The tree view is a click away for the nesting.
Tracing handoffs between agents
Handoffs are the Agents SDK's mechanism for transferring control in multi-agent systems: an agent's tool list includes transfer_to_<agent> tools, and when the model calls one, the destination agent takes over. That agent can answer, call tools, or hand off again. The SDK records the transfer as a handoff span.
A triage-plus-specialist example, using mock booking tools that return fixed responses:
import asyncio

from agents import Agent, Runner, function_tool, handoff
from lmnr import Laminar, observe

Laminar.initialize()


@function_tool
def cancel_booking(confirmation_code: str) -> str:
    return f"Booking {confirmation_code} cancelled. Refund in 5-7 business days."


@function_tool
def lookup_loyalty_balance(member_id: str) -> str:
    return f"Member {member_id}: 48,200 points, Gold tier."


booking_agent = Agent(
    name="BookingAgent",
    handoff_description="Handles cancellations and loyalty balance lookups.",
    instructions=(
        "You handle cancellations and loyalty questions. Use cancel_booking for "
        "cancellations and lookup_loyalty_balance for points and tier."
    ),
    tools=[cancel_booking, lookup_loyalty_balance],
)

triage_agent = Agent(
    name="TriageAgent",
    instructions=(
        "Route the user to the correct specialist. For cancellations or loyalty, "
        "hand off to BookingAgent. Do not answer specialist topics yourself."
    ),
    handoffs=[handoff(booking_agent)],
)


@observe(name="airline-support")
async def main():
    result = await Runner.run(
        triage_agent,
        "Cancel my booking Z9X7K2 and look up loyalty for member M-88421.",
    )
    print(result.final_output)


if __name__ == "__main__":
    asyncio.run(main())
An illustrative exported tree, with task and turn spans enabled:
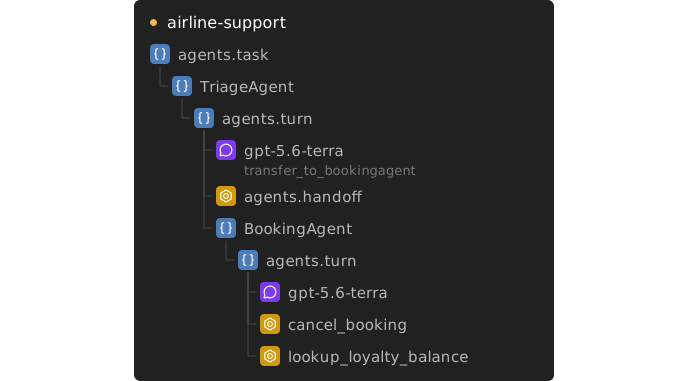
The handoff span records the transfer from TriageAgent to BookingAgent. In this illustration, BookingAgent appears alongside the handoff under the routing turn, reflecting how Laminar connects the destination to the handoff's parent context. Exact tree nesting can vary with SDK and integration versions; the handoff event and subsequent transcript show which agent took control.
For debugging, follow which agent produced the final answer, particularly when a router answers a question it was told to hand off. Then inspect the model call that made the routing decision, its recorded input, and the available handoff definitions. This helps distinguish unclear instructions or descriptions from tool failures and other routing problems. Exporting the traces also lets you measure how often the pattern occurs across runs.
Tracing agents used as tools
The second multi-agent pattern in the SDK is Agent.as_tool(): a sub-agent is exposed to the parent as a function tool, the parent calls it, the sub-agent runs to completion, and its final output is returned as the tool result. Unlike a handoff, control returns to the parent.
With flight_agent and summary_agent already defined, add them to the concierge's tools:
concierge = Agent(
    name="Concierge",
    instructions=(
        "You are a travel concierge. Call book_flight to look up flights, "
        "then call write_summary to draft a one-paragraph itinerary."
    ),
    tools=[
        flight_agent.as_tool(
            tool_name="book_flight",
            tool_description="Search for flights between two cities.",
        ),
        summary_agent.as_tool(
            tool_name="write_summary",
            tool_description="Write a one-paragraph summary of an itinerary.",
        ),
    ],
)
In the exported trace, each sub-agent's full run nests under the parent's tool-call span:
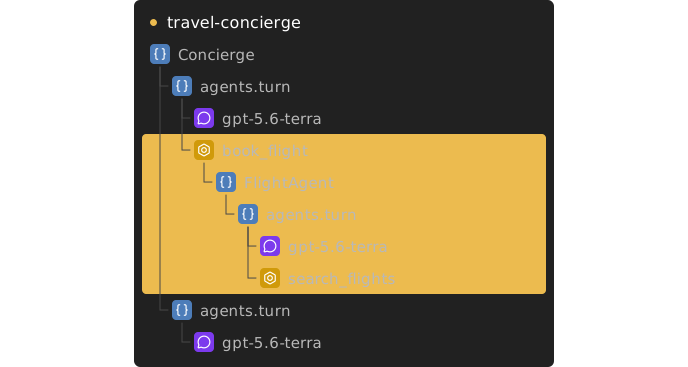
This is the shape you want for cost attribution. In the tree view, FlightAgent's tokens and cost roll up under book_flight. In SQL, sum the LLM spans whose ancestry includes that tool; the tool span's own total_cost is not the subtree total displayed in the UI. The TypeScript SDK's asTool() produces the same nesting.
Sessions, users, and metadata
The SDK's group_id links traces from one conversation, and the OpenAI dashboard uses it to filter. In an OpenTelemetry backend you want the same grouping plus a user id and whatever dimensions you bill or debug by. Set them inside the @observe root:
from agents import RunConfig, Runner
from lmnr import Laminar, observe


@observe(name="airline-support")
async def handle_turn(message: str, conversation_id: str, user_id: str) -> str:
    Laminar.set_trace_session_id(conversation_id)
    Laminar.set_trace_user_id(user_id)
    Laminar.set_trace_metadata({"plan": "pro", "region": "eu"})
    result = await Runner.run(
        triage_agent,
        message,
        run_config=RunConfig(group_id=conversation_id),
    )
    return result.final_output
Use the same value for the SDK's group_id and Laminar's session id and the two views line up. The sessions view then shows the conversation as numbered traces with total cost, tokens, and duration, which is the unit a support engineer looks at when a customer says "the bot got confused halfway through".
Querying exported traces
Laminar's SQL editor exposes both traces and spans. traces has one row per trace, with total cost, tokens, duration, user id, session id, metadata, and the distinct span names seen during the run. Use it for questions about whole runs. spans has one row per operation, so use it for individual model calls, tool errors, and turn counts.
These queries use the airline-support root from the examples to keep the results scoped to that workflow. If your application adds another outer span, adjust the root name and path prefix accordingly. Time filters bound the data being scanned; LIMIT bounds the returned rows.
How often does a run containing TriageAgent finish without a recorded handoff?
SELECT
  count() AS runs,
  countIf(has(span_names, 'agents.handoff')) AS runs_with_handoff,
  countIf(NOT has(span_names, 'agents.handoff')) AS runs_without_handoff
FROM traces
WHERE start_time > now() - INTERVAL 7 DAY
  AND top_span_name = 'airline-support'
  AND has(span_names, 'TriageAgent')
  AND status = 'success'
Each trace counts once, even if it contains several handoffs. Here status = 'success' means no span recorded an error; inspect the transcript to establish whether the task succeeded and TriageAgent should have handed off. span_names records presence anywhere in the trace, not which agent made a handoff, its order, or how many times it occurred.
Which users account for the most spend? This uses the user id set at the entry point above:
SELECT user_id, count() AS runs, sum(total_cost) AS cost
FROM traces
WHERE start_time > now() - INTERVAL 30 DAY
  AND top_span_name = 'airline-support'
  AND user_id != ''
GROUP BY user_id
ORDER BY cost DESC
LIMIT 50
The trace total already includes all of its LLM calls, including specialists invoked through handoffs or tools. Group by session_id for conversation cost, or extract a customer key from metadata if a customer has several users.
Which tools fail, and how often?
SELECT name, countIf(status = 'error') AS errors, count() AS calls
FROM spans
WHERE span_type = 'TOOL'
  AND start_time > now() - INTERVAL 7 DAY
  AND startsWith(path, 'airline-support.')
GROUP BY name
ORDER BY errors DESC
LIMIT 50
This counts tool spans marked as errors by the SDK and integration. A tool that returns an error message without recording an error status will not be counted as a failure here.
Cost per agent in the TriageAgent / BookingAgent example, so you know whether the specialist or the router is the expensive one. The dedicated path column contains span names joined by dots. For these agent names, select the last matching agent without reading the larger attributes JSON:
SELECT
  arrayLast(
    span_name -> span_name IN ('TriageAgent', 'BookingAgent'),
    splitByChar('.', path)
  ) AS agent,
  sum(total_cost) AS cost,
  count() AS llm_calls
FROM spans
WHERE span_type = 'LLM'
  AND start_time > now() - INTERVAL 30 DAY
  AND startsWith(path, 'airline-support.')
GROUP BY agent
ORDER BY cost DESC
This counts each model call once without joining parent spans or assuming a fixed number of levels between the agent and the model. Use the complete set of agent names for your workflow; for the tool example, change the root prefix and include Concierge and every specialist. Names should uniquely identify agents within the workflow. Taking the last match attributes a nested specialist's calls to that specialist. An empty agent group means the path contained none of the listed names. These are each agent's own model costs; the parent's inclusive cost in the tree view also includes its sub-agents.
The agent names being matched must not contain dots. If yours do, use the original path array, JSONExtract(attributes, 'lmnr.span.path', 'Array(String)'), in place of splitByChar('.', path) to preserve name boundaries.
Runs that took more than five model-loop turns, which are worth checking for repeated tool calls or handoffs:
SELECT trace_id, count() AS turns
FROM spans
WHERE name = 'agents.turn'
  AND start_time > now() - INTERVAL 7 DAY
  AND startsWith(path, 'airline-support.')
GROUP BY trace_id
HAVING turns > 5
ORDER BY turns DESC
LIMIT 100
This counts model-loop turns across the agents in the trace, rather than user messages in a conversation. It requires an SDK version and tracing configuration that emit agents.turn spans. It needs spans because the trace's distinct span_names list cannot count repeated turns. More than five turns is an investigation threshold, not proof of a loop.
When the model reports cached-input usage, the OpenAI Agents integration records cache-read tokens so Laminar can apply cached-input pricing. This matters for repeated instructions and shared prompt prefixes. Cost attribution depends on the reported usage and available model pricing; the cost tracking docs explain the columns.
Catching failures without reading traces
The queries above are how you investigate. For detection, Signals pair a plain-language definition with a structured output schema: for example, "the triage agent answered a cancellation request itself instead of handing off" or "a tool returned an error and the agent told the user the task was done."
Configure a trigger, filters, and optional sampling to choose which traces are evaluated. A new Signal defaults to evaluating completed traces with more than 1,000 tokens; adjust that filter if shorter runs matter. Findings become signal events, and alert rules determine which events notify you. For an agent system with handoffs, the first definitions are usually about routing: the wrong specialist, no specialist, or a ping-pong between two agents. The failure detection article covers how to choose them.
Guardrails and errors in the trace
Input and output guardrails run as their own spans, recording the guardrail's name and whether it tripped. Input guardrails run concurrently with the agent by default, so a model call or tool execution may already have occurred when one trips. Use run_in_parallel=False when the input guardrail must finish before the agent starts.
Tool exceptions can mark function spans as errored. When the tool's error handler returns an error message to the model, inspect the next model call to see how the agent responded; other error-handling configurations can stop the run instead. Error filters and the tool-failure query above help you find these cases. For notifications, configure Signal alerts; a saved filter alone does not send an alert.
Sandboxed agents
The Python SDK can run agents inside sandboxes (SandboxAgent with a SandboxRunConfig and a client such as the local Unix client or E2B), where the model gets a filesystem and a shell. Laminar's Python sandbox examples show sandbox.start and sandbox.cleanup spans around the agent's work, plus shell and file operations with recorded inputs and outputs.
The TypeScript SDK also supports sandboxed agents through @openai/agents/sandbox; see OpenAI's sandbox documentation. The Laminar sandbox examples described here use Python; emitted spans depend on the SDK, provider, and integration versions.
Choosing where to send Agents SDK traces
The processors listed in the SDK docs cover several overlapping use cases. The choice is mostly about what else you need the backend to do.
APM vendors (Datadog) bring agent observability into a broader monitoring stack. They are worth considering if the agent is one service among many you already monitor there. Compare the current LLM observability features and pricing for your workload.
LLM evaluation platforms (Braintrust, LangSmith, Arize, Galileo, HoneyHive, Opik, MLflow, W&B) log Agents SDK runs as traces and pair them with datasets and scoring. Good if evals are the main workflow and tracing is the input to them.
Agent observability platforms (Laminar, Langfuse) make agent traces central to reading runs, analyzing behavior, and tracking costs. Laminar provides a transcript view, SQL over traces and spans, Signals, and an open-source deployment via Helm chart for storing telemetry in your own infrastructure. Export destinations and model API calls are configured separately. The agent observability guide covers what to look for, and the top agent observability platforms roundup compares the field.
The processor interface lets you register multiple destinations while you compare them. Changing backends still means checking their setup, data mapping, and supported features.
FAQ
Which platforms support OpenAI Agents SDK tracing?
The SDK docs list external tracing integrations for Weights & Biases, Arize Phoenix, MLflow, Braintrust, LangSmith, Langfuse, Datadog, AgentOps, Opik, PromptLayer, Galileo, HoneyHive, and Laminar, in addition to the default OpenAI Traces dashboard. Integrations use the processor interface, with setup and language support varying by vendor. Laminar registers its processor through Laminar.initialize(); TypeScript ESM projects pass the module through instrumentModules. See the integration docs.
How do I export OpenAI Agents SDK traces to my own backend?
Register a trace processor before the first Runner.run. If your backend speaks OpenTelemetry, use an integration that converts Agents SDK spans to OTel spans. Laminar initializes that integration and exports over OTLP to Laminar cloud or a configured self-hosted instance. To replace OpenAI export, configure the processor list as shown above: in Python, clear it before Laminar's first initialization. Keep SDK tracing enabled; OPENAI_AGENTS_DISABLE_TRACING=1 also stops the SDK traces and spans that external processors consume. Details are in the OpenTelemetry docs.
How do I trace handoffs between agents?
Handoffs are recorded as agents.handoff spans when the model invokes a handoff tool, normally named transfer_to_<agent>. Follow the transfer and the destination agent's work in the transcript and tree views; exact nesting depends on the SDK and integration versions. To have a specialist return its result to the calling agent, expose it with Agent.as_tool(); the sub-agent's run nests under the parent's tool-call span.
Does OpenAI Agents SDK tracing include prompts and tool outputs?
Yes, by default. Model spans record inputs and outputs, and function spans record tool arguments and return values. Set trace_include_sensitive_data=False in RunConfig to omit that content from those SDK spans. OPENAI_AGENTS_DONT_LOG_MODEL_DATA and OPENAI_AGENTS_DONT_LOG_TOOL_DATA control debug logging, not trace capture.
That SDK setting does not cover all content captured by external instrumentation. Laminar captures agent instructions separately, and @observe can capture application arguments and return values, so review those paths before relying on complete prompt redaction. Self-hosting controls where Laminar stores traces; it does not automatically disable other exporters or change where model requests are sent. See the self-hosting overview.
Does the TypeScript Agents SDK support the same tracing?
Yes. In server-side applications, @openai/agents provides built-in tracing, addTraceProcessor and setTraceProcessors, handoffs, and asTool(). Laminar's TypeScript SDK (@lmnr-ai/lmnr 0.8.21 or later) instruments it with Laminar.initialize(); ESM projects pass the module through instrumentModules. The TypeScript SDK also supports sandboxed agents, although the Laminar sandbox examples in this guide use Python.
How do I track cost per agent or per customer?
Laminar calculates LLM costs from reported token usage and model pricing, including cached-input pricing when available. For per-agent cost, sum LLM spans using the agent names in their span paths, as shown above. For per-user, per-session, or per-customer cost, query traces and group its total_cost by user_id, session_id, or a customer key in metadata. Set those identifiers at the entry point. The AI token cost article covers attribution patterns in depth.