
Overview
Laminar is an open-source, OpenTelemetry-native observability platform for AI agents. Trace, debug, and monitor every TypeSafe AI Jev call your agent makes, with the state, the questions you asked, the typed answers, and token usage on each span, in both TypeScript and Python. Jev is TypeSafe AI’s System One model. Instead of generating text, it reads your application state and answers typed questions: a yes/no probability (Noul), a selected option (Choice), or a rubric score (Score). Agents use it for routing, guardrails, and scoring, so these are exactly the decisions you want visible in a trace. Laminar auto-instruments the TypeSafe SDK: initialize Laminar once and every System One call is traced.
Getting Started
Jev is in early access: create your key in the TypeSafe console. No account yet? Use an OpenRouter API key with
TYPESAFE_BASE_URL=https://openrouter.ai/api instead.- TypeScript
- Python
1. Install Laminar and the TypeSafe SDK
2. Set up your environment variables
Store your API keys in a.env file:3. Initialize Laminar
@typesafe-ai/sdk is loaded as an ES module in most projects, so pass the client class to instrumentModules for Laminar to patch it:4. Use the TypeSafe SDK as usual
systemOne calls are now traced in Laminar.What Laminar captures
Each call becomes an LLM span namedtypesafe.system_one. Every span carries:
- The model that answered (
jev-1.13.0, or the resolved default when you rely onjev-latest). - The state you sent, shown as the span input.
- The full question set: instructions and criteria for every
Noul,Choice, andScore. - The typed answers, shown as the span output, with probabilities and confidence intact.
- Input and output token counts.
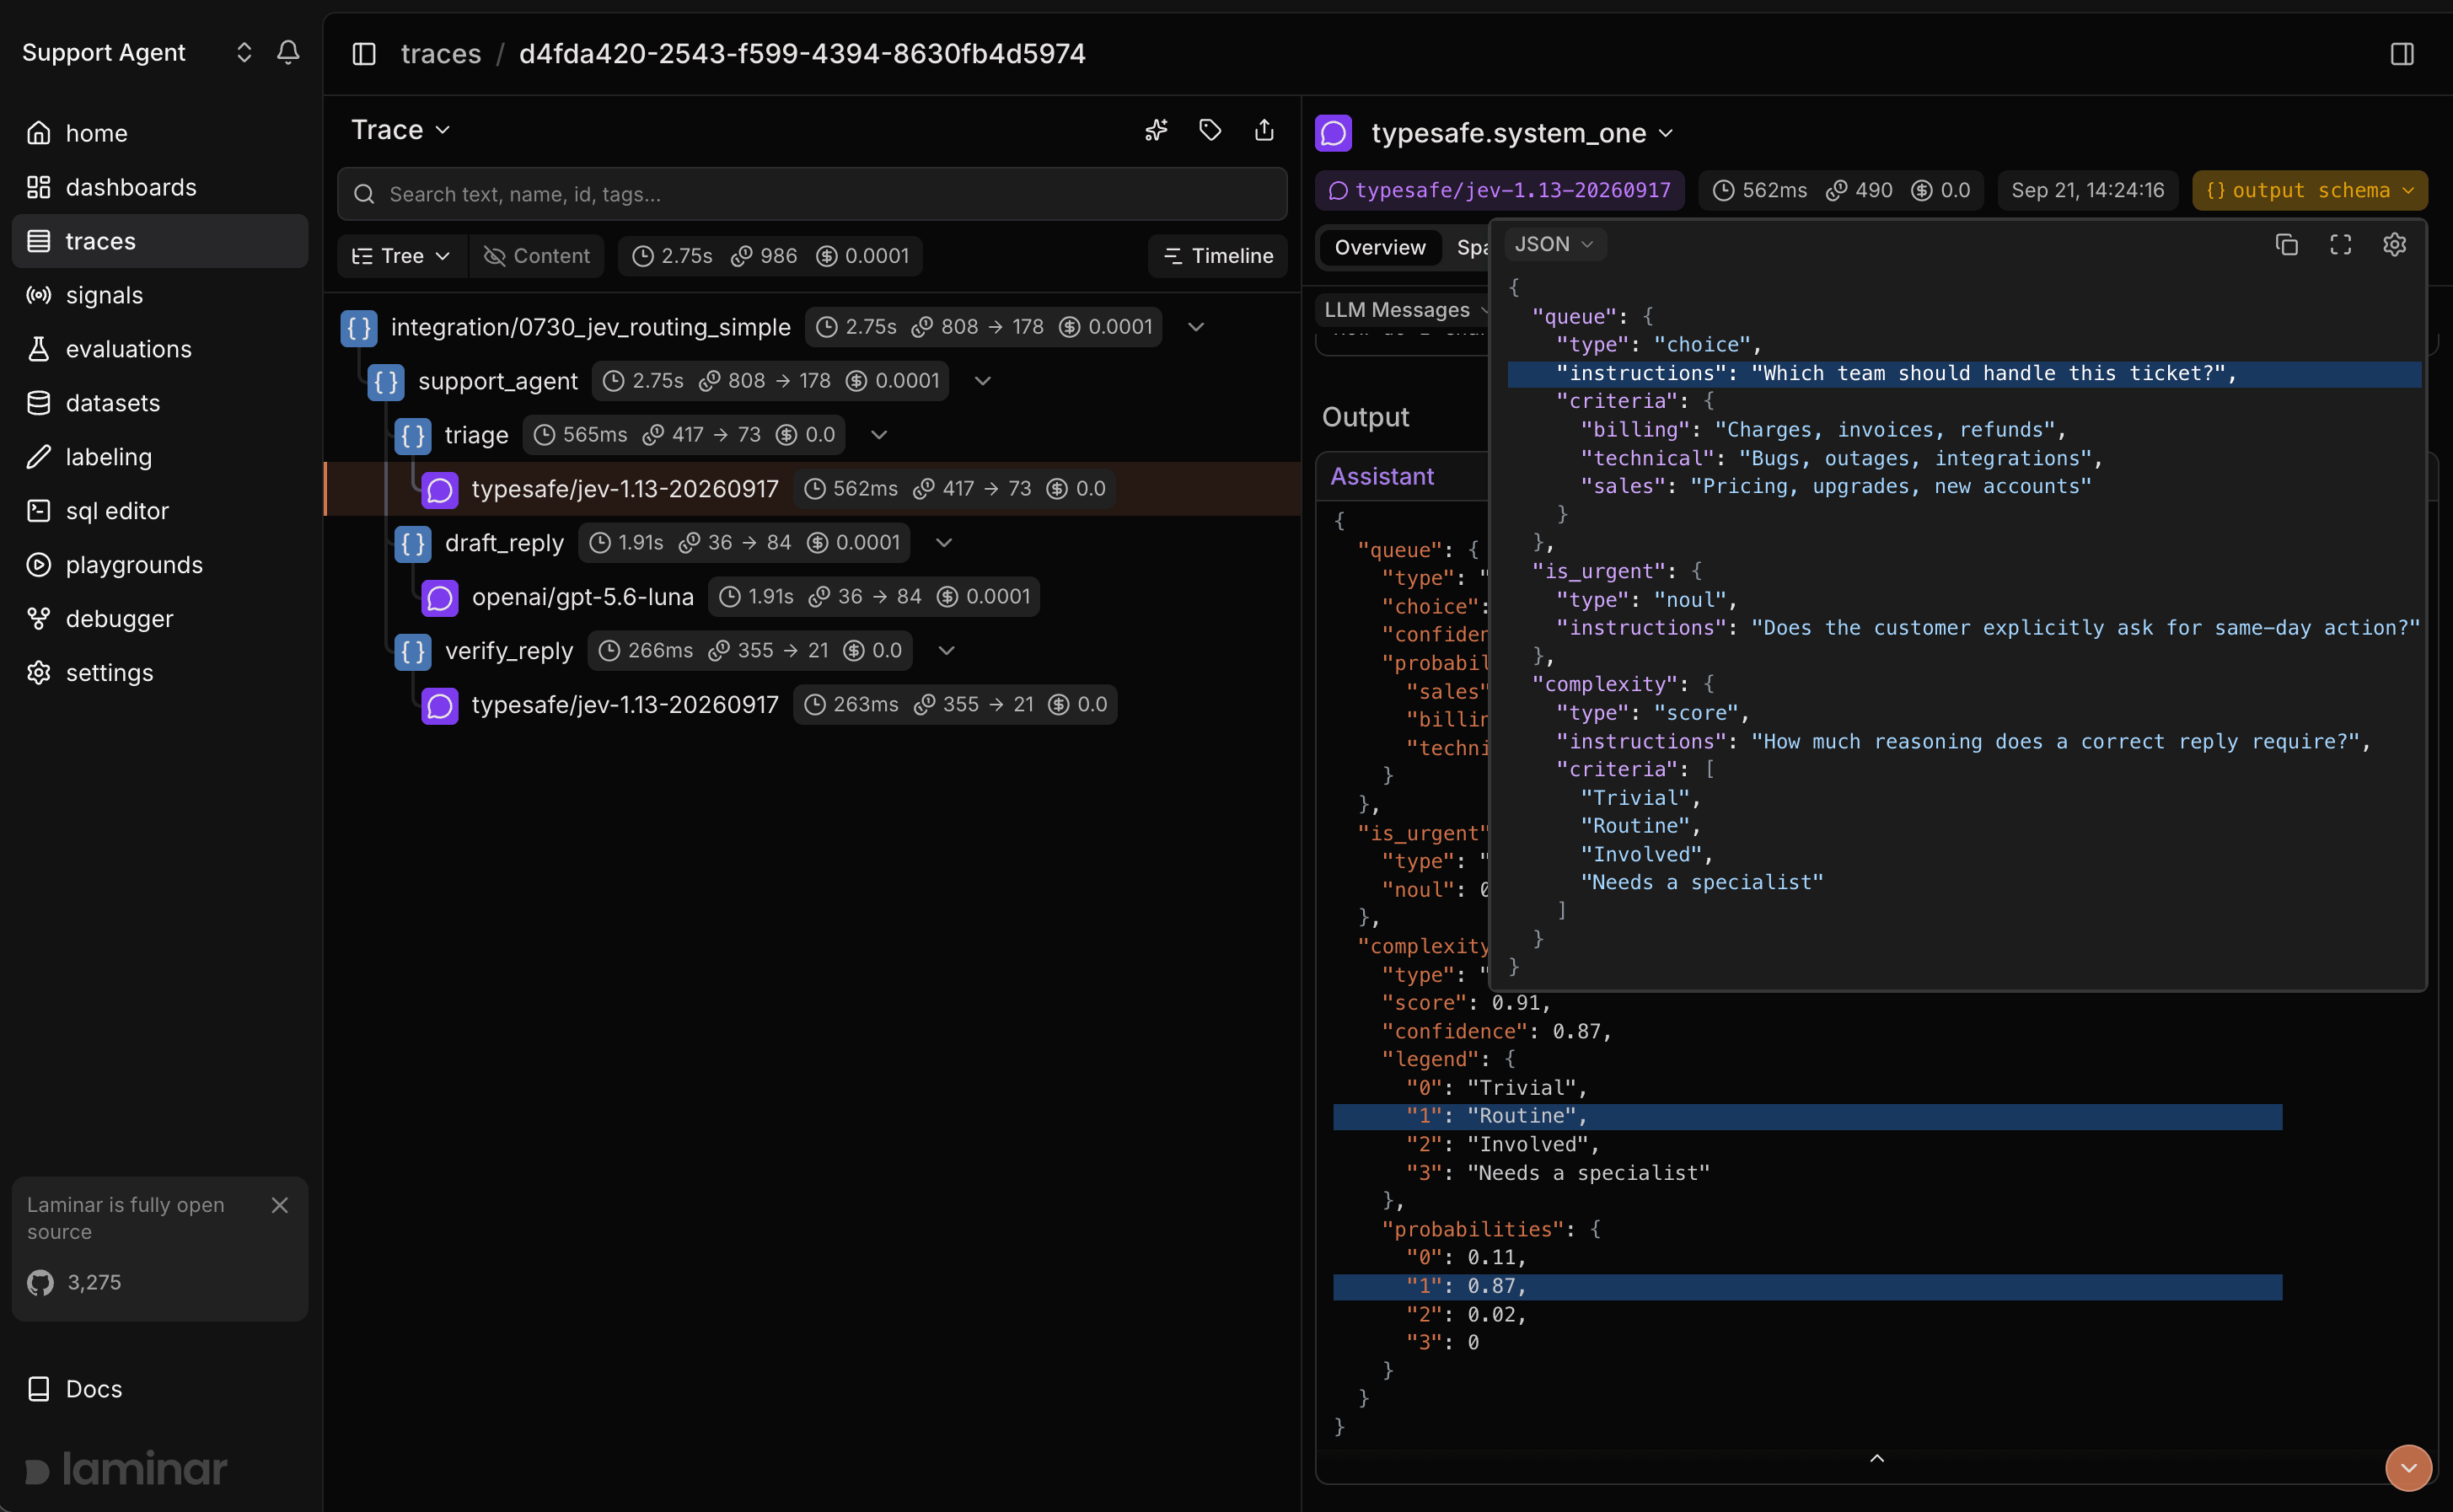
A support agent trace: the selected Jev span carries the typed answers, with the chosen queue, urgency probability, and rubric score on the span output and the question set in the output schema. The drafted reply and a second Jev verification call sit inline in the same trace.
See what happened in a trace
Open a trace in Laminar and you land on the transcript view: Laminar extracts the agent input, the model’s turns, and any tool calls into a conversation, so you read what happened instead of clicking through a tree of span names. A Jev call sits inline with the LLM calls it routes or guards, so you can see the classification next to the action it triggered. More on the trace UX: Viewing traces.Track outcomes with Signals
Traces answer what happened on this run. Signals answer the cross-trace question: how often does the guardrail fire, which queue gets the most tickets, when does confidence drop below the threshold you tuned for. A Signal pairs a plain-language prompt with a JSON output schema. Laminar runs it live on new traces (Triggers) or backfills it across history (Jobs) and records a structured event every time it matches. From there you query, cluster, and alert on events across every trace.Query across traces
- SQL editor for ad-hoc queries across traces, spans, signals, and evals.
- SQL API for programmatic access from scripts and pipelines.
- CLI (
lmnr-cli sql query) for terminal-driven queries and piping JSON into shell tools or coding agents. - MCP server to query Laminar directly from Claude Code, Cursor, Codex, or any MCP-aware client.
Enrich your TypeSafe traces
- Attach sessions, user IDs, metadata, and tags to TypeSafe spans via the SDK reference.
- Wrap the functions around your Jev calls with
observeand mark them as TOOL spans so they show up in the transcript. - Set
LMNR_TRACE_CONTENT=falseto keep the model and token counts while omitting state, questions, and answers from spans.
What’s next
Viewing traces
Read the transcript view, filter, and search across traces.
Signals
Detect behaviors and failures across every run, then query, cluster, and alert on them.
SQL editor and MCP server
Query traces programmatically from the UI, API, or your IDE.
Tracing structure
Add sessions, metadata, and tags, and group calls under your own spans.
Related integrations
OpenAI
Trace the OpenAI SDK directly in TypeScript and Python.
Anthropic
Trace the Anthropic SDK directly in TypeScript and Python.
LiteLLM
One integration for every model LiteLLM routes to.
OpenRouter
Trace any model called through OpenRouter, Jev included.
Gemini
Trace Gemini calls made with the Google Gen AI SDK.
All integrations
Browse every provider, framework, coding agent, and browser integration Laminar supports.