
AI agent drift is a change in an agent's behavior across runs compared with its recent baseline. A prompt edit ships, tool calls climb, and individual traces still look plausible. To decide whether you're seeing a regression, compare recent runs with a baseline, then separate release effects from traffic changes.
Laminar has no native statistical anomaly detection. This guide uses SQL you schedule and own, alongside Signal findings. The worked example is a simulated project with seeded behavior changes and Issues findings, not a test of evaluator accuracy.
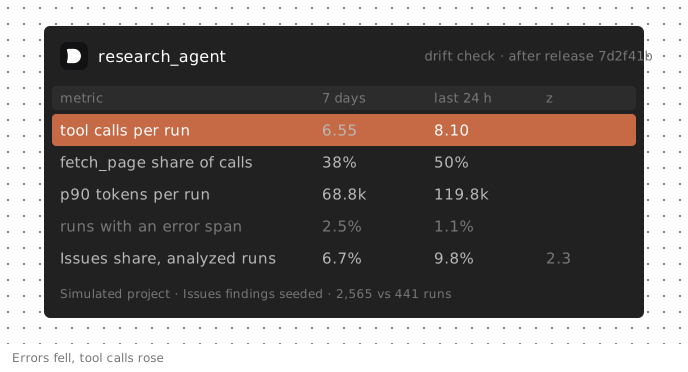
A simulated research agent one day after a release: tool calls per run crossed the example threshold while the error rate fell and the seeded Issues share stayed below its threshold.
What agent drift looks like: a simulated regression
The project contains 6,537 synthetic traces over two weeks from two agents: one planted regression and one traffic change. Issues findings were seeded, not model-evaluated. The effect sizes are constructed; the query results were measured against that synthetic data.
The research agent searches the web, fetches pages, reads PDFs and writes a report. Release 7d2f41b represents a truncated-page bug: three to five extra consecutive fetch_page calls in 38% of its runs, with a 13-point higher chance of an Issues finding on those runs.
The comparison uses a 24-hour window ending 1 hour ago and the preceding 7 days, about one day after full rollout:
| Research agent | Baseline (7 days) | Recent 24 hours |
|---|---|---|
| Runs | 366 per day | 441 |
| Tool calls per run | 6.55 | 8.10 |
| p90 tokens per run | 68,811 | 119,837 |
| p90 duration | 40.6 s | 55.3 s |
| Runs with an error span | 2.5% | 1.1% |
| Analyzed runs with an Issues finding | 6.7% | 9.8% |
An error-rate alert sees an improvement. The Issues share exceeded the 3.9% to 7.5% daily range through November 17, but its z-score was 2.3, below this guide's example outcome threshold of 3. Tool calls per run moved by 14 standard errors and crossed the example threshold of 4 within ten hours of full rollout.
That ordering follows from the scenario's construction: affected runs received extra calls, while findings appeared on only a fraction of them. Watch behavior and outcomes together, and check which moves first on your traffic.
Four kinds of agent drift
| Drift type | What changes | How you measure it |
|---|---|---|
| Input or task mix | What users ask for | Share of runs per segment |
| Run shape | Steps, tool calls, tokens, latency, errors | Per-run averages and percentiles |
| Behavior mix | Which tools run, how often one repeats | Tool share, repeated-call rate |
| Outcome | Detected failures | Share of analyzed runs with a finding, new clusters |
Input drift isn't a regression by itself, but it can move the other three layers. Attribution matters before you act.
Per-trace failure detection, covered in Automatic Failure Detection for AI Agents, evaluates individual runs. Drift detection compares populations. One run with nine tool calls needn't be a failure; a thousand such runs after a deploy can warrant investigation.
Compare a recent window against a baseline
Compare the same per-run metrics in both windows. Laminar's SQL editor exposes spans, traces and Signal results together, so one query can return run shape and outcome findings:
WITH runs AS (
    SELECT
        trace_id,
        anyIf(name, parent_span_id = toUUID('00000000-0000-0000-0000-000000000000')) AS agent,
        min(start_time) >= now() - INTERVAL 25 HOUR AS recent,
        countIf(span_type = 'TOOL') AS tool_calls,
        sum(total_tokens) AS tokens,
        trace_id IN (
            SELECT trace_id FROM signal_runs
            WHERE signal_id IN (SELECT id FROM signals WHERE name = 'Issues')
              AND status = 'COMPLETED'
              AND updated_at >= now() - INTERVAL 9 DAY
        ) AS analyzed,
        trace_id IN (
            SELECT trace_id FROM signal_events
            WHERE signal_name = 'Issues'
              AND severity >= 1
              AND timestamp >= now() - INTERVAL 9 DAY
        ) AS flagged
    FROM spans
    WHERE start_time >= now() - INTERVAL 193 HOUR
      AND trace_id IN (
          SELECT id FROM traces
          WHERE start_time >= now() - INTERVAL 193 HOUR
            AND start_time < now() - INTERVAL 1 HOUR
      )
    GROUP BY trace_id
)
SELECT
    agent,
    countIf(NOT recent) AS baseline_runs,
    countIf(recent) AS recent_runs,
    round(avgIf(tool_calls, NOT recent), 2) AS baseline_tools,
    round(avgIf(tool_calls, recent), 2) AS recent_tools,
    round((recent_tools - baseline_tools)
        / sqrt(varSampIf(tool_calls, NOT recent) / baseline_runs
             + varSampIf(tool_calls, recent) / recent_runs), 1) AS tools_z,
    round(avgIf(tokens, recent) / avgIf(tokens, NOT recent) - 1, 2) AS tokens_change,
    countIf(analyzed AND NOT recent) AS baseline_analyzed,
    countIf(analyzed AND recent) AS recent_analyzed,
    round(baseline_analyzed / baseline_runs, 2) AS baseline_coverage,
    round(recent_analyzed / recent_runs, 2) AS recent_coverage,
    round(countIf(flagged AND analyzed AND NOT recent) / baseline_analyzed, 3) AS baseline_flagged,
    round(countIf(flagged AND analyzed AND recent) / recent_analyzed, 3) AS recent_flagged,
    round(countIf(flagged AND analyzed) / countIf(analyzed), 4) AS pooled_flagged,
    if(baseline_analyzed >= 200 AND recent_analyzed >= 100 AND pooled_flagged * recent_analyzed >= 5,
        round((recent_flagged - baseline_flagged)
            / sqrt(pooled_flagged * (1 - pooled_flagged)
                   * (1 / baseline_analyzed + 1 / recent_analyzed)), 1),
        NULL) AS flagged_z
FROM runs
WHERE agent != ''
GROUP BY agent
HAVING baseline_runs >= 200 AND recent_runs >= 50
ORDER BY abs(tools_z) DESC
The query returned these selected columns:
| agent | recent_runs | tools | tools_z | tokens | coverage | flagged share | flagged_z |
|---|---|---|---|---|---|---|---|
| research_agent | 441 | 6.55 → 8.10 | 14.1 | +42% | 1.00 → 1.00 | 0.067 → 0.098 | 2.3 |
| ticket_triage | 161 | 2.57 → 3.58 | 7.0 | +123% | 0.74 → 0.83 | 0.043 → 0.067 | 1.2 |
Treat the z-scores as screening statistics under an independence assumption, rather than calibrated anomaly tests. tools_z divides the mean difference by its standard error. flagged_z uses a pooled two-proportion calculation. A null outcome statistic means the comparison is unavailable. It does not establish that nothing changed.
The query includes several safeguards:
- Maturity lag. The recent window ends an hour ago to reduce incomplete runs and evaluation lag. Increase it for longer runs or for batch-mode Signals, which return results within several hours.
- Outcome cohort. Issues defaults to traces with more than 1,000 tokens. Findings count only among runs with completed Issues analysis. Coverage rose from 74% to 83% for triage because the traffic change added longer tickets: eligibility moved, not just quality.
- Volume guards. The HAVING clause drops agents with too few runs. The outcome calculation has additional minimums for analyzed runs and expected findings.
A backtest covered nine timestamps before either change, from November 14 to 17. Tool-call z-scores ranged from -1.7 to 1.2; the outcome z-score peaked at 2.4. At five of the nine timestamps, triage's flagged_z was null, with under 100 analyzed runs. Checks 4 and 10 hours into full rollout put the research agent's tools_z at 2.9 and 7.7.
The thresholds of 4 and 3 are illustrative. Calibrate yours on your history, including weekly seasonality, which this simulation doesn't model. Name the top span consistently: this query treats that name as the agent's identity.
Tool mix and repeated calls: behavior drift
After run shape flags a change, compare each tool's share of calls:
SELECT
    name AS tool,
    round(countIf(start_time < now() - INTERVAL 25 HOUR)
        / sum(countIf(start_time < now() - INTERVAL 25 HOUR)) OVER (), 3) AS baseline_share,
    round(countIf(start_time >= now() - INTERVAL 25 HOUR)
        / sum(countIf(start_time >= now() - INTERVAL 25 HOUR)) OVER (), 3) AS recent_share,
    round(recent_share - baseline_share, 3) AS share_change
FROM spans
WHERE span_type = 'TOOL'
  AND start_time >= now() - INTERVAL 193 HOUR
  AND trace_id IN (
      SELECT id FROM traces
      WHERE top_span_name = 'research_agent'
        AND start_time >= now() - INTERVAL 193 HOUR
        AND start_time < now() - INTERVAL 1 HOUR
  )
GROUP BY tool
ORDER BY abs(share_change) DESC
fetch_page rose from 38.4% to 50.2% of tool calls, giving you a place to investigate. This requires the TOOL span type. Integrations set it; manual observe wrappers must set it explicitly.
Next, measure three consecutive calls to the same tool:
WITH runs AS (
    SELECT
        trace_id,
        if(min(start_time) >= now() - INTERVAL 25 HOUR, 'recent', 'baseline') AS window,
        arrayMap(t -> tupleElement(t, 2), arraySort(groupArray((start_time, name)))) AS tools
    FROM spans
    WHERE span_type = 'TOOL'
      AND start_time >= now() - INTERVAL 193 HOUR
      AND trace_id IN (
          SELECT id FROM traces
          WHERE top_span_name = 'research_agent'
            AND start_time >= now() - INTERVAL 193 HOUR
            AND start_time < now() - INTERVAL 1 HOUR
      )
    GROUP BY trace_id
)
SELECT
    window,
    count() AS runs,
    round(avg(arrayExists(i -> tools[i] = tools[i + 1] AND tools[i] = tools[i + 2],
        range(1, greatest(length(tools) - 1, 1)))), 3) AS same_tool_3x_rate
FROM runs
GROUP BY window
The query orders tool calls by start time and only sees runs with tool spans. Both tool queries split the windows on span timestamps, so a run that crosses the 25-hour boundary can fall in a different window than in the main query.
The repeated-call rate rose from 39.7% to 61.5%. Fetching three pages consecutively is normal for this agent: a fixed three-call alert would fire on about 40% of baseline runs. For an obvious single-run loop, such as identical arguments twenty times, use a Signal to inspect arguments; this query doesn't.
Outcome drift: failure share and new failure modes
Track both increasing finding rates and potentially new failure modes.
For the first, measure the share of analyzed runs with an Issues finding. The Issues Signal is preselected for new projects. For a daily trend, reuse the check's analyzed and flagged subqueries on traces, group by toStartOfDay(start_time), and chart the share on a dashboard.
Laminar groups Signal events into clusters by the meaning of their findings. A New cluster alert fires when a cluster appears. UI-created Signals start with this alert, but it requires the clustering service and stays silent on deployments without it.
Scheduled reports compare event counts with the previous period and rank clusters by change. Those counts aren't traffic-normalized. Reports identify growing finding groups; SQL measures the affected share of analyzed runs.
Attribute the shift before calling it a regression
Both agents moved. Group metrics by possible explanations: release, model and input segment.
SELECT
    top_span_name AS agent,
    release,
    simpleJSONExtractString(metadata, 'source') AS source,
    if(start_time >= now() - INTERVAL 25 HOUR, 'recent', 'baseline') AS window,
    count() AS runs,
    round(runs / sum(runs) OVER (PARTITION BY agent, window), 3) AS share_of_window,
    round(avg(total_tokens)) AS avg_tokens
FROM traces
WHERE start_time >= now() - INTERVAL 193 HOUR
  AND start_time < now() - INTERVAL 1 HOUR
GROUP BY agent, release, source, window
ORDER BY agent, release, source, window
| agent | release | source | window | runs | share | avg tokens |
|---|---|---|---|---|---|---|
| research_agent | a1c93e0 | baseline | 2,494 | 0.97 | 49,926 | |
| research_agent | 7d2f41b | baseline | 71 | 0.03 | 72,394 | |
| research_agent | 7d2f41b | recent | 441 | 1.00 | 71,836 | |
| ticket_triage | e40b7aa | chat | baseline | 761 | 0.82 | 1,482 |
| ticket_triage | e40b7aa | chat | recent | 74 | 0.46 | 1,404 |
| ticket_triage | e40b7aa | baseline | 172 | 0.18 | 15,370 | |
| ticket_triage | e40b7aa | recent | 87 | 0.54 | 15,523 |
The research agent's shift points to the release. The 71 baseline runs on 7d2f41b include the canary and the first hours of full rollout. In the 12-hour canary alone, 46 runs on 7d2f41b averaged 76,699 tokens against 49,695 for 130 runs on a1c93e0 during the same hours. Concurrent canaries strengthen attribution when the router assigns runs independently of input. This still isn't proof: inspect the release diff next.
The triage agent's shift looks like input drift. It used one release throughout. Tokens per run barely moved within each source, while email tickets, ten times longer, rose from 18% to 54% of runs. You may need more capacity or an email-specific prompt, but a rollback is unlikely to change the traffic mix.
Record these attribution fields:
- Release. Set a release explicitly or use LMNR_RELEASE; automatic detection also checks platform variables and .git. The recorded value is available as traces.release.
- Model. spans.model contains the response model, falling back to the request model. The simulation's model changed a week before the shift, which argues against an immediate model-switch explanation.
- Input segment. Group a trace metadata key using simpleJSONExtractString(metadata, '<key>'). Without segments, task-mix changes and regressions can produce the same aggregate shift.
Agent versions (beta) adds a fourth dimension: traces.agent_versions records versions of system prompts and tool definitions. Use ARRAY JOIN agent_versions AS v and group by v.version_hash to align prompt or tool changes with the shift.
Run the drift check on a schedule
Laminar's native alerts cover Signal events and new clusters, not metric thresholds. Run your baseline query through the SQL API. Save it as drift_check.sql and schedule this script with cron.
At each check, it reports run-shape changes and unavailable outcome statistics. Issues-share alerts require two consecutive threshold crossings:
import json
import os
import urllib.request
from pathlib import Path

from lmnr import LaminarClient

TOOLS_Z = 4
FLAGGED_Z = 3
STATE = Path("drift_state.json")

client = LaminarClient()
rows = client.sql.query(Path("drift_check.sql").read_text())
previous = json.loads(STATE.read_text()) if STATE.exists() else {}
current = {}
messages = []

for r in rows:
    agent = r["agent"]
    if r["tools_z"] is not None and abs(r["tools_z"]) >= TOOLS_Z:
        messages.append(
            f"*{agent}* tool calls/run {r['baseline_tools']} -> {r['recent_tools']} "
            f"(z={r['tools_z']}), tokens {r['tokens_change']:+.0%}"
        )
    if r["flagged_z"] is None:
        messages.append(
            f"*{agent}* Issues share unavailable: {r['recent_analyzed']} analyzed runs, "
            f"coverage {r['recent_coverage']}"
        )
    elif r["flagged_z"] >= FLAGGED_Z:
        current[agent] = True
        if previous.get(agent):
            messages.append(
                f"*{agent}* Issues share {r['baseline_flagged']} -> {r['recent_flagged']} "
                f"(z={r['flagged_z']}) on two consecutive checks"
            )

STATE.write_text(json.dumps(current))

for text in messages:
    print(text)
    if url := os.environ.get("SLACK_WEBHOOK_URL"):
        req = urllib.request.Request(
            url,
            data=json.dumps({"text": text}).encode(),
            headers={"Content-Type": "application/json"},
        )
        urllib.request.urlopen(req)
LaminarClient reads LMNR_PROJECT_API_KEY. Persist drift_state.json between checks and avoid concurrent jobs overwriting it. Overlapping windows share most runs, so confirmation filters one-off spikes without doubling statistical evidence.
This is scheduled screening, not immediate loop detection. Realtime-mode Signals return results in minutes; batch-mode results arrive within several hours. Choose the maturity lag accordingly.
AI agent drift detection tools compared
Products differ in what they baseline and how you configure alerts:
- Datadog Agent Observability emits ml_obs.* metrics for traces, errors, durations and tokens. Its metrics documentation says they work in monitors like other metrics, so anomaly monitors can baseline them without SQL. Patterns clusters traffic into topics and shows change since the previous run.
- Arize AX monitors tracing projects on span attributes, including latency, status, token counts, eval labels and custom metadata. It offers automatic thresholds based on historical data. Separately, its ML-monitoring documentation covers baseline drift metrics such as PSI, KL, JS and embedding distance.
- Evidently detects text drift by training a classifier to distinguish reference and current data. WhyLabs' whylogs supports input-feature drift detection. Evidently's FAQ says its Cloud is no longer offered as SaaS. WhyLabs says it is discontinuing operations; its platform has been open-sourced.
- Braintrust clusters logs into Topics and alerts when a SQL calculation over a time window crosses a threshold you set.
- LangSmith offers threshold alerts for run count, errors, latency, cost and feedback scores. Insights analyzes usage patterns, behaviors and failure modes. Langfuse offers threshold-based alerts.
An embedding-based input-drift monitor fits semantic topic changes better than these tool-count queries, especially when new requests still use the same tools.
What Laminar contributes here is the shared SQL surface for per-run, per-tool and per-Signal data, followed by release and segment attribution. It also analyzes traces for failures and alerts on new finding clusters. Choose it for that workflow, not because it learns metric baselines automatically.
FAQ
How many runs do I need before a drift check means anything?
Enough that noise is smaller than the change you care about. At a pooled finding share near 6%, with 2,500 baseline and 400 recent analyzed runs, the standard error is about 1.3 percentage points. A difference of about 3.8 points reaches a z of 3. With fewer analyzed runs, compare weeks instead of days.
Why compare against the previous 7 days instead of yesterday?
A 7-day baseline averages weekday and weekend traffic, which can differ in task mix and volume. Day-over-day comparisons can flag predictable Monday changes. With a strong weekly pattern, compare against the same weekday in prior weeks instead.
Will a provider changing the model behind an alias show up?
The model field can expose the switch if the provider returns a distinct snapshot name. If the response repeats the alias, spans.model won't reveal it; a behavioral shift alone cannot identify a model change. Query min(start_time) per model to find each visible identifier's first appearance. The Agent versions docs explain why models are tracked separately from prompt versions.