
Braintrust and Laminar both ingest your traces, both speak OpenTelemetry, and both let you ask what your AI did in production. They are built for different jobs.
Braintrust is an eval platform: write a scorer, sweep it across prompts and models, catch the regression before the PR merges. It is mature and specialized at that one thing.
Laminar is built for the full agent loop: get alerted when an agent breaks, see why in seconds, find the pattern, ship a fix, and prove it held. Braintrust owns a step. Laminar owns the loop.
This is written by the Laminar team. Every Braintrust feature, price, and limit below comes from Braintrust's own docs and pricing as of June 2026. Verify anything compliance- or budget-critical against the current vendor pages.
Security and data ownership
Laminar is Apache 2.0, and the whole platform self-hosts. Run docker compose up locally or the production Helm chart on your own cloud, and your data stays in your infrastructure across every deployment mode. Every feature ships in the open-source image, with no Enterprise gate. Optional PII redaction runs at ingest, so raw user data never lands in your trace store at all.
Braintrust is closed source. Its SDKs are open, but Brainstore, the backend that stores and serves your data, is not open source, and self-hosting exists only as an Enterprise "hybrid deployment" where you run the data plane via their Terraform modules while Braintrust runs the control plane as SaaS. Even then, the control plane still holds metadata: experiment, dataset, and project names, encrypted secrets, hashed API keys, and usage telemetry the data plane sends back.
That gap is not theoretical. In May 2026, Braintrust disclosed unauthorized access to one of its AWS accounts that stored customers' AI-provider API keys, and emailed every customer to rotate those keys (TechCrunch). Braintrust said it found no evidence of broader exposure.
The full agent loop
Five steps from broken to fixed. Here is what each gives you.
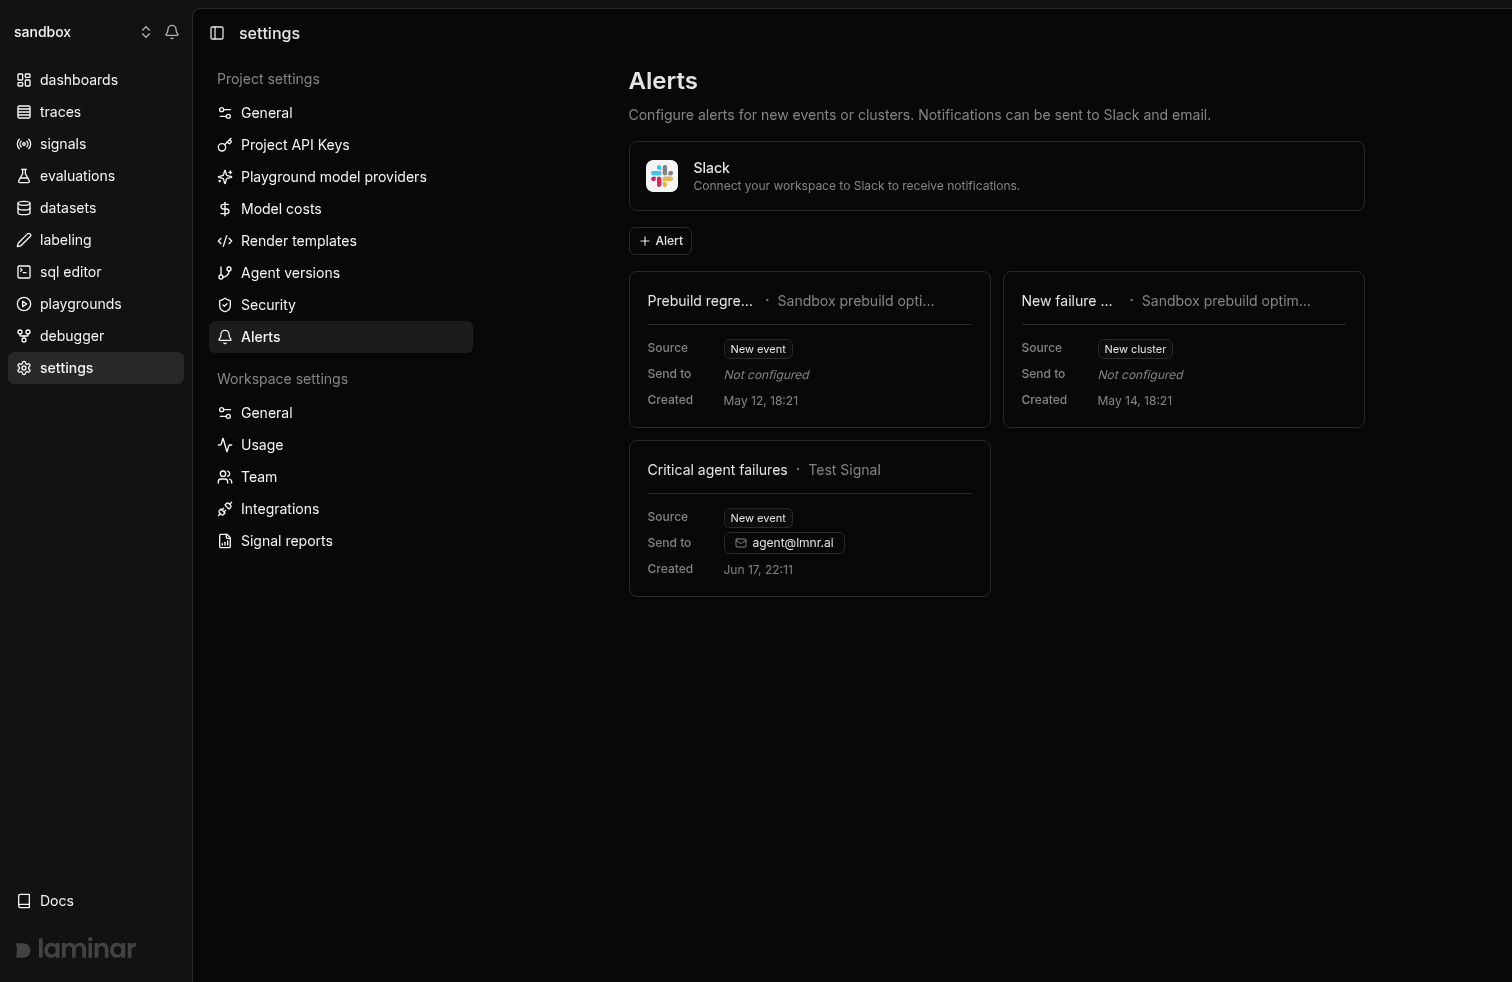
Get alerted when your agent breaks
You cannot fix what you do not know broke. Signals watch for outcomes you describe in plain English ("agent looped on the same tool," "user gave up") and alerts push them to Slack the moment they fire, with a Failure Detector running on day one.
Braintrust runs scorers against a sample of production traces and writes back numeric scores; failure alerting is not its focus.
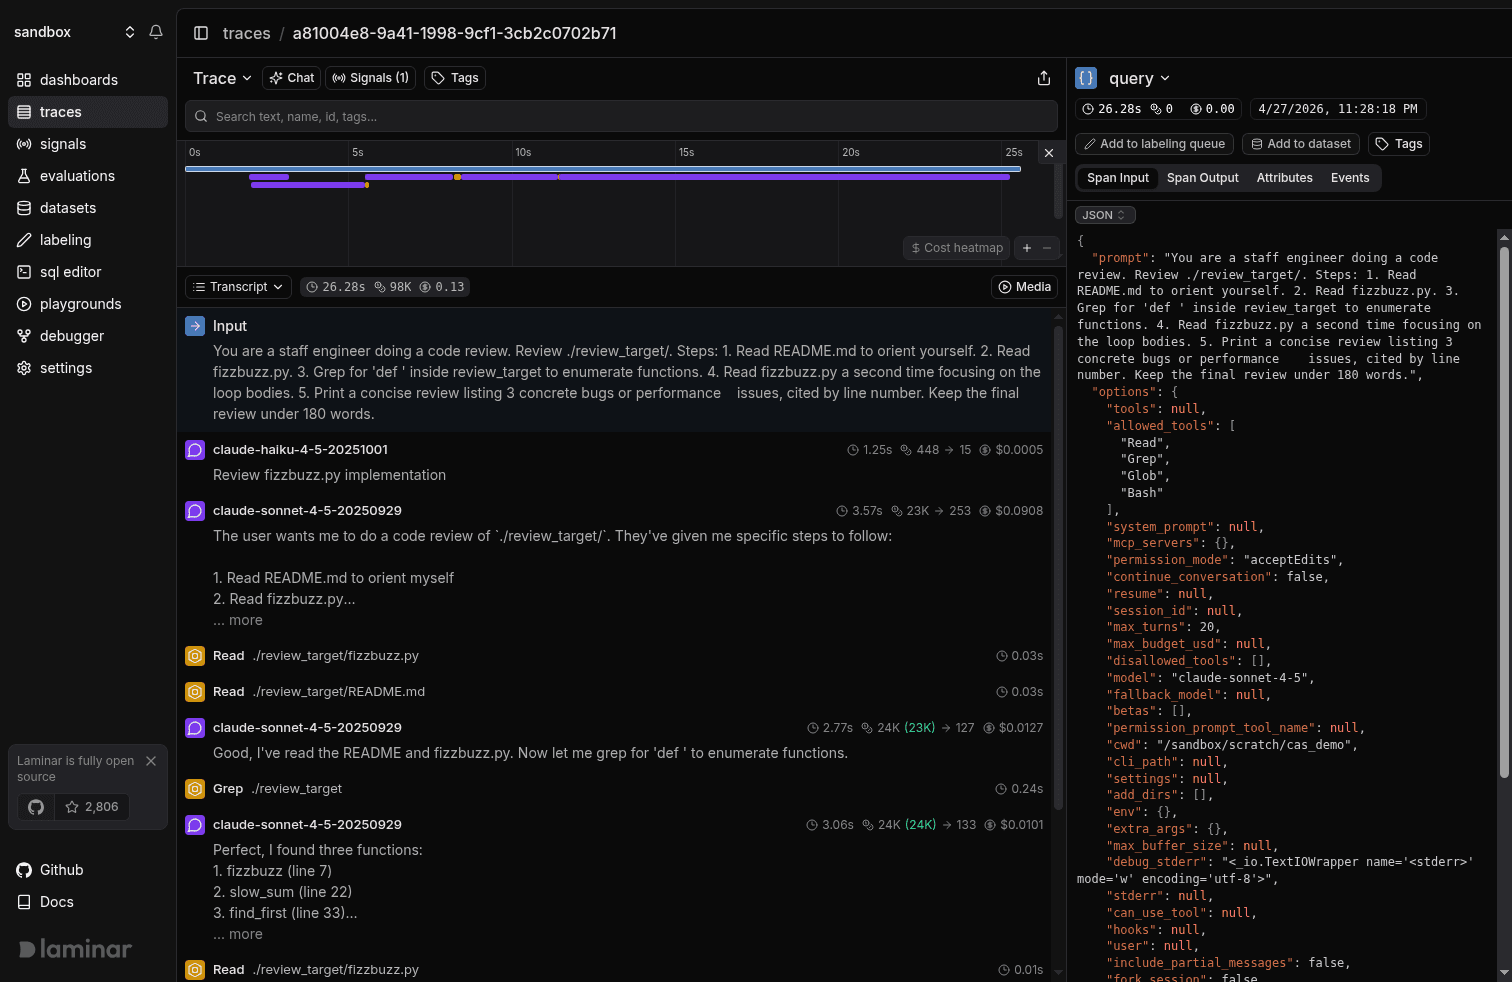
Understand why in seconds
A ten-minute agent run is a 2,000-span trace, and a span tree tells you nothing. Transcript view renders the run as a conversation, with every LLM turn, tool call, and subagent in order, and the input to each agent parsed out for free.
Braintrust opens a trace as a span tree, with a chronological thread view available.
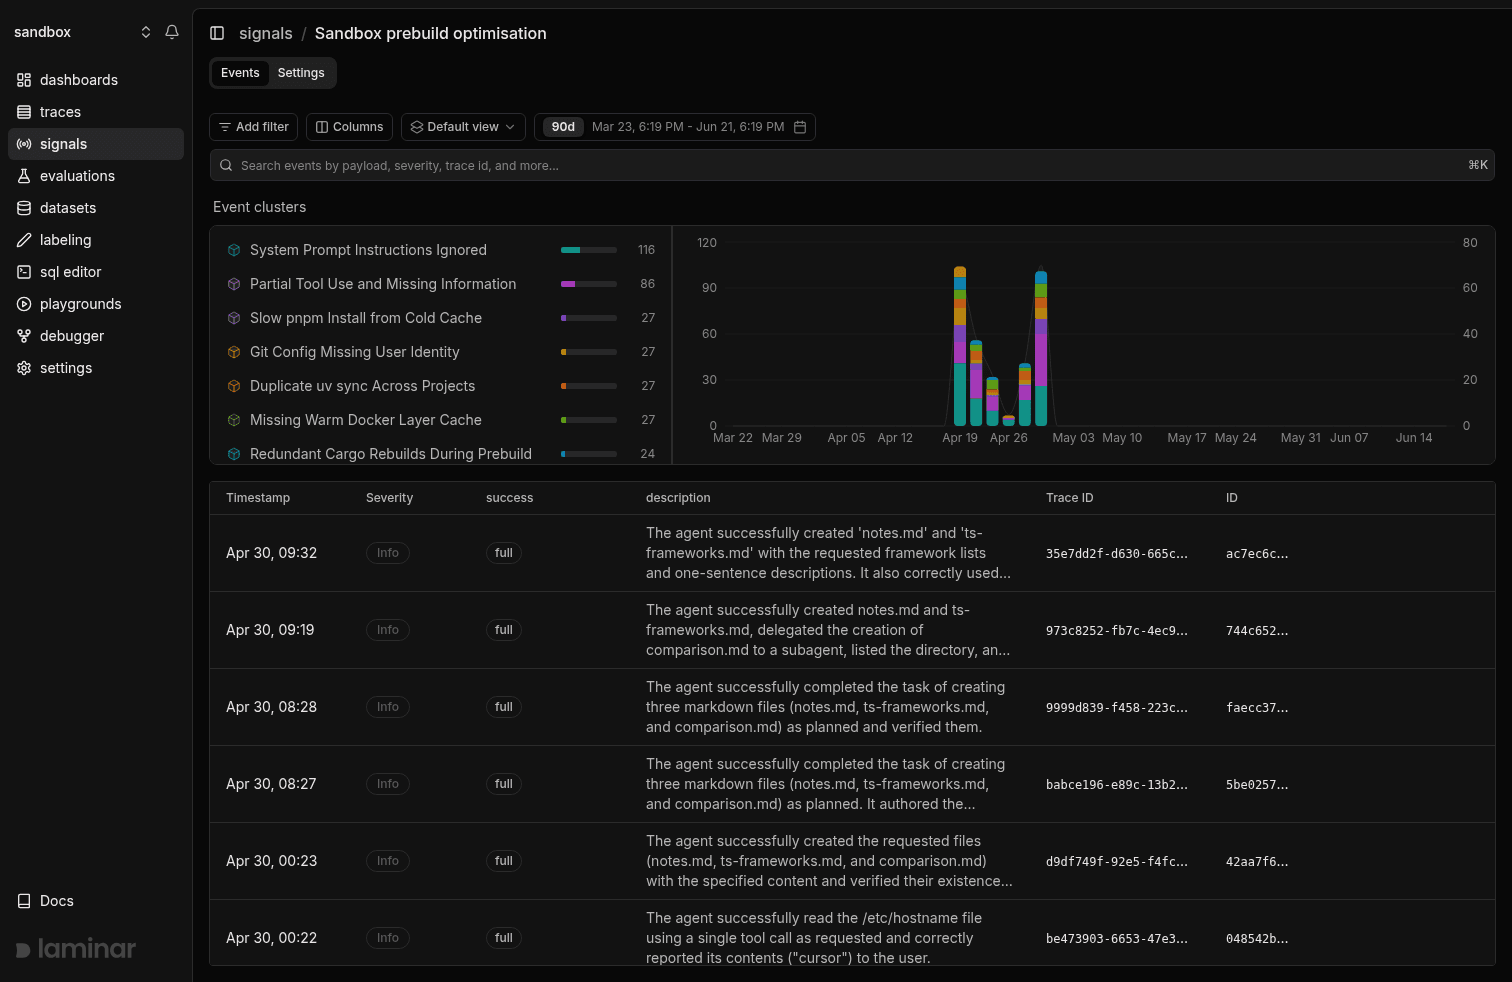
Discover high-level patterns
One trace is an anecdote; ten thousand overnight runs are a dataset you cannot read. Clusters group your signal events automatically and hierarchically, so a cluster that was empty yesterday and full today is a new failure mode you can alert on.
Braintrust's Topics clusters raw traffic in a daily batch.
Implement a fix
The coding agent fixing your bug queries production directly through the MCP server and CLI, and it is real SQL over every table (spans, signal_events, clusters, evaluation_datapoints), not a proprietary dialect. When you need to see what actually happened, the rollout debugger reruns the agent from any step with your changes applied, human-in-the-loop or fully autonomous.
Braintrust's playground iterates a prompt against frozen dataset rows, and its query layer is BTQL, a SQL-like dialect of its own rather than standard SQL.
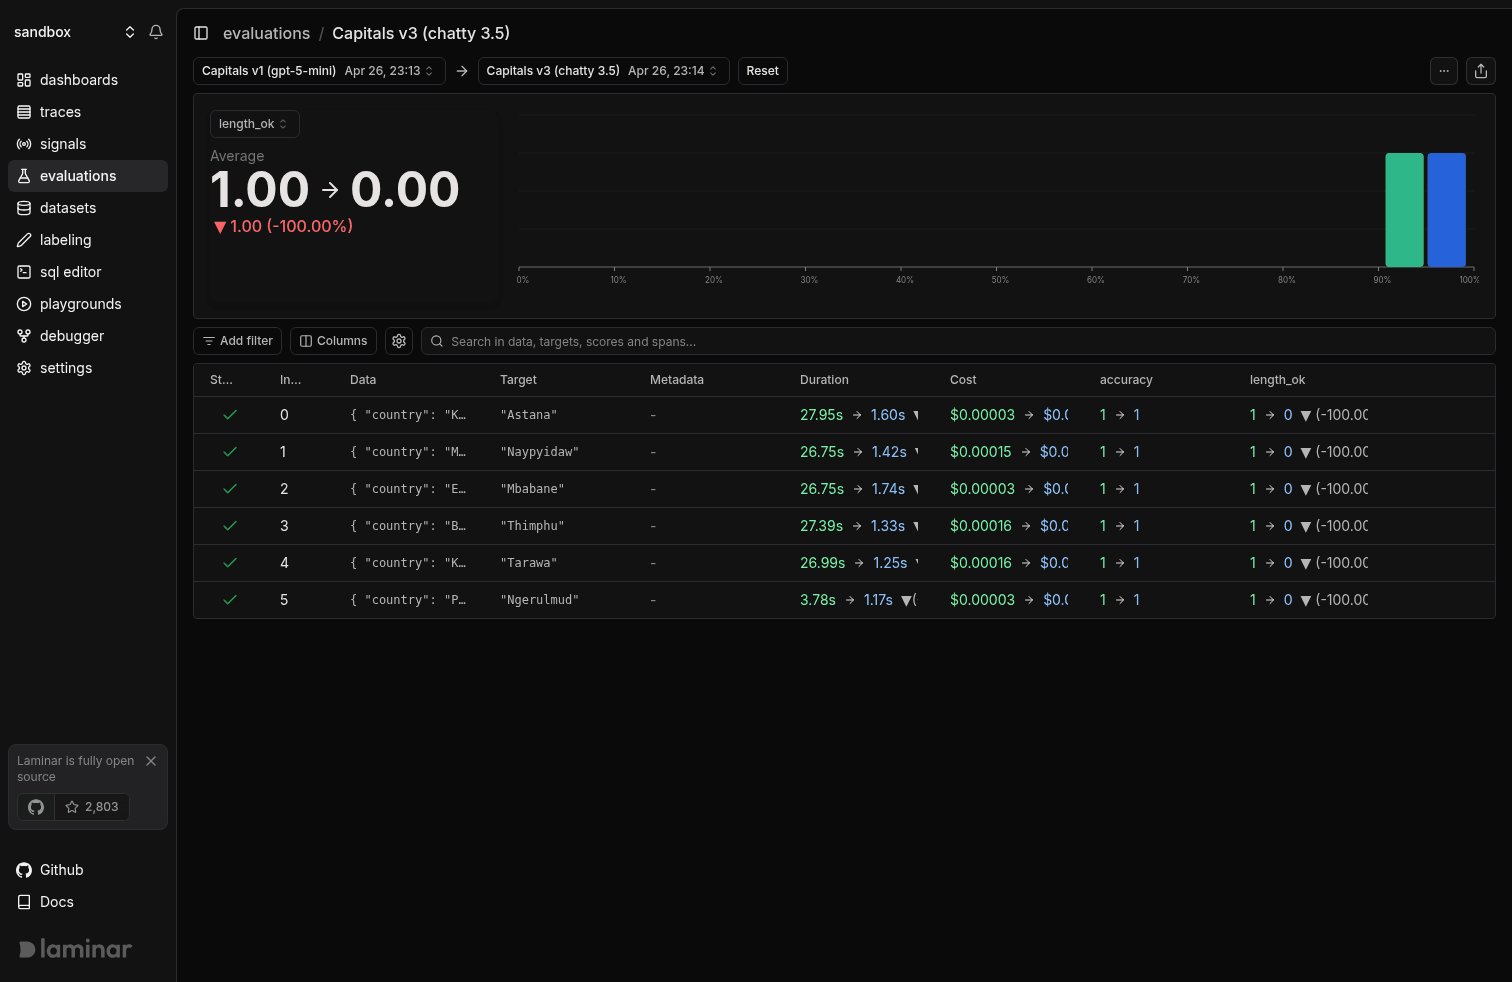
Verify the fix with evals
Recurring failures become datasets, and you confirm the fix held before it ships. Laminar's evaluations framework gives you datasets, code and LLM-as-judge evaluators, human review, and runs you compare across groups.
Braintrust is an eval company first, its harness is more mature and specialized than ours, and if scorer-driven CI regression against frozen datasets is your single most important workflow, theirs is the deeper tool.
The cost difference is structural
A long-running agent re-sends its whole history every turn, so a naively stored 50-turn trace holds ~1,275 message copies for 50 unique messages: storage scales with the square of run length. Laminar deduplicates message content and rebuilds it at query time, for roughly 20x average reduction, up to 50x on long coding agents. Braintrust's docs do not describe content dedup, and it bills processed data plus scores, with no tier between Pro ($249/mo) and Enterprise.
Get started with Laminar
You do not have to rip out Braintrust to try Laminar. OpenTelemetry supports multiple exporters, so you can keep Braintrust wired into CI and point a second exporter at Laminar in production, instrumented once. Start with the free tier or self-host in your own cluster, send one agent's traces, and read a failing run in transcript view. The loop (alert, read, cluster, fix, verify) is the part you cannot get anywhere else.