
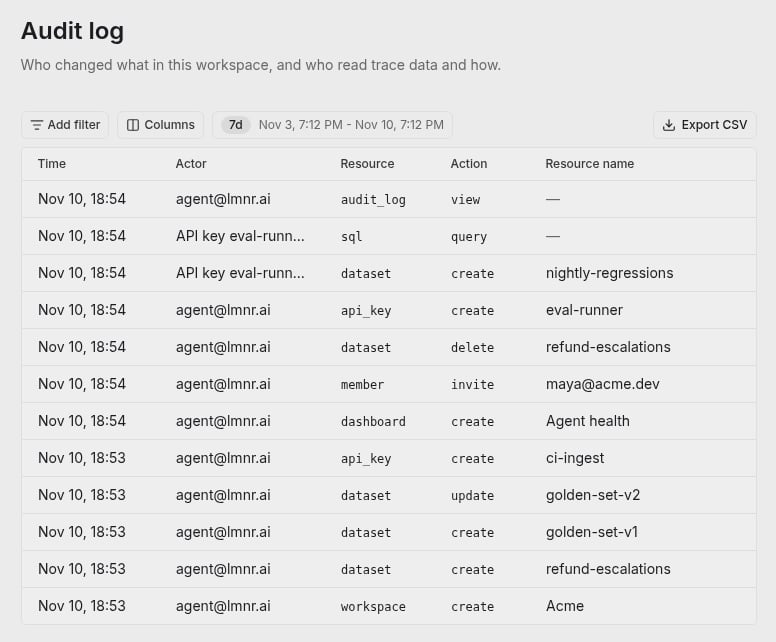
Settings > Audit log: changes made in the UI and by a project API key, newest first
The audit log is available to workspace owners and admins. On Laminar Cloud, it’s included in the Pro and Enterprise plans. Self-hosted deployments have it on every workspace.
Read the log
The table lists events newest first, for the last week by default. Pick a different time range at the top, filter by any column, and use Columns to show, hide, or reorder them:
Names are captured when the event is recorded, so an event still shows a dataset’s or a project’s name after it’s renamed or deleted.
Click a row to see the full event. Besides the columns above, it shows the reported IP address, the user agent, who created the API key (for events by an API key), and the event’s metadata. Metadata holds the details of the action, such as the text and tables of a SQL query, the settings that were changed, or the IDs of every item in a bulk delete.
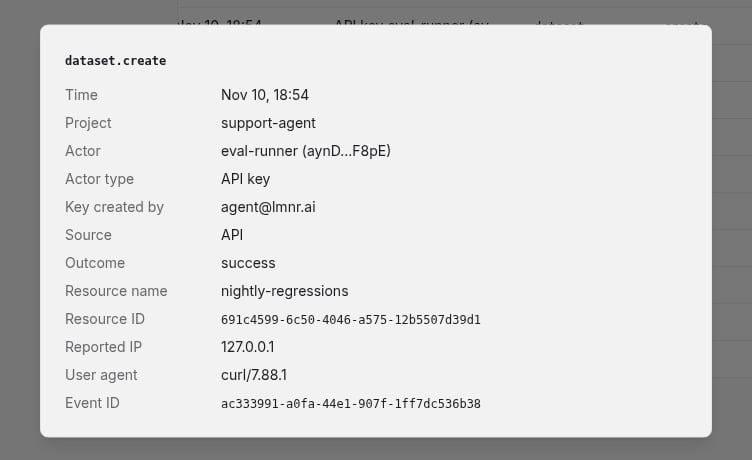
An event made with a project API key, with the key's creator, source, and request details
Export to CSV
Click Export CSV to download the events that match the current filters and time range as a CSV file, up to 100,000 rows. Exporting is itself recorded in the log.What’s recorded
Changes
Every create, update, and delete made from the UI, the API, the CLI, or the MCP server is recorded, including requests that were denied or failed:Reads of trace data
Reads are recorded when they show or export trace data:- Opening a trace, and loading the traces or sessions table. A table load is one event, however far you scroll.
- SQL queries from the SQL editor, dashboards, the SQL API, the CLI, the MCP server, and the Laminar Agent, with the query text and the tables it read.
- Exports: downloading a dataset or an evaluation, and exporting SQL results to a dataset.
- Starting a Laminar Agent chat.
- Viewing the audit log, at most once per hour per user.
What isn’t recorded
- Trace ingestion. Sending spans, logs, and browser session recordings from the SDKs isn’t recorded. Neither are the individual steps of a run: an evaluation or a debugger session is recorded once, when it starts.
- Opening or listing other resources, such as a dataset or the Signals list. Downloading or exporting them is recorded.
- Queries Laminar runs to show built-in pages, such as the trace view’s own lookups. SQL you write, and dashboard charts, are recorded.
- Sign-ins and membership sync. Signing in and out, and members added or removed by SSO or SCIM, aren’t recorded yet.
- Actions in Slack, such as interacting with an alert message.
- Requests Laminar can’t attribute, for example a request with an invalid API key, or a request that’s rejected before Laminar knows which project it’s for.
Related
Projects and API keys
Keys show up in the log by name, with the user who created them.
SQL editor
Every query you run is recorded with its text and tables.
PII redaction
Control which readers see sensitive span content.
Usage limits
Workspace-level settings whose changes appear in the log.